. 2025 Apr;21(4):719-736.
doi: 10.1080/15548627.2024.2407707. Epub 2024 Oct 9.

Autophagy controls neuronal differentiation by regulating the WNT-DVL signaling pathway

Affiliations

Autophagy controls neuronal differentiation by regulating the WNT-DVL signaling pathway

Vincencius Vidyawan et al. Autophagy. 2025 Apr.

Abstract

Macroautophagy/autophagy dysregulation is associated with various neurological diseases, including Vici syndrome. We aimed to determine the role of autophagy in early brain development. We generated neurons from human embryonic stem cells and developed a Vici syndrome model by introducing a loss-of-function mutation in the EPG5 gene. Autophagy-related genes were upregulated at the neuronal progenitor cell stage. Inhibition of autolysosome formation with bafilomycin A1 treatment at the neuronal progenitor cell stage delayed neuronal differentiation. Notably, WNT (Wnt family member) signaling may be part of the underlying mechanism, which is negatively regulated by autophagy-mediated DVL2 (disheveled segment polarity protein 2) degradation. Disruption of autolysosome formation may lead to failure in the downregulation of WNT signaling, delaying neuronal differentiation. EPG5 mutations disturbed autolysosome formation, subsequently inducing defects in progenitor cell differentiation and cortical layer generation in organoids. Disrupted autophagy leads to smaller organoids, recapitulating Vici syndrome-associated microcephaly, and validating the disease relevance of our study.Abbreviations: BafA1: bafilomycin A1; co-IP: co-immunoprecipitation; DVL2: dishevelled segment polarity protein 2; EPG5: ectopic P-granules 5 autophagy tethering factor; gRNA, guide RNA; hESC: human embryonic stem cells; KO: knockout; mDA, midbrain dopamine; NIM: neural induction media; NPC: neuronal progenitor cell; qPCR: quantitative polymerase chain reaction; UPS: ubiquitin-proteasome system; WNT: Wnt family member; WT: wild type.

Keywords: EPG5; Vici syndrome; WNT signal pathway; human embryonic stem cells; macroautophagy; neuronal differentiation.


Conflict of interest statement

No potential conflict of interest was reported by the author(s).

Figures

Figure 1.
Figure 1.
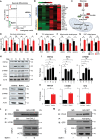
Inhibition of autolysosome formation impairs neuronal differentiation. (A) Time-dependent expression of autophagy-related genes: ATG7, ATG12, ATG16L1, and PIK3C3 measured by quantitative polymerase chain reaction. The y-axis indicates the relative expression of messenger RNA normalized to ACTB/β-ACTIN. (B) Schematic representation of mDA neuron differentiation from human embryonic stem cells. BafA1 (10 nM) was administered for 6 h per day at indicated time points. (C, D) immunocytochemical analysis of NPC (NES) and neuronal (TUBB3) markers on day 11. Percentage of NES+ or TUBB3+ per total cells (D). (E, F) Western blot (E) and the quantifications (F) of TUBB3 and NES protein expressions on day 11 after BafA1 treatment at indicated time points. (G, H) immunocytochemical assay of proliferation marker (MKI67) and EdU labeling at day 11 after BafA1 treatment from days 6–10 of differentiation. Percentage of MKI67+ or EdU+ per total cell. Significant difference from control at *p < 0.05 and **p < 0.0001; ns, not significant; n = three (A, F) and four (D, H) independent experiments. Scale bar: 200 μm. BafA1, bafilomycin; mDA, midbrain dopamine. Cell line: H9 (A-H).
Figure 2.
Figure 2.
Establishment of a reporter system for monitoring autophagy flux. (A) Schematic of gene editing strategy to establish autophagy reporter cell line. Gene encoding double-tagged LC3B was inserted into intron 1 of the AAVS1 locus. (B) Sequencing result confirming successful insertion into AAVS1 locus. (C) Localization of EGFP and mCherry during the process of autophagosome (yellow) and autolysosome formations (red). (D) Number of mCherry+ or mCherry+ GFP+ per total cells (left) and mCherry+ GFP+ among mCherry+ cells (right). Significant difference from control at *p < 0.05 and **p < 0.0001; ns, not significant; n = four independent experiments. Scale bar: 200 μm. Cell line: subclone of H9 (mCherry – egfp – LC3B; B-D).
Figure 3.
Figure 3.
Prolonged activation of WNT signaling in BafA1-treated populations. (A) Principal component analysis of 30,173 genes from RNA sequencing of nine independent samples: undifferentiated (hEscs; three samples), differentiation day 11 cells without (control; three samples) or with BafA1 treatment (BafA1; three samples). (B) Heatmap displaying the relative expression values after z-score normalization of the average log-normalized expression values for each gene related to glycolysis and proliferation marker across cell types derived from all samples. (C) Schematic of glycolysis and TCA cycle. Differentially expressed genes were indicated in red (upregulated) and green (downregulated). (D – G) real-time qPCR analysis of genes related to glycolysis, mitochondrial, TCA cycle, and WNT signaling on day 11. The y-axis indicates the relative expression of mRNA normalized to ACTB/β-ACTIN. (H, I) time-dependent expression of WNT3A, DVL2, CTNNB1, and LC3B during midbrain differentiation shown (H) and quantified (I) with western blot. (J, K) visualization (J) and quantification (K) of WNT3A and downstream targets of WNT signaling proteins, CTNNB1 and MYC on day 11. (L, M) Co-immunoprecipitation shows the interaction between endogenous LC3B and DVL2 (L), as well as between recombinant double-tagged LC3B and endogenous DVL2 on (M). The levels of DVL2-LC3B conjugates, GFP-DVL2, and the total DVL2 in the whole cell lysates (input) were determined with western blot (L, M). Significant difference from control at *p < 0.05 and **p < 0.0001; ns, not significant; n = three independent experiments. Cell line: H9 (A-M).
Figure 4.
Figure 4.
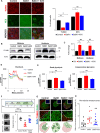
Partial rescue of neuronal differentiation with WNT signaling inhibitor treatment. (A) Immunocytochemical analysis of NES and TUBB3 on midbrain differentiation day 11, without BafA1 (control), with BafA1 (BafA1), and co-treatment with BafA1 and XAV939 (BafA1+XAV). Percentage of NES+ or TUBB3+ cells per total cells (right). BafA1 and XAV939 was administered for 6 h per day on differentiation days 6–11. (B, C) CTNNB1 expression of control, BafA1 and BafA1+XAV939 on midbrain and hindbrain differentiation day 11 were assessed by western blot (B) and quantified (C). (D, E) rate of glycolysis (D), basal and compensatory glycolysis (E) measured with seahorse assay at day 11. n = three technical replicates (D), three (C, E), and four (A) independent experiments. (F) Schematic of BafA1 and XAV939 treatment during cerebral organoid generation (upper); bright field images of cerebral organoids on differentiation day 15 (lower, left); graph depicting the size of organoids in µm (lower, right). BafA1 and XAV939 was administered for 6 h per day on differentiation day 8-11. (G, H) Representative images (upper) and schematic (lower) of PAX6+ and TUBB3+ cells in cerebral organoids on day 15 taken with confocal microscopy (G). Non-tubular areas within organoids were measured from immunostaining images and shown as fold change to control (H). Significant difference from control at *p < 0.05 and **p < 0.0001; ns, not significant; n = 15 (F) and 10 (G) organoids, three independent experiments. Scale bar: 200 μm. Cell line: H9 (A-G).
Figure 5.
Figure 5.
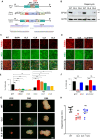
Recapitulation of microcephaly-like phenotype in Vici syndrome model. (A) Schematic of gene editing strategy to establish EPG5-knockout (KO) cell lines. The gene encoding the puromycin resistance gene on the opposite strand was inserted into exon 2 of EPG5 (upper); the sequencing result confirmed successful insertion (lower). (B) EPG5 protein expression in WT hESCs (H9), homozygote (CL5) and heterozygote (CL6) EPG5-KO lines. (C, D) expression of NES and TUBB3 on differentiation day 11 of WT hESCs without (WT) or with BafA1 treatment (BafA1), and EPG5-KO cell lines without (CL5, CL6, CL7 and CL8) or with XAV939 (CL5+XAV). XAV939 was administered continuously on differentiation days 6–11. (E, F) quantification of immunostaining in panel C (E) and D (F). (G) Bright-field images of cerebral organoids on day 15, 30, and 50. (H) Organoid size in mm based on bright field image measurements. Significant difference from control values at *p < 0.05 and **p < 0.0001; ns, not significant; n = four (E, F) independent experiments; n = 10 organoids, three independent experiments. Scale bar: 200 μm (C, D) and 1 mm (E). Cell line: H9 or subclones of H9 (CL5, CL6, CL7, and CL8; B-H).
Figure 6.
Figure 6.
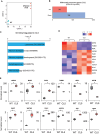
Transcriptome analysis of EPG5-KO cell line. (A) Uniform manifold approximation and projection (UMAP) plot of 35,948 genes from RNA sequencing of six independent samples: wildtype (WT; three samples) and EPG5-KO lines (CL5; three samples). (B) Total number of differentially expressed genes in CL5 vs WT. (C) Selected gene ontology (GO) of downregulated genes on CL5 specific expression. (D) Heatmap displaying the relative expression values after z-score normalization of the average log-normalized expression values for each gene related to neuronal, proliferation, glycolysis, WNT signaling marker across cell types derived from all samples. (E) Further ANOVA analysis displayed as a boxplot for all genes related to neuronal, proliferation, glycolysis, WNT signaling marker. The medians are presented as a black horizontal line, boxes represent upper and lower quartiles. Significant difference from control at *p < 0.05 and **p < 0.0001; ns, not significant; n = three independent experiments. Cell line: H9 or subclone of H9 (CL5; A-E).
Figure 7.
Figure 7.
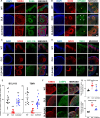
Impairment of cortical neuron development in EPG5-ko-derived cerebral organoids. Immunocytochemistry of cerebral organoids derived from WT hEscs, EPG5-KO cell lines without (CL5) or with XAV939 treatment (CL5+XAV) on differentiation day 30. (A) Confocal microscopy images of TUBB3 and PAX6. (B) Distribution of cells positive with CTNNB1 in the tubule-like structures. Arrowhead: CTNNB1+ area. (C – E) expression of SOX2 with deep cortical markers BCL11B/CTIP2 (C) and TBR1 (D). (E) Graphs showing the number of cells positive with BCL11B/CTIP2 (C) and TBR1 (D) within specific width of DAPI+ areas in the tubule-like structures inside organoids. (F, G) cleaved-CASP3 expression on day 30 cerebral organoids. Tubular and non-tubular areas were identified using TUBB3 (F). Percentage of cleaved-CASP3 expressing, non-tubular area inside the organoids (upper). The number of cells positive for cleaved-CASP3 within a specific width of DAPI+ non-tubular area (lower; G). Significant difference from control values at *p < 0.05 and **p < 0.0001; ns, not significant; n = 14 (E) and 10 (G) organoids, three independent experiments. Scale bar: 200 μm. Cell line: H9 or subclone of H9 (CL5; A-G).

References

    1. Riessland M, Kolisnyk B, Kim TW, et al. Loss of SATB1 induces p21-dependent cellular senescence in post-mitotic dopaminergic neurons. Cell Stem Cell. 2019;25(4):514–530.e8. DOI: 10.1016/j.stem.2019.08.013 - DOI - PMC - PubMed
    1. Schweitzer JS, Song B, Herrington TM, et al. Personalized iPSC-derived dopamine progenitor cells for Parkinson’s disease. N Engl J Med. 2020;382(20):1926–1932. DOI: 10.1056/NEJMoa1915872 - DOI - PMC - PubMed
    1. Kriks S, Shim JW, Piao J, et al. Dopamine neurons derived from human ES cells efficiently engraft in animal models of Parkinson’s disease. Nature. 2011;480(7378):547–551. DOI: 10.1038/nature10648 - DOI - PMC - PubMed
    1. Valiulahi P, Vidyawan V, Puspita L, et al. Generation of caudal-type serotonin neurons and hindbrain-fate organoids from hPSCs. Stem Cell Reports. 2021;16(8):1938–1952. DOI: 10.1016/j.stemcr.2021.06.006 - DOI - PMC - PubMed
    1. Amoroso MW, Croft GF, Williams DJ, et al. Accelerated high-yield generation of limb-innervating motor neurons from human stem cells. J Neurosci. 2013;33(2):574–586. DOI: 10.1523/JNEUROSCI.0906-12.2013 - DOI - PMC - PubMed

Publication types

Supplementary concepts

LinkOut - more resources