

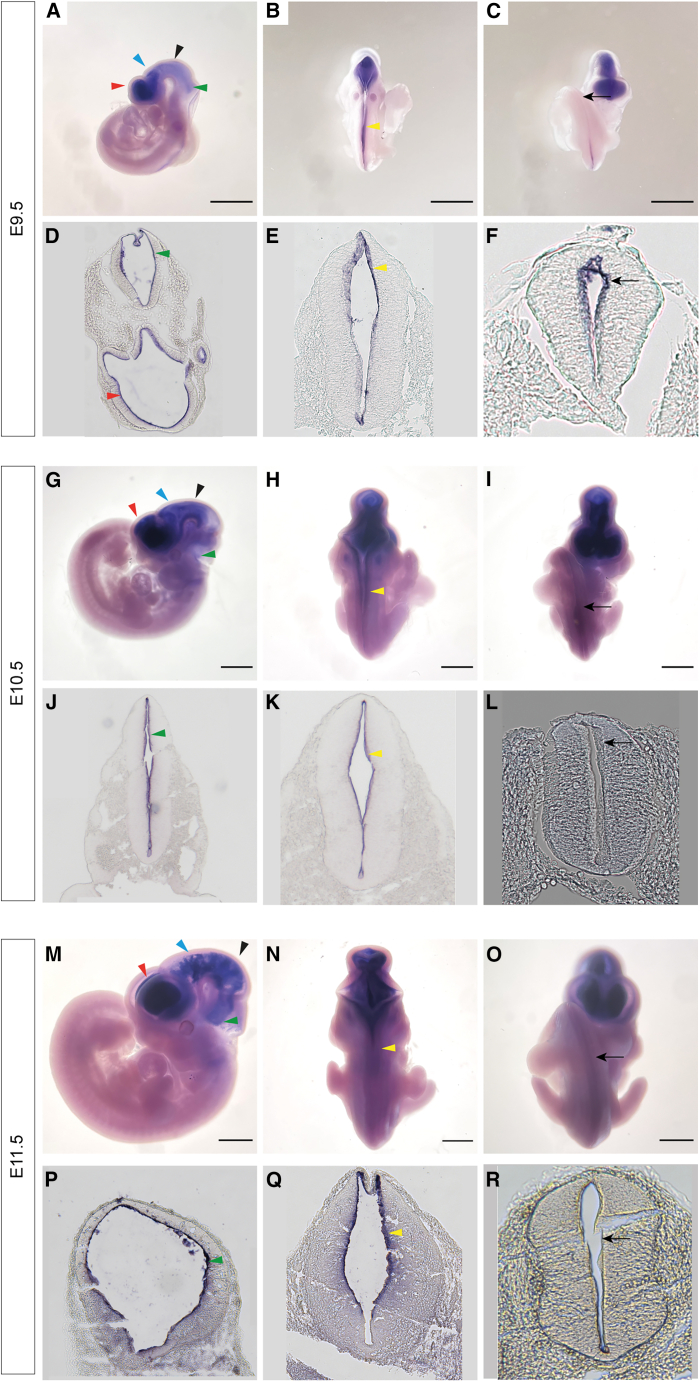
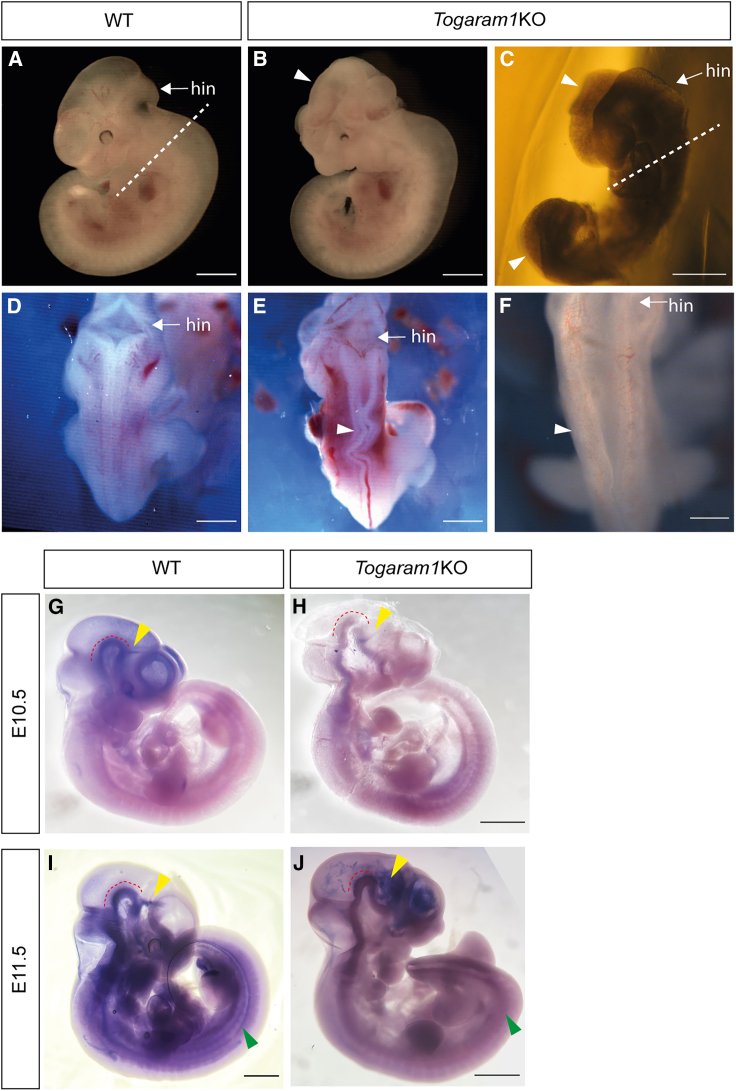
Togaram1 is expressed in the neural tube and its absence causes neural tube closure defects
- PMID: 39385469
- PMCID: PMC11541697
- DOI: 10.1016/j.xhgg.2024.100363
Togaram1 is expressed in the neural tube and its absence causes neural tube closure defects
Abstract
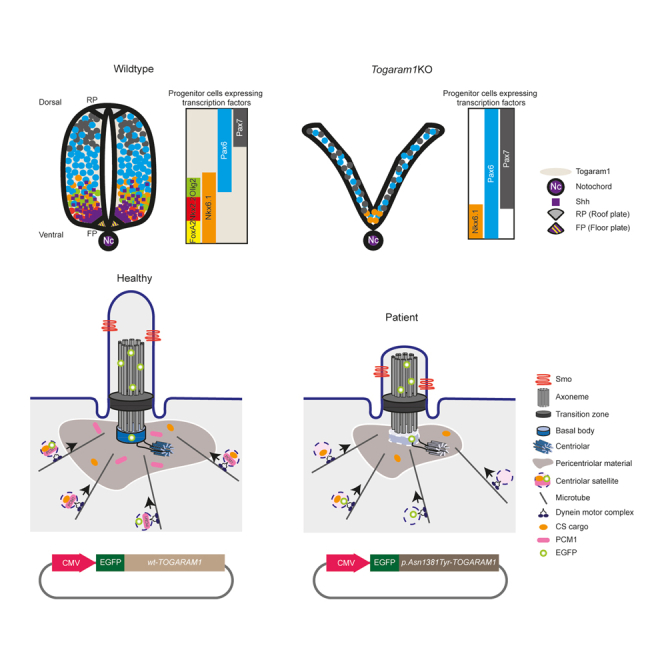
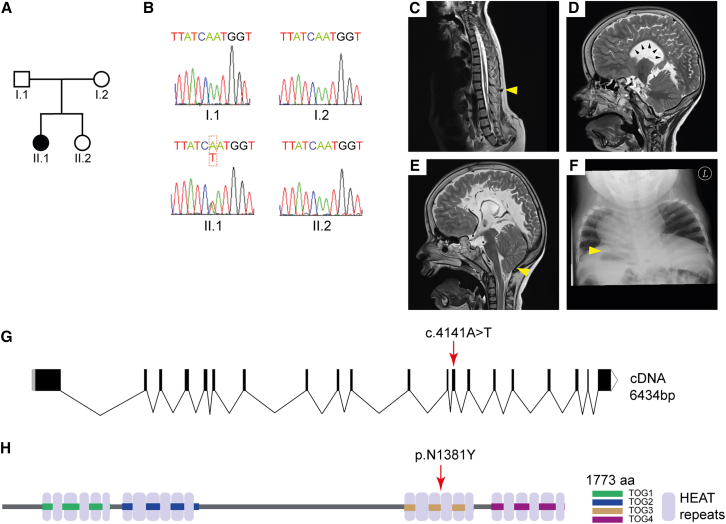
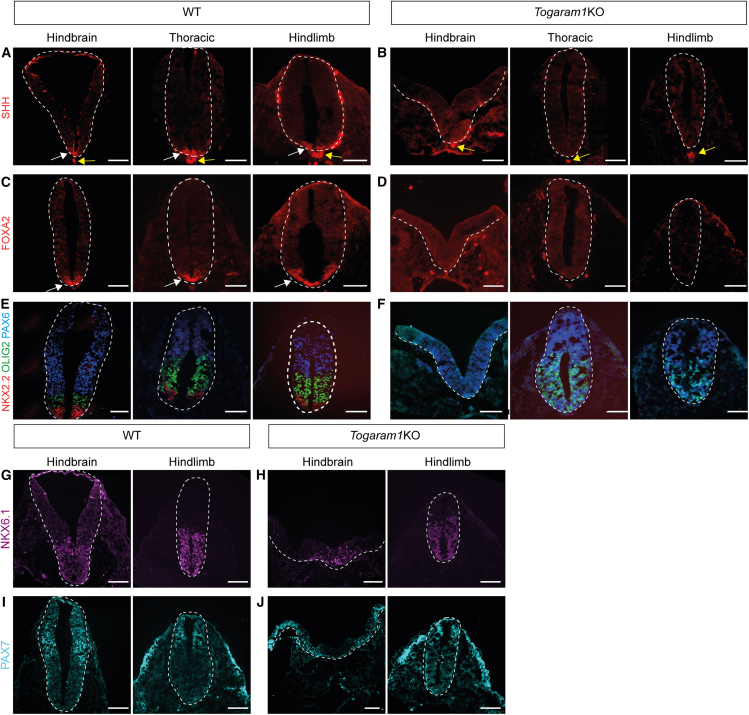
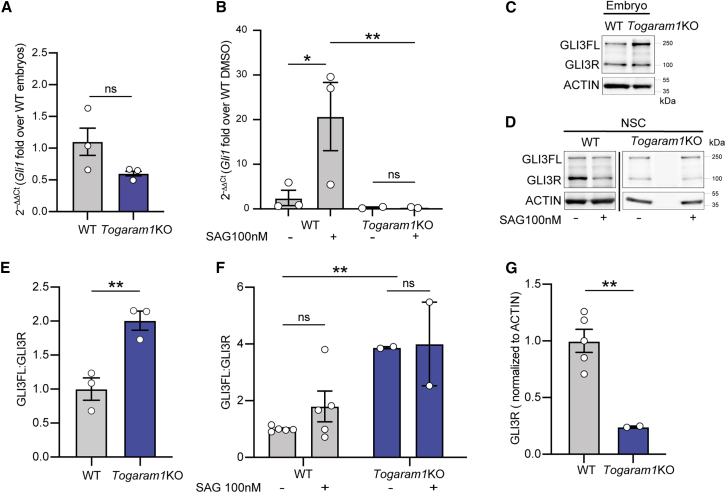
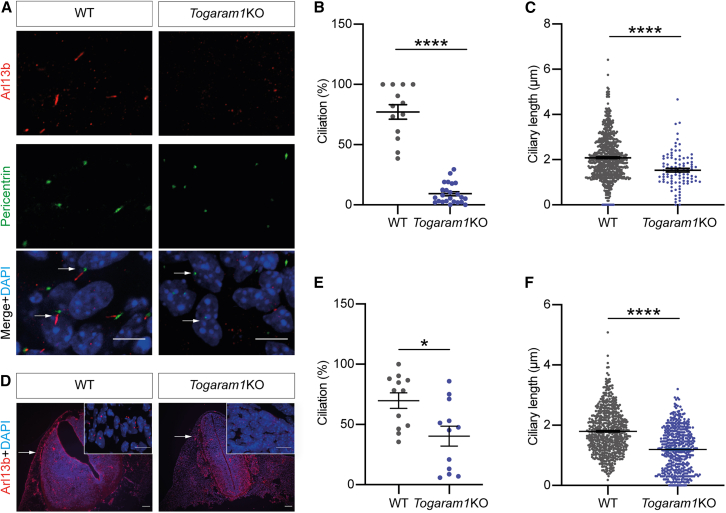
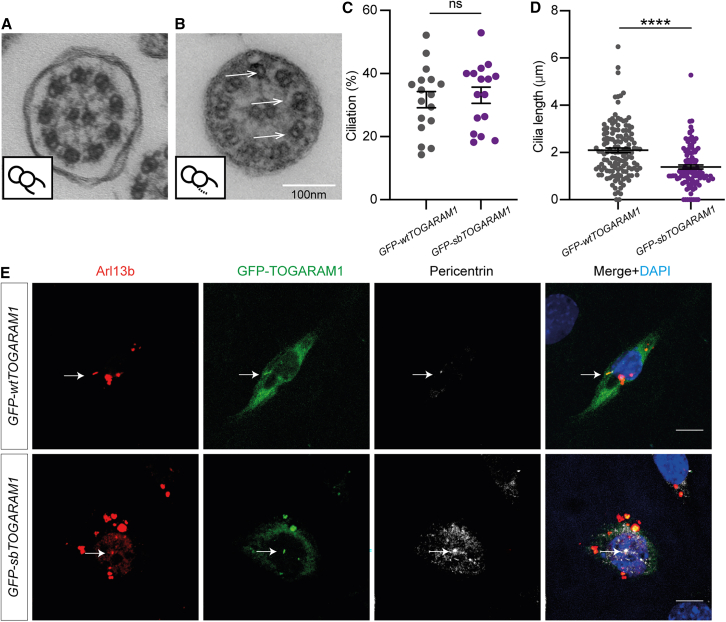
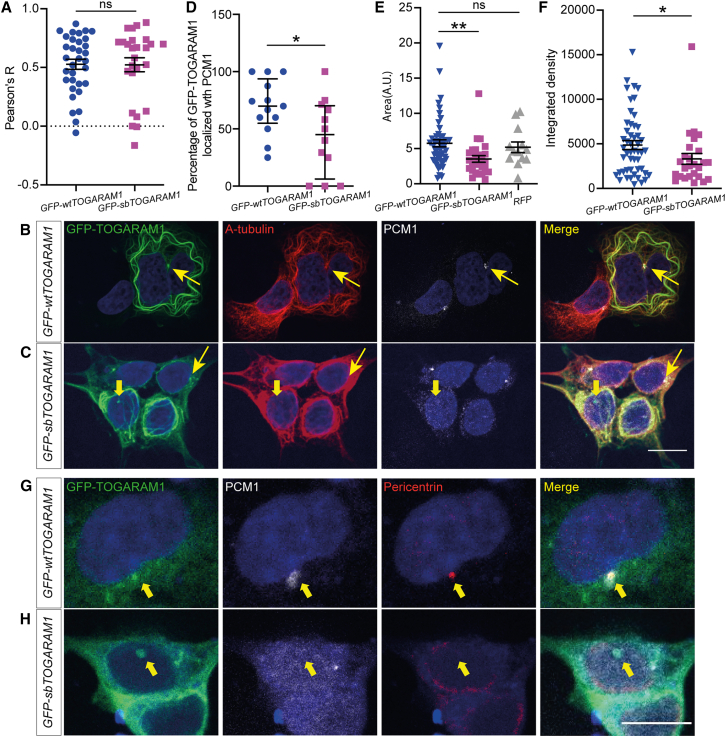
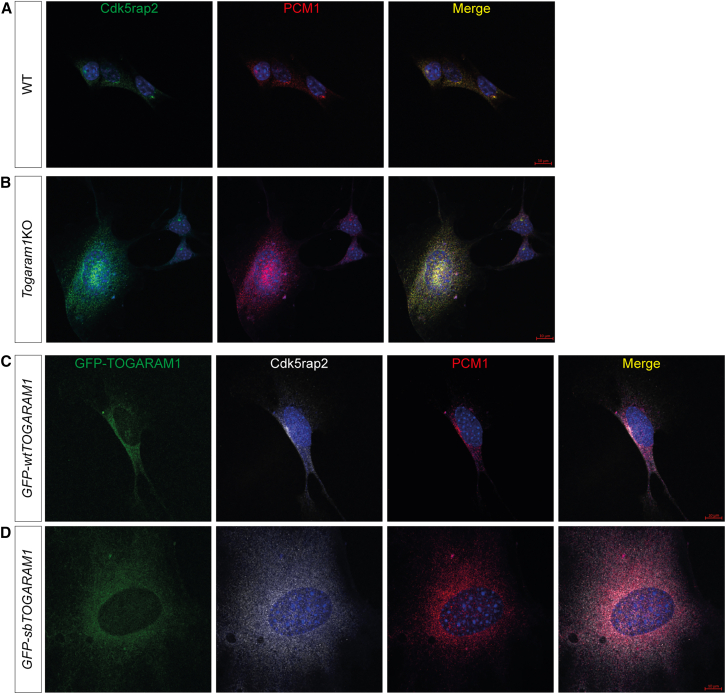
Neural tube closure defect pathomechanisms in human embryonic development are poorly understood. Here we identified spina bifida patients expressing novel variants of the TOGARAM gene family. TOGARAM1 has been associated with the ciliopathy Joubert syndrome, but its connection to spina bifida and role in neural development is unknown. We show that Togaram1 is expressed in the neural tube and Togaram1 knockout mice have abnormal cilia, reduced sonic hedgehog (Shh) signaling, abnormal neural tube patterning, and display neural tube closure defects. Neural stem cells from Togaram1 knockout embryos showed reduced cilia and defects in Shh signaling. Overexpression in IMCD3 and HEK293 cells of TOGARAM1 carrying the variant found in the spina bifida patient resulted in cilia defect along with reduced pericentriolar material one (PCM1), a critical constituent of centriolar satellites involved in transporting proteins toward the centrosome and primary cilia. Our results demonstrate the role of TOGARAM1 in regulating Shh signaling during early neural development that is critical for neural tube closure and elucidates potential mechanisms whereby the ciliopathy-associated gene TOGARAM1 gives rise to spina bifida aperta in humans.
Keywords: PCM1; TOGARAM1; cilia; sonic hedgehog signaling; spina bifida.
Copyright © 2024 The Author(s). Published by Elsevier Inc. All rights reserved.
Conflict of interest statement
Declaration of interests The authors declare no competing interests.
Figures
Similar articles
-
The relationship between sonic Hedgehog signaling, cilia, and neural tube defects.Birth Defects Res A Clin Mol Teratol. 2010 Aug;88(8):633-52. doi: 10.1002/bdra.20686. Birth Defects Res A Clin Mol Teratol. 2010. PMID: 20544799 Free PMC article. Review.
-
Variable expressivity of ciliopathy neurological phenotypes that encompass Meckel-Gruber syndrome and Joubert syndrome is caused by complex de-regulated ciliogenesis, Shh and Wnt signalling defects.Hum Mol Genet. 2013 Apr 1;22(7):1358-72. doi: 10.1093/hmg/dds546. Epub 2013 Jan 2. Hum Mol Genet. 2013. PMID: 23283079 Free PMC article.
-
Mouse hitchhiker mutants have spina bifida, dorso-ventral patterning defects and polydactyly: identification of Tulp3 as a novel negative regulator of the Sonic hedgehog pathway.Hum Mol Genet. 2009 May 15;18(10):1719-39. doi: 10.1093/hmg/ddp075. Epub 2009 Feb 17. Hum Mol Genet. 2009. PMID: 19223390 Free PMC article.
-
β-catenin regulates Pax3 and Cdx2 for caudal neural tube closure and elongation.Development. 2014 Jan;141(1):148-57. doi: 10.1242/dev.101550. Epub 2013 Nov 27. Development. 2014. PMID: 24284205 Free PMC article.
-
G-protein-coupled receptor signaling and neural tube closure defects.Birth Defects Res. 2017 Jan 30;109(2):129-139. doi: 10.1002/bdra.23567. Birth Defects Res. 2017. PMID: 27731925 Free PMC article. Review.
Cited by
-
Proximity based proteomics reveals Git1 as a regulator of Smoothened signaling.bioRxiv [Preprint]. 2025 Jan 7:2025.01.06.631593. doi: 10.1101/2025.01.06.631593. bioRxiv. 2025. PMID: 39829937 Free PMC article. Preprint.
References
-
- Aguiar-Pulido V., Wolujewicz P., Martinez-Fundichely A., Elhaik E., Thareja G., Abdel Aleem A., Chalhoub N., Cuykendall T., Al-Zamer J., Lei Y., et al. Systems biology analysis of human genomes points to key pathways conferring spina bifida risk. Proc. Natl. Acad. Sci. USA. 2021;118 doi: 10.1073/pnas.2106844118. - DOI - PMC - PubMed
MeSH terms
Substances
Supplementary concepts
LinkOut - more resources
Full Text Sources
Medical
Research Materials
