. 2024 Nov 11;52(20):12565-12581.
doi: 10.1093/nar/gkae866.

Chromosomal integrons are genetically and functionally isolated units of genomes

Affiliations

Chromosomal integrons are genetically and functionally isolated units of genomes

Paula Blanco et al. Nucleic Acids Res. .

Erratum in

Abstract

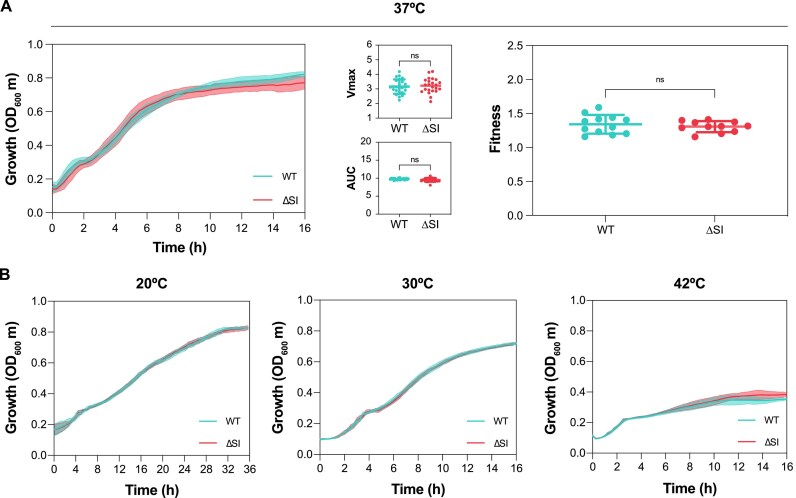
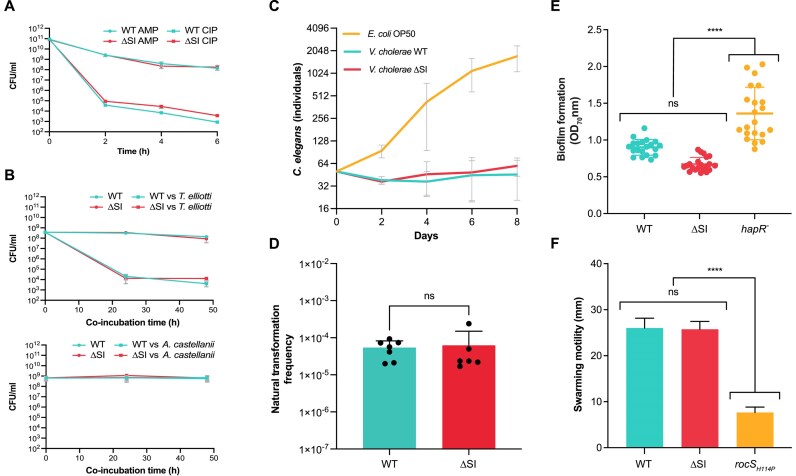
Integrons are genetic elements that increase the evolvability of bacteria by capturing new genes and stockpiling them in arrays. Sedentary chromosomal integrons (SCIs) can be massive and highly stabilized structures encoding hundreds of genes, whose function remains generally unknown. SCIs have co-evolved with the host for aeons and are highly intertwined with their physiology from a mechanistic point of view. But, paradoxically, other aspects, like their variable content and location within the genome, suggest a high genetic and functional independence. In this work, we have explored the connection of SCIs to their host genome using as a model the Superintegron (SI), a 179-cassette long SCI in the genome of Vibrio cholerae N16961. We have relocated and deleted the SI using SeqDelTA, a novel method that allows to counteract the strong stabilization conferred by toxin-antitoxin systems within the array. We have characterized in depth the impact in V. cholerae's physiology, measuring fitness, chromosome replication dynamics, persistence, transcriptomics, phenomics, natural competence, virulence and resistance against protist grazing. The deletion of the SI did not produce detectable effects in any condition, proving that-despite millions of years of co-evolution-SCIs are genetically and functionally isolated units of genomes.


Figures

Graphical Abstract
Graphical Abstract
Figure 1.
Figure 1.
(A) Schematic representation of an integron. On the left side, the functional platform includes the integrase gene (intI1), the cassette promoter (PC), the integrase promoters (Pint) and the integron insertion site (attI). On the right side, the variable array of ICs is shown. Hybrid attI and attC sites are marked with corresponding colors. The arrows within the cassettes indicate the orientation of the open reading frame, with the color intensity of each arrow representing the expression level. The diagram also illustrates the primary reactions mediated by the IntI recombinase: cassette insertion (attI × attC), excision (attC × attC) and reshuffling. (B) Diagram showing the organization and relative position of the relevant genes within the SI cassette array. Arrows represent individual genes contained within cassettes, while gray triangles denote the attC sites. TA systems are illustrated with colored arrows: darker arrows indicate toxins and lighter arrows indicate antitoxins. The orientation and position of each arrow reflect the transcriptional direction of the genes. Additionally, smaller arrows mark regions corresponding to non-coding RNAs.
Figure 2.
Figure 2.
(A) Scheme of the relocation of the SI from Chr2 to Chr1, where it is inserted in both orientations (modified from (76)). (B) Growth curves of WT and relocated-SI strains (Chr1lag and Chr1lead). No significant growth differences are observed.
Figure 3.
Figure 3.
Schematic representation of two successive allelic replacements using SeqDelTA. The LHR is conserved during the deletion process, allowing the recycling of the resistance markers at each step. The RHR is redesigned at each step to inactivate the following TA module and delete the cassette cargo in between. The inactivation of the TA system is performed by knocking the toxin but leaving the antitoxin intact. A total of 18 sequential replacements were performed. The last deletion step was carried out using a suicide plasmid.
Figure 4.
Figure 4.
Marker frequency analysis of the two chromosomes of V. cholerae ΔSI mapped against V. cholerae WT genome (A) and against V. cholerae ΔSI genome (B). The gap on chromosome 2 in panel (A) reflects the SIs deletion. The genome position is represented relative to the oriC (set to 0). Blue and green rhombus represent the average of 1 kbp windows, and red and garnet squares the average of 10 kbp windows in Chr1 and Chr 2, respectively.
Figure 5.
Figure 5.
(A) Volcano plots showing gene expression measured by RNA-seq in V. cholerae ΔSI in comparison to the WT strain in exponential and (B) stationary growth phase. Green dots represent chromosome 1 genes; yellow triangles represent chromosome 2 genes, while blue triangles represent those genes from the SI; red dots or triangles represent downregulated or upregulated genes from chromosome 1 or 2, respectively. The vertical dashed lines indicate the log2 fold change (FC) cutoffs, and the horizontal dashed line indicates the threshold of the Padj value (<0.05). (C) Validation of the DEGs by RT-qPCR during exponential and (D) stationary growth phase. Differential expression values represent the fold change in gene expression compared to the WT strain. Error bars indicate standard deviation of two biological replicates with three technical replicates each.
Figure 6.
Figure 6.
(A) Growth curves of V. cholerae WT (blue) and ΔSI (red) strains in LB at 37°C. Growth parameters including Vmax and the AUC were extracted from growth curves in LB by measuring the optical density at 600 nm (OD600). Values correspond to the measurement of 24 independent colonies. Relative fitness of V. cholerae WT and ΔSI strains compared with E. coli DH5α PcS::gfp was performed in LB by inoculating cells at a ratio of 1:1. Fitness values were determined from 12 independent experiments by flow cytometry. The P-values were calculated by comparing each measure with that of the WT strain using an unpaired t-test. Ns: not significant. (B) Growth curves of V. cholerae WT (blue) and ΔSI (red) strains in LB at 20, 30 and 42°C, respectively. Values correspond to the measurement of 10 independent colonies.
Figure 7.
Figure 7.
Comparison of AUC values of V. cholerae WT and ΔSI in different substrates given by Biolog Phenotype Microarrays (PM1–PM20). The AUC values are the mean of two biological replicates for each strain. Error bars indicate the standard error. The points that are above the bisector indicate those conditions where the absence of the SI is beneficial for the bacteria, while those points that lay under the bisector indicate the conditions where the presence of the SI is beneficial for the bacteria.
Figure 8.
Figure 8.
(A) Antibiotic persistence assay of V. cholerae WT and ΔSI mutant challenged with 10-fold the MIC of ampicillin (AMP) and ciprofloxacin (CIP), individually. CFUs/ml are plotted against time. Error bars indicate standard deviations from three independent biological replicates. (B) V. cholerae WT and ΔSI survival under predation by T. elliotti (MOI 1:10000) or A. castellanii (MOI 1:500). The number of surviving bacteria, incubated either in the absence (circles) or presence (squares) of ciliates/amoeba, was quantified by CFU counting after 0–48 h of co-incubation. Error bars indicate standard deviations from at least three independent biological replicates. (C) Virulence assay of V. cholerae WT and ΔSI mutant in a C. elegans model. E. coli OP50 was used as a negative control. Error bars indicate standard deviations from three independent biological replicates. (D) Natural competence assay of V. cholerae WT and ΔSI mutant. Transformation frequencies are given on the Y-axis and were calculated as the number of CFUs growing in kanamycin over the total CFUs. Bar charts show the mean ± s.d. from biological replicates (individual dots) from at least three independent experiments. (E) Biofilm formation of V. cholerae WT and ΔSI mutant. A V. cholerae hapR (frameshift) mutant was included as a positive control of biofilm formation. Data from at least 20 independent colonies is represented. (F) Swarming motility assay of V. cholerae WT and ΔSI mutant. A V. cholerae rocS (H114P) mutant was included as a non-motile control strain. Error bars indicate standard deviation of at least three biological replicates. P-values (****) were calculated by pairwise comparison using the one-way ANOVA test (P<0.0001). Ns: not significant.

References

    1. Mazel D. Integrons: agents of bacterial evolution. Nat. Rev. Microbiol. 2006; 4:608–620. - PubMed
    1. Escudero J., Loot C., Nivina A., Mazel D. The Integron: adaptation on demand. Microbiol. Spectr. 2015; 13:MDNA3–A0019–2014. - PubMed
    1. Stokes H.W., Hall R.M. A novel family of potentially mobile DNA elements encoding site-specific gene-integration functions: integrons. Mol. Microbiol. 1989; 3:1669–1683. - PubMed
    1. Souque C., Escudero J.A., Maclean R.C. Integron activity accelerates the evolution of antibiotic resistance. eLife. 2021; 10:e62474. - PMC - PubMed
    1. Barraud O., Ploy M.C. Diversity of class 1 integron gene cassette rearrangements selected under antibiotic pressure. J. Bacteriol. 2015; 197:2171–2178. - PMC - PubMed

LinkOut - more resources