. 2024 Dec;15(6):2544-2558.
doi: 10.1002/jcsm.13597. Epub 2024 Oct 10.

Inhibition of CILP2 Improves Glucose Metabolism and Mitochondrial Dysfunction in Sarcopenia via the Wnt Signalling Pathway

Affiliations

Inhibition of CILP2 Improves Glucose Metabolism and Mitochondrial Dysfunction in Sarcopenia via the Wnt Signalling Pathway

Zhibo Deng et al. J Cachexia Sarcopenia Muscle. 2024 Dec.

Abstract

Background: Skeletal muscle is the primary organ involved in insulin-mediated glucose metabolism. Elevated levels of CILP2 are a significant indicator of impaired glucose tolerance and are predominantly expressed in skeletal muscle. It remains unclear whether CILP2 contributes to age-related muscle atrophy through regulating the glucose homeostasis and insulin sensitivity.

Methods: Initially, the expression levels of CILP2 were assessed in elderly mice and patients with sarcopenia. Lentiviral vectors were used to induce either silencing or overexpression of CILP2 in C2C12 myoblast cells. The effects of CILP2 on proliferation, myogenic differentiation, insulin sensitivity and glucose uptake were evaluated using immunofluorescence, western blotting, real-time quantitative polymerase chain reaction, RNA sequencing, glucose uptake experiments, dual-luciferase reporter assays and co-immunoprecipitation (CO-IP). An adeno-associated virus-9 containing a muscle-specific promoter was injected into SAMP8 senile mice to observe the efficacy of CILP2 knockout.

Results: We found that there was more CLIP2 expressed in the skeletal muscle of ageing mice (+1.1-fold, p < 0.01) and in patients with sarcopenia (+2.5-fold, p < 0.01) compared to the control group. Following the overexpression of CILP2, Ki67 (-65%, p < 0.01), PCNA (-32%, p < 0.05), MyoD1 (-89%, p < 0.001), MyoG (-31%, p < 0.05) and MyHC (-85%, p < 0.001), which indicate proliferation and differentiation potential, were significantly reduced. In contrast, MuRF-1 (+59%, p < 0.05), atrogin-1 (+43%, p < 0.05) and myostatin (+31%, p < 0.05), the markers of muscular atrophy, were significantly increased. Overexpression of CILP2 decreased insulin sensitivity, glucose uptake (-18%, p < 0.001), GLUT4 translocation to the membrane and the maximum respiratory capacity of mitochondria. Canonical Wnt signalling was identified through RNA sequencing as a potential pathway for CILP2 regulation in C2C12, and Wnt3a was confirmed as an interacting protein of CILP2 in the CO-IP assay. The addition of recombinant Wnt3a protein reversed the inhibitory effects on myogenesis and glucose metabolism caused by CILP2 overexpression. Conversely, CILP2 knockdown promoted myogenesis and glucose metabolism. CILP2 knockdown improved muscle atrophy in mice, characterized by significant increases in time to exhaustion (+42%, p < 0.001), grip strength (+19%, p < 0.01), muscle mass (+15%, p < 0.001) and mean muscle cross-sectional area (+37%, p < 0.01). CILP2 knockdown enhanced glycogen synthesis (+83%, p < 0.001) and the regeneration of oxidative and glycolytic muscle fibres in SAMP8 ageing mice via the Wnt/β-catenin signalling pathway.

Conclusions: Our results indicate that CILP2 interacts with Wnt3a to suppress the Wnt/β-catenin signalling pathway and its downstream cascade, leading to impaired insulin sensitivity and glucose metabolism in skeletal muscle. Targeting CILP2 inhibition could offer potential therapeutic benefits for sarcopenia.

Keywords: CILP2; Wnt/β‐catenin pathway; glucose metabolism; insulin resistance; sarcopenia.


Conflict of interest statement

The authors declare no conflicts of interest.

Figures
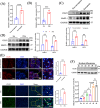
FIGURE 1
FIGURE 1
CILP2 is upregulated in skeletal muscle of patients with sarcopenia and elderly mice. (A) The mRNA levels of CILP2 in quadriceps muscle of non‐sarcopenia and sarcopenia, n = 4. (B) The mRNA levels of CILP2 in GAs muscle of 3‐ and 24‐month‐old mice, n = 4. (C) Western blotting and quantitative analysis of the levels of CILP2 and MuRF‐1 in non‐sarcopenia and sarcopenia, n = 3. (D) Western blotting and quantitative analysis of the levels of CILP2 and MuRF‐1 in 3‐ and 24‐month‐old mice, n = 3. (E) Representative IF staining and the fluorescence density of CILP2 in non‐sarcopenia and sarcopenia and in 3‐ and 24‐month‐old mice, scale bars = 100 and 200 μm. (F) Western blotting and quantitative analysis of the levels of CILP2 during myoblast differentiation, n = 3. (E) The positive areas are indicated by white arrows. (E) n = 3, one fields per sample were selected. For all statistical plots, values are shown as mean ± SD. Ns, no significance, **p < 0.01, ***p < 0.001, ****p < 0.0001. Statistical significance was determined by Student's t test (for A, B, D and E) or one‐way ANOVA (for F). GA, gastrocnemius.
FIGURE 2
FIGURE 2
Overexpression of CILP2 inhibits proliferation and differentiation potential of C2C12 myoblasts. (A) At 48 h post‐transfection, the mRNA and protein levels of CILP2 in OE‐GFP and OE‐CILP2, n = 3. (B) CCK8 assay for cell proliferation of the OE‐GFP and OE‐CILP2, n = 3. (C) Representative EdU staining of the OE‐GFP and OE‐CILP2 and positive cells counting, scale bars = 200 μm. (D) Western blotting and quantitative analysis of the levels of PCNA and Ki67 in OE‐GEP and OE‐CILP2, n = 3. (E) Western blotting and quantitative analysis of the levels of MyoD1, MyoG, MyHC, Atrogin‐1, MuRF‐1 and Myostatin in OE‐GEP and OE‐CILP2, n = 3. (F) Representative IF staining of MyoG and MyHC in OE‐GFP and OE‐CILP2, scale bars = 100 and 200 μm. (C) n = 5, one fields per sample were selected. (F) n = 4, two fields per sample were selected. For all statistical plots, values are shown as mean ± SD. *p < 0.05, **p < 0.01, ***p < 0.001, ****p < 0.0001. Statistical significance was determined by Student's t test (for A, B, C, D, E and F).
FIGURE 3
FIGURE 3
CILP2 knockout promotes proliferation and differentiation potential of C2C12 myoblasts. (A) At 48 h post‐transfection, the mRNA and protein levels of CILP2 in sh‐GFP and sh‐CILP2, n = 3. (B) CCK8 assay for cell proliferation of the sh‐GFP and sh‐CILP2, n = 3. (C) Representative EdU staining of the sh‐GFP and sh‐CILP2 and positive cells counting, scale bars = 200 μm. (D) Western blotting and quantitative analysis of the levels of PCNA and Ki67 in sh‐GFP and sh‐CILP2, n = 3. (E) Western blotting and quantitative analysis of the levels of MyoD1, MyoG, MyHC, Atrogin‐1, MuRF‐1 and Myostatin in sh‐GFP and sh‐CILP2, n = 3. (F) Representative IF staining of MyoG and MyHC in sh‐GFP and sh‐CILP2, scale bars = 100 and 200 μm. (C) n = 5, one fields per sample were selected. (F) n = 4, two fields per sample were selected. For all statistical plots, values are shown as mean ± SD. *p < 0.05, **p < 0.01, ***p < 0.001, ****p < 0.0001. Statistical significance was determined by Student's t test (for A, B, C, D, E and F).
FIGURE 4
FIGURE 4
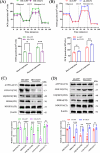
Upregulation of CILP2 inhibits mitochondrial biogenesis in myotube. (A) The graphs of mitochondrial respiration by OCR quantification presented basal respiration, and maximal respiration in OE‐GFP and OE‐CILP2 myotube, n = 3. (B) The graphs of mitochondrial respiration by OCR quantification presented basal respiration and maximal respiration in sh‐GFP and sh‐CILP2 myotube, n = 3. (C) Western blotting and quantitative analysis of OXPHOS complexes (NDUFS1, SDHA, UQCRC2, COX IV and ATP5A1) in OE‐GFP and OE‐CILP2 myotube, n = 3. (D) Western blotting and quantitative analysis of OXPHOS complexes (NDUFS1, SDHA, UQCRC2, COX IV and ATP5A1) in sh‐GFP and sh‐CILP2 myotube, n = 3. For all statistical plots, values are shown as mean ± SD. Ns, no significance, **p < 0.01, ***p < 0.001, ****p < 0.0001. Statistical significance was determined by Student's t test (for A, B, C, D and E).
FIGURE 5
FIGURE 5
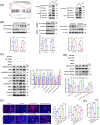
CILP2 is associated with glucose metabolism and insulin sensitivity in myotube. (A) Representative IF staining of glucose uptake and quantification of glucose uptake, glucose consumption and glycogen content in C2C12 of OE‐GFP and OE‐CILP2 without or with insulin, scale bars = 100 μm. (B) Western blotting and quantitative analysis of the levels of p‐GSK3β(Ser9), p‐AKT (Ser473), p‐InsR (Tyr1150) and p‐IRS1(Ser473) in C2C12 of OE‐GFP and OE‐CILP2 without or with insulin, n = 3. (C) Western blotting and quantitative analysis and representative IF staining of GLUT4 of the levels of total GLUT4, surface GLUT4 and surface GLUT4/total GLUT4 in C2C12 of OE‐GFP and OE‐CILP2 without or with insulin, n = 3. (D) Quantification of glucose uptake, glucose consumption and glycogen content in C2C12 of sh‐GFP and sh‐CILP2 without or with insulin, n = 3. (E) Western blotting and quantitative analysis of the levels of p‐GSK3β(Ser9), p‐AKT (Ser473), p‐InsR (Tyr1150) and p‐IRS1(Ser473) in C2C12 of sh‐GFP and sh‐CILP2 without or with insulin, n = 3. (F) Western blotting and quantitative analysis of the levels of total GLUT4, surface GLUT4 and surface GLUT4/total GLUT4 in C2C12 of sh‐GFP and sh‐CILP2 without or with insulin, n = 3. For all statistical plots, Values are shown as mean ± SD. Ns, no significance, *p < 0.05, **p < 0.01, ***p < 0.001, ****p < 0.0001. Statistical significance was determined by Student's t test (for A and D) or two‐way ANOVA (for B, C, E and F).
FIGURE 6
FIGURE 6
CILP2 promotes the progression of sarcopenia via the Wnt/beta‐catenin signalling pathway. (A) GSEA enrichment plot of DEGs related to canonical Wnt signalling pathway and the co‐immunoprecipitation experiments tested the interaction between CILP2 and Wnt3a in C2C12 myotubes. (B) Western blotting analysis revealed expression of p‐β‐catenin and β‐catenin and the levels of β‐catenin in cytoplasm and nuclear in OE‐GFP and OE‐CILP2 groups, n = 3. (C) Western blotting and quantitative analysis of the levels of β‐catenin, MyoD, MyHC, p‐GSK3β(Ser9), p‐AKT (Ser473), p‐InsR (Tyr1150) and p‐IRS1(Ser307) in C2C12 with OE‐CILP2, Wnt3a or IWP‐2 manipulation, n = 3. (D) Western blotting and quantitative analysis of the levels of total GLUT4, surface GLUT4 and surface GLUT4/total GLUT4 in C2C12 with OE‐CILP2, Wnt3a or IWP‐2 manipulation, n = 3. (E) Representative immunofluorescence staining of MyHC, scale bars = 200 μm. (F) TEF/LEF‐luciferase reporter activity of C2C12 in OE‐GFP, OE‐CILP2 and OE‐CILP2 with Wnt3a, n = 5. (E) n = 4, two fields per sample were selected. For all statistical plots, values are shown as mean ± SD. Ns, no significance, **p < 0.01, ***p < 0.001, ****p < 0.0001. Statistical significance was determined by Student's t test (for B) or one‐way ANOVA (for E and F) or two‐way ANOVA (for C and D).
FIGURE 7
FIGURE 7
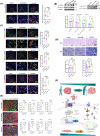
CILP2 knockout enhanced endurance exercise capacity and muscle mass in senescent SAMP8 mice. (A) Schematic diagram of animal experiments and physical performance assessment on a treadmill. After 2 months of treatment, measurements of maximal running speed, distance, running time to exhaustion, grip strength and body weight, n = 5. (B) Representative macro photographs of GAs of each group and quantitative analysis of GAs weight normalized to body weight, n = 5. (C) eGFP expression was visualized by fluorescence microscopy in frozen sections of the GA muscles of each group, scale bars = 100 μm. (D) Representative IF staining and the fluorescence density of CILP2 of each group, scale bars = 100 μm. (E) Western blotting and quantitative analysis detected the expression of CILP2, Myostatin, MuRF‐1 and Atrogin‐1 in GA muscle; GAPDH was used as a loading control, n = 3. (F) Representative HE staining (top) and Masson staining (bottom) for the GAs muscle of each group, and quantification, scale bars = 100 μm. (D) n = 5, three fields per sample were selected. (F) n = 5, 50 fibres per sample were selected. For all statistical plots, values are shown as mean ± SD. Ns, no significance, **p < 0.01, ***p < 0.001, ****p < 0.0001. Statistical significance was determined by one‐way ANOVA (for A, B, D and F) or two‐way ANOVA (for E). GA, gastrocnemius; HE, haematoxylin and eosin; CSA, cross‐sectional area. Control, mice injected with the same volume of PBS; AAV9‐sh‐Scramble, mice injected with scramble shRNA vector control; AAV9‐sh‐CILP2, mice injected with AAV9 vectors encoding sh‐CILP2.
FIGURE 8
FIGURE 8
CILP2 knockout improves skeletal muscle regeneration and glucose metabolism potential in aging SAMP8 mice via the Wnt/β‐catenin pathway. (A) Representative IF staining and the fluorescence density of β‐catenin of GAs muscle in each group, scale bars = 200 μm. (B) Western blotting analysis revealed expression of β‐catenin, GLUT4 protein and surface GLUT4 and quantification, n = 3. (C) Representative IF staining for overlapping fluorescence of CCND1 or Ki67 and PAX7 and GLUT4 in GAs from each group, and quantification, scale bars = 200 μm. (D) Representative PAS staining (top) and SDH staining (bottom) in GAs muscle of each group, and quantification of glycogen content, scale bars = 100 μm. (E) Representative IF staining of slow MyHC (top) or fast MyHC (bottom) and Laminin and quantitative analysis of the percentage of slow MyHC or fast MyHC of GAs muscle of each group, scale bars = 200 μm. (F) Schematic summary of the regulatory role of CILP2 in myogenic differentiation. (A and C) n = 5, three fields per sample were selected. (D) n = 5, two fields per sample were selected. (E) n = 3, mean value of 10 fibres per sample were selected in CSA, and two fields per sample were selected in percentage. For all statistical plots, values are shown as mean ± SD. Ns, no significance, *p < 0.05, **p < 0.01, ****p < 0.0001. Statistical significance was determined by one‐way ANOVA (for A, C, D and E) or two‐way ANOVA (for B). GA, gastrocnemius; PAS, Periodic Acid‐Schiff. Control, mice injected with the same volume of PBS; AAV9‐sh‐Scramble, mice injected with scramble shRNA vector control; AAV9‐sh‐CILP2, mice injected with AAV9 vectors encoding sh‐CILP2.

References

    1. Besora‐Moreno M., Llauradó E., Jiménez‐Ten Hoevel C., et al., “New Perspectives for Low Muscle Mass Quantity/Quality Assessment in Probable Sarcopenic Older Adults: An Exploratory Analysis Study,” Nutrients 16 (2024): 1496. - PMC - PubMed
    1. Zhang Y., Guo J. Y., Wang F., Li C. W., and Yu K., “Start With Muscle Mass or Muscle Strength in Diagnosis and Management of Sarcopenia? A Systematic Review of Guidance Documents,” Asia Pacific Journal of Clinical Nutrition 33 (2024): 247–271. - PMC - PubMed
    1. Cruz‐Jentoft A. J. and Sayer A. A., “Sarcopenia,” Lancet 393 (2019): 2636–2646. - PubMed
    1. Olmos Martínez J. M., Hernández Martínez P., and González M. J., “Frailty, Sarcopenia and Osteoporosis,” Medicina Clínica (Barc) 163 (2024): e17–e23. - PubMed
    1. Serova M., Didry‐Barca B., Deloux R., et al., “BIO101 Stimulates Myoblast Differentiation and Improves Muscle Function in Adult and Old Mice,” Journal of Cachexia, Sarcopenia and Muscle 15 (2024): 55–66. - PMC - PubMed