Review
. 2024 Oct 9;14(43):31921-31953.
doi: 10.1039/d4ra06070a. eCollection 2024 Oct 1.

A review of the electrochemical and galvanic corrosion behavior of important intermetallic compounds in the context of aluminum alloys

Affiliations
Review

A review of the electrochemical and galvanic corrosion behavior of important intermetallic compounds in the context of aluminum alloys

Alexander I Ikeuba et al. RSC Adv. .

Abstract

Aluminum alloys are widely sought for different applications due to their high strength-to-weight ratio. Most often this increased strength of the alloy is achieved by specific alloying elements and heat treatment processes which give rise to second phases intermetallic particles (IMPs) also known as intermetallic compounds (IMCs). These second phases play a dominant role in the corrosion susceptibility of aluminum alloys. This review provides a systematic survey of the electrochemical, and galvanic corrosion behavior of IMPs in the context of aluminum alloys. A discussion of the electrochemical/galvanic corrosion behavior of selected/important intermetallic compounds that are commonly found in aluminum alloys such as the Q-phase (Al4Cu2Mg7Si8), π-phase (Al8Mg3FeSi6), θ-phase (Al2Cu), S-phase (Al2CuMg), the β-phase (Mg2Si), β-phase (Al3Mg2), δ (Al3Li), η-phase (MgZn2), and β-phase (Al3Fe) is provided. In addition, the limitations in the electrochemical characterization of intermetallic compounds, the research gap, and prospects are also provided in addition to the phenomenon of galvanic polarity reversal and self-dissolution of IMPs.


Conflict of interest statement

There are conflicts of interest among the authors.

Figures
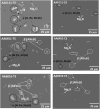
Fig. 1
Fig. 1. SEM images of the polished top surfaces and cross-sections of the AA6xxx. The Al-matrix is dark and dispersed with bright IMPs. EDS analysis of AA6xxx reveals Mg2Si and α IMPs in AA6111, while α, β and Mg2Si were identified in AA6451 and AA6016. The α IMPs are blocky, the Mg2Si particles are dark and β IMPs are two-dimensional plate/needle-like structures. This figure has been adapted/reproduced from (ref. 29) with permission from Sringer Nature, copyright 2024.
Fig. 2
Fig. 2. Schematic presentation of localized corrosion initiation induced by cathodic dispersoids and constituent phases. The envisaged reactions are shown, the initiation sites are the IMPs thereafter propagation, trenching and depth propagation sets in the vicinity of the matrix through galvanic interactions. The post corroded sample is indicated in the inset above the scheme revealing Cu released from a dealloyed Al2CuMg and redeposited on other IMPs and the surrounding alloy matrix. This figure has been adapted/reproduced from (ref. 31) with permission from Elsevier, copyright 2024.
Fig. 3
Fig. 3. The VPD of Al–Mn and α-Mg in AM50 (a) before corrosion, (b) after corrosion and (c) corresponding line-profile analysis of relative potential through the secondary phases. This figure has been adapted/reproduced from (ref. 32) with permission from Elsevier, copyright 2024.
Fig. 4
Fig. 4. Schematic of interface precipitation and corrosion mechanisms in Al–Zn–Mg–Cu aluminum alloy composite: (a–c) preferential segregation of precipitates at the α-Al/TiC interface; (d and e) difference in aging kinetics between alloy and composites; (f) initiation and propagation of IGC in composites (g–i) IGC susceptibility to TiC particles distribution configurations. This figure has been adapted/reproduced from (ref. 34) with permission from Elsevier, copyright 2024.
Fig. 5
Fig. 5. Volta potential maps (insets) and line profiles of (a, d) γ-Al7Cu4Ni, (b, e) δ-Al3NiCu, and (c, f) Q-Al5Cu2Mg8Si6 phases in T6-treated aluminum alloy. This figure has been adapted/reproduced from (ref. 36) with permission from Elsevier, copyright 2024.
Fig. 6
Fig. 6. (a) BSE images and (b) EDS elemental maps of Al single bond Si single bond Mg single bond Cu single bond Ni alloys after T6 treatment. High-magnification BSE images and corresponding EDS elemental maps of (c) γ-Al7Cu4Ni and (d) δ-Al3NiCu phases. This figure has been adapted/reproduced from (ref. 36) with permission from Elsevier, copyright 2024.
Fig. 7
Fig. 7. IMP size/area analysis in (a) Al single bond Si single bond Mg single bond Cu and (b). Al single bond Si single bond Mg single bond Cu single bond Ni alloys under T6 conditions. The phases present are the β-AlSiFe and Q-Al5Cu2Mg8Si6, and γ-Al7Cu4Ni, δ-Al3NiCu, and Q-Al5Cu2Mg8Si6. This figure has been adapted/reproduced from (ref. 36) with permission from Elsevier, copyright 2024.
Fig. 8
Fig. 8. The electrode potential IMPs in of 2024-T3 aluminum alloy. This figure has been adapted/reproduced from (ref. 37) with permission from MDPI, copyright 2024.
Fig. 9
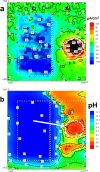
Fig. 9. Successive SIET-SVET scan of the Q-phase/Al couple after an hour in NaCl containing solution at 6 pH value: (a) SVET current density map, and (b) SIET pH map. This figure has been adapted/reproduced from (ref. 8) with permission from ELSEVIER, copyright 2024.
Fig. 10
Fig. 10. The π-phase and pure Al potentiodynamic polarization plots in sodium chloride solutions at different pH values. This figure has been adapted/reproduced from (ref. 103) with permission from Elsevier, copyright 2024.
Fig. 11
Fig. 11. Potentiodynamic polarization plots for Al2Cu and pure Al in 0.1 M Na2SO4 solution. This figure has been adapted/reproduced from (ref. 108) with permission from Elsevier, copyright 2024.
Fig. 12
Fig. 12. Surface morphology of Al2Cu/Al surface picture without and after immersion (a) 0 h; (b) 96 h of 0.1 M Na2SO4. This figure has been adapted/reproduced from (ref. 108) with permission from Elsevier, copyright 2024.
Fig. 13
Fig. 13. Al2CuMg–Al coupling current density map after (a) 1 h, (b) 4 h, and (c) 24 h of immersion in 0.005 M NaCl, (d) optical image after exposure for 24 h. This figure has been adapted/reproduced from (ref. 113) with permission from Elsevier, copyright 2024.
Fig. 14
Fig. 14. The schematic of the surface physical models of Al3Mg2 after immersion in 0.01 M NaCl solution of (a) pH 2; (b) pH 3.5–10.5 and (c) pH 12.
Fig. 15
Fig. 15. SVET current density distribution on Al3Mg2 embedded in pure Al matrix in 0.1 M NaCl solutions at different pH values (a) microscopic image of sample-probe arrangement (b) pH 2, (c) pH 6 (d) pH 13. This figure has been adapted/reproduced from (ref. 142) with permission from IOP SCIENCE, copyright 2024.
Fig. 16
Fig. 16. (a) SIET H+ and (b) Cl ion distribution map of the Al/MgZn2 couple after 1 hour in 0.1 NaCl solutions at pH 4. This figure has been adapted/reproduced from (ref. 73) with permission from IOP Science, copyright 2024.
Fig. 17
Fig. 17. SVET current density map on typical η-phase (MgZn2), β-phase (Al3Mg2), Q-phase (Al4Cu2Mg8Si7), and π-phase (Al8Mg3FeSi6) coupled to aluminum in different pH environments. This figure has been adapted/reproduced from (ref. , , , and 142) with permission from Elsevier, copyright 2024.
Fig. 18
Fig. 18. Hydrogen evolution per surface area on pure Mg, Mg2Si, Q-phase, and MgZn2 electrodes during (a) potentiodynamic polarization, (b) potentiostatic polarization at – 100 mVSCE (c), (d), (e), and (f) are photographs showing the evolution of hydrogen on the electrodes at – 100 mVSCE. This figure has been adapted/reproduced from (ref. 183) with permission from Springer Nature, copyright 2024.
None
Alexander I. Ikeuba
None
Chigoziri N. Njoku
None
Okpo O. Ekerenam
None
Demian I. Njoku
None
Inime I. Udoh
None
Enobong F. Daniel
None
Paul C. Uzoma
None
Ini-Ibehe N. Etim

References

    1. Buchheit R. G. A Compilation of Corrosion Potentials Reported for Intermetallic Phases in Aluminum Alloys. J. Electrochem. Soc. 1995;142:3994.
    1. Bland L. G. Birbilis N. Scully J. R. Exploring the Effects of Intermetallic Particle Size and Spacing on the Corrosion of Mg–Al Alloys Using Model Electrodes. J. Electrochem. Soc. 2016;163:C895–C906.
    1. Buchheit R. G. et al., Local dissolution phenomena associated with S phase (Al2CuMg) particles in aluminum alloy 2024-T3. J. Electrochem. Soc. 1997;144:2621–2628.
    1. Mondolfo L. F., The Aluminum–Magnesium–Zinc, Revere Copper and Brass Inc., Rome, NY, 1967
    1. Birbilis N. Buchheit R. G. Investigation and Discussion of Characteristics for Intermetallic Phases Common to Aluminum Alloys as a Function of Solution pH. J. Electrochem. Soc. 2008;155:C117.