. 2024;84(10):1009.
doi: 10.1140/epjc/s10052-024-13320-5. Epub 2024 Oct 7.

A first determination of the strong coupling α S at approximate N 3 LO order in a global PDF fit

Affiliations

A first determination of the strong coupling α S at approximate N 3 LO order in a global PDF fit

T Cridge et al. Eur Phys J C Part Fields. 2024.

Abstract

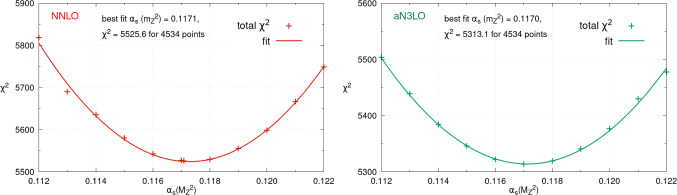
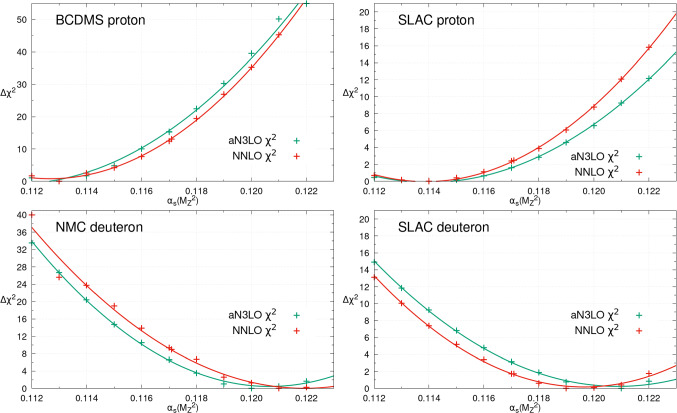
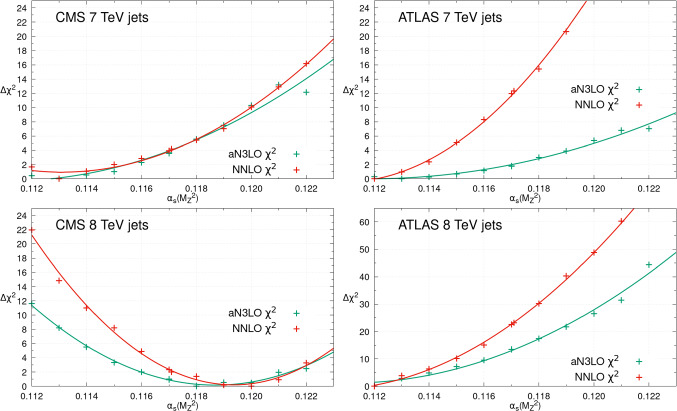
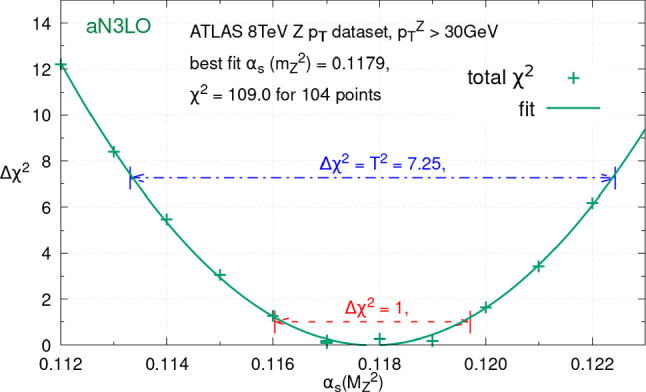
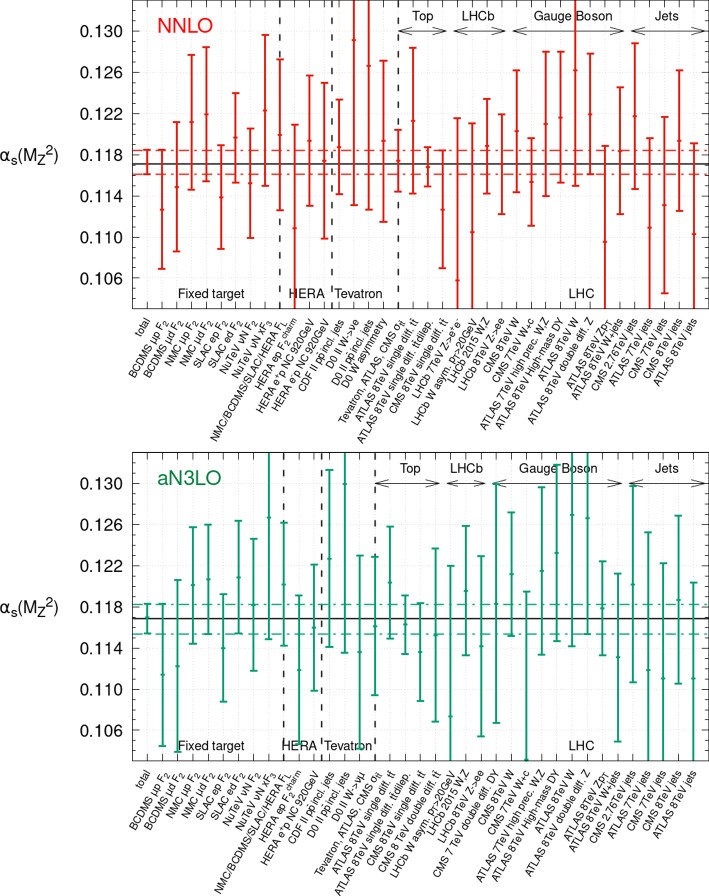
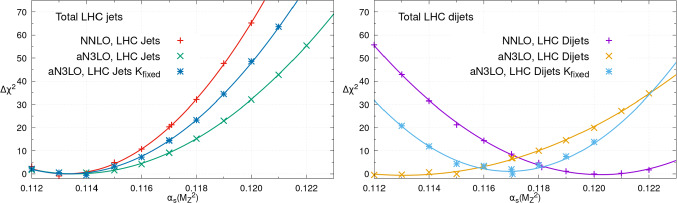
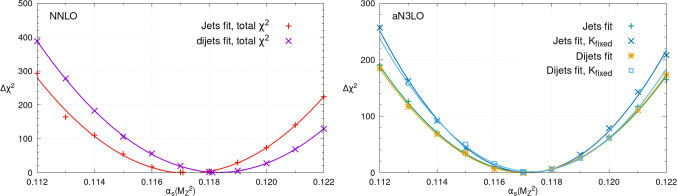
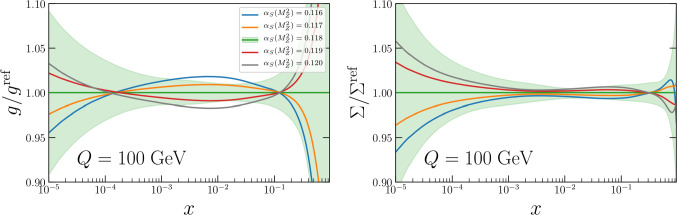
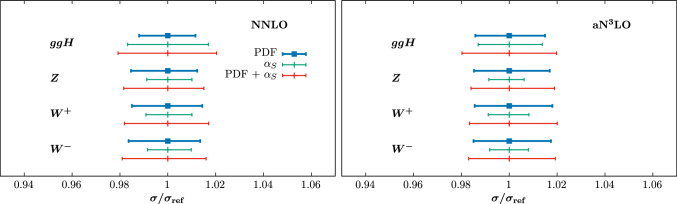
We present the first determination of the value of the strong coupling via a simultaneous global fit of the proton parton distribution functions (PDFs) at approximate N 3 LO (a N 3 LO) order in QCD. This makes use of the MSHT global PDF fitting framework, and in particular the recent theoretical advances t l;;mhat allow a PDF fit to now be performed at this order. The value of the strong coupling is found to be α S ( M Z 2 ) ( aN 3 LO ) = 0.1170 ± 0.0016 . This is in excellent agreement with the NNLO value of α S ( M Z 2 ) ( NNLO ) = 0.1171 ± 0.0014 , indicating that good perturbative convergence has been found. The resulting uncertainties, calculated using the MSHT dynamic tolerance procedure, are somewhat larger, but more accurate, at a N 3 LO, due to the missing higher order theoretical uncertainties that are included at this order, but not at NNLO. We in addition present a detailed breakdown of the individual dataset sensitivity to the value of the strong coupling, with special focus on the impact of fitting dijet rather than inclusive jet data. This choice is found to have a non-negligible impact, but with overall good consistency found, especially at a N 3 LO.


Figures

Fig. 1
Fig. 1
The χ2 profile for the NNLO (left) and aN3LO (right) PDF fits as αS(MZ2) is scanned from 0.112 to 0.122. The best fit αS(MZ2) value, best fit χ2 and number of datapoints are given on the figures
Fig. 2
Fig. 2
The individual datasets Δχ2=χ2-χ02 for different values of αS(MZ2), within the global PDF fits at NNLO (red) and aN3LO (green). This figure provides the profiles with αS(MZ2) for a small selection of the fixed target deep inelastic scattering datasets included
Fig. 3
Fig. 3
The individual datasets Δχ2=χ2-χ02 for different values of αS(MZ2), within the global PDF fits at NNLO (red) and aN3LO (green). This figure provides the profiles with αS(MZ2) for a small selection of the collider Drell–Yan datasets included
Fig. 4
Fig. 4
The individual datasets Δχ2=χ2-χ02 for different values of αS(MZ2), within the global PDF fits at NNLO (red) and aN3LO (green). This figure provides the profiles with αS(MZ2) for a small selection of the collider inclusive jet datasets included
Fig. 5
Fig. 5
The individual datasets Δχ2=χ2-χ02 for different values of αS(MZ2), within the global PDF fits at NNLO (red) and aN3LO (green). This figure provides the profiles with αS(MZ2) for a small selection of the collider top production datasets included
Fig. 6
Fig. 6
The Δχ2=χ2-χ02 for different values of αS(MZ2), within the global PDF fit at aN3LO for the ATLAS 8 TeV Z pT dataset. In addition the Δχ2=1,T2 limits are marked, the latter correspond to the bounds these data provide on αS(MZ2) in the MSHT global fit approach with a dynamic tolerance
Fig. 7
Fig. 7
The overall and dataset by dataset best fit value and upper and lower bounds on αS(MZ2), for a selection of the datasets in the global fit. The overall upper and lower bounds are given by the horizontal dashed lines, whilst the coloured vertical solid lines show the individual dataset bounds. The upper plot is the NNLO fit and the lower is the aN3LO fit
Fig. 8
Fig. 8
Posterior variations of the qg and gg splitting functions at the best fit value of αS(MZ2)=0.117, as well as for αS(MZ2)=0.116, 0.118 indicated by the dashed red curves. In the most visible part of the plots, i.e. below x10-2 the lower (upper) curves correspond to the values of 0.116 (0.118). Also shown are the prior and lower order results, for comparison
Fig. 9
Fig. 9
The χ2 profile for the LHC jet (left) or dijet (right) data only as αS(MZ2) is scanned from 0.112 to 0.122, comparing the PDF fits at NNLO, aN3LO and aN3LO with the K-factors fixed at the values corresponding to the global best fit for αS(MZ2)
Fig. 10
Fig. 10
The χ2 profile for the NNLO (left) and aN3LO (right) PDF fits as αS(MZ2) is scanned from 0.112 to 0.122, comparing the global total χ2 profiles for the LHC inclusive jets fit with that including instead the dijets data. The aN3LO plot also shows the effect of fixing the fitted aN3LO k-factors to the values corresponding to the global best fit for αS(MZ2)
Fig. 11
Fig. 11
The impact of varying αS(MZ2) in the aN3LO PDF fit on (left) the extracted gluon and (right) total singlet PDFs. This demonstrates the correlations between the PDFs and αS(MZ2)
Fig. 12
Fig. 12
Cross section uncertainties for gluon fusion Higgs, Z, and W± production at s=14 TeV at (left) NNLO with the MSHT20nnlo PDFs and (right) N3LO with the MSHT20aN3LO PDFs. The blue bars are the PDF uncertainties, the green represent the αS uncertainty, and the red bars are the combined PDF+αS uncertainty, added in quadrature

References

    1. S. Bailey, T. Cridge, L.A. Harland-Lang, A.D. Martin, R.S. Thorne, Eur. Phys. J. C 81, 341 (2021). arXiv:2012.04684
    1. T.-J. Hou et al., Phys. Rev. D 103 (2021)
    1. NNPDF, R.D. Ball et al., Eur. Phys. J. C 82, 428 (2022). arXiv:2109.02653
    1. ATLAS, G. Aad et al., Eur. Phys. J. C 82, 438 (2022). arXiv:2112.11266
    1. S. Alekhin, J. Blümlein, S. Moch, R. Placakyte, Phys. Rev. D 96, 014011 (2017). arXiv:1701.05838

LinkOut - more resources