. 2024 Oct 9;3(10):pgae411.
doi: 10.1093/pnasnexus/pgae411. eCollection 2024 Oct.

High accuracy meets high throughput for near full-length 16S ribosomal RNA amplicon sequencing on the Nanopore platform

Affiliations

High accuracy meets high throughput for near full-length 16S ribosomal RNA amplicon sequencing on the Nanopore platform

Xuan Lin et al. PNAS Nexus. .

Abstract

Small subunit (SSU) ribosomal RNA (rRNA) gene amplicon sequencing is a foundational method in microbial ecology. Currently, short-read platforms are commonly employed for high-throughput applications of SSU rRNA amplicon sequencing, but at the cost of poor taxonomic classification due to limited fragment lengths. The Oxford Nanopore Technologies (ONT) platform can sequence full-length SSU rRNA genes, but its lower raw-read accuracy has so-far limited accurate taxonomic classification and de novo feature generation. Here, we present a sequencing workflow, termed ssUMI, that combines unique molecular identifier (UMI)-based error correction with newer (R10.4+) ONT chemistry and sample barcoding to enable high throughput near full-length SSU rRNA (e.g. 16S rRNA) amplicon sequencing. The ssUMI workflow generated near full-length 16S rRNA consensus sequences with 99.99% mean accuracy using a minimum subread coverage of 3×, surpassing the accuracy of Illumina short reads. The consensus sequences generated with ssUMI were used to produce error-free de novo sequence features with no false positives with two microbial community standards. In contrast, Nanopore raw reads produced erroneous de novo sequence features, indicating that UMI-based error correction is currently necessary for high-accuracy microbial profiling with R10.4+ ONT sequencing chemistries. We showcase the cost-competitive scalability of the ssUMI workflow by sequencing 87 time-series wastewater samples and 27 human gut samples, obtaining quantitative ecological insights that were missed by short-read amplicon sequencing. ssUMI, therefore, enables accurate and low-cost full-length 16S rRNA amplicon sequencing on Nanopore, improving accessibility to high-resolution microbiome science.

Keywords: 16S rRNA; Nanopore; amplicon sequencing; long reads; microbiome.


Figures

Fig. 1.
Fig. 1.
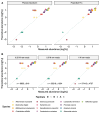
Characterization of raw ONT R.10.4 read quality for 16S rRNA gene amplicons. A) Observed vs. EE rates of length-filtered raw Nanopore reads. The darker shading indicates higher density of reads within that plot region. The dashed gray line represents a 1:1 slope. B) Density plot of read accuracy distribution of unfiltered and length + EE-filtered raw Nanopore reads. Mean accuracy values are indicated with vertical lines and are provided as text below the lines.
Fig. 2.
Fig. 2.
Summary of UMI-based SSU rRNA gene sequencing (ssUMI) workflow. A) The wet-laboratory steps, in which DNA templates are first quantified with ddPCR with a near full-length 16S rRNA gene assay. Based on ddPCR quantification, sample DNA containing 100,000 16S rRNA gene copies is added to the first round of ssUMI PCR for UMI tagging. Following two cycles of PCR, the UMI-tagged amplicons are further amplified in a second round of PCR using universal primers that flank the template and UMIs. After PCR amplification, the products are sample-barcoded, pooled, and sequenced on a Nanopore instrument. B) Data analysis workflow following sequencing, in which the reads are analyzed with the ssUMI pipeline for generation of high accuracy near full-length 16S rRNA consensus sequences. Initially, reads are quality filtered, binned based on UMIs from both ends (i.e. UMI pairs), and chimeras are removed. Consensus sequences are polished with Racon (3×) only in the rapid mode of the workflow, or followed by Medaka (2×) and Racon again (1×) in the standard workflow mode.
Fig. 3.
Fig. 3.
Accuracy and throughput of full-length 16S rRNA gene amplicons with ssUMI workflow. A) Comparison of amplicon sequence accuracies obtained for the ZymoBIOMICS Microbial Community DNA Standard using: Illumina short reads targeting the 16S rRNA gene (V4–V5 region), fully overlapped Illumina short reads (2 × 250 bp) targeting the 16S rRNA gene (V4 region), PacBio HiFi sequencing targeting the near full-length 16S rRNA gene (V1–V9 regions), LoopSeq (Illumina) synthetic long reads targeting near full-length 16S rRNA gene (V1–V9 regions), as well as UMI-based amplicon sequencing on ONT with ssUMI_rapid (rapid mode) and ssUMI_std (standard mode) targeting near full-length 16S rRNA gene (V1–V9 regions). For all sequence data types, amplicons were quality-filtered, primer-trimmed, contaminant sequences were removed, and read counts were normalized to the same depth (18,000 reads) across data types (see the Methods section). Impact of raw-read sequencing depth on distribution of (B) consensus sequence accuracy distribution and (C) UMI subread coverage, for ssUMI_std applied to full-length 16S rRNA gene amplicon (V1–V9 regions) from the ZymoBIOMICS Microbial Community DNA Standard. Subplots B and C share the x-axis. Different colors represent raw-read sequencing depths, circular points represent mean values and the crossbars represent the median values, while the shaded violin region represents the density distribution of the values at each depth. For subplot (C), the horizontal dashed line represents the minimum UMI subread coverage of 3× implemented in this study.
Fig. 4.
Fig. 4.
Accuracy of de novo features generated with ssUMI. The number of de novo sequence features generated for ASVs and OTUs at a 97% identity threshold. Sequence features were generated for the 8 bacterial species ZymoBIOMICS Microbial Community DNA Standard and the 14 bacterial species ZymoBIOMICS Gut Microbiome Standard, using either quality-filtered Nanopore raw reads or Nanopore reads processed with the ssUMI pipeline in rapid (i.e. ssUMI_rapid) and standard (i.e. ssUMI_std) modes. The number of sequence errors in features are indicated with the fill colors. The dashed gray line indicates the expected number of bacterial full-length 16S rRNA features in the reference community. The lack of a dashed gray line for ASVs in the ZymoBIOMICS Gut Microbiome Standard is due to uncertainty on the true number (see the Methods section). The results of the ZymoBIOMICS Microbial Community DNA Standard were generated with a single sample on a single R10.4 MinION flowcell, and that of the ZymoBIOMICS Gut Microbiome Standard were generated with combined sequences from six technical replicates of two different DNA extractions (see the Methods section) on two R10.4 MinION flowcells. For a given sample type, the same number of reads were used as input for ASV generation with quality-filtered Nanopore reads (e.g. no error correction) and ssUMI workflows.
Fig. 5.
Fig. 5.
Verifying accuracy and reproducibility of microbial abundance profiles obtained with ssUMI. A) Composition of ZymoBIOMICS Gut Microbiome Standard based on near full-length 16S rRNA (V1–V9 region) consensus sequences processed with the ssUMI_std pipeline (standard mode), in comparison to the theoretical abundances provided by the vendor. Technical PCR and sequencing replicates are shown for two different DNA extractions of the same cell mixture, phenol:chloroform and MagAttract PowerSoil Pro. B) The impact of sample raw-read depth on the resulting microbial community composition of the ZymoBIOMICS Gut Microbiome Standard (phenol:chloroform DNA extraction) obtained with 16S rRNA consensus sequences processed with the ssUMI_std pipeline (standard mode). To perform this analysis, raw reads were randomly subsampled from the original sequence libraries to given depths, and UMI-based consensus sequences were generated with the ssUMI pipeline (see the Methods section). The text values shown in the subplots represent the numbers of UMI-based consensus sequences generated (mean ± SD of triplicates).
Fig. 6.
Fig. 6.
Application of ssUMI to high-throughput profiling of wastewater and human gut samples. A) Number of UMI-based consensus sequences generated with ssUMI_std mode for samples representing wastewater matrix types. Each colored point represents one sequenced sample, the black dots represent the mean number of consensus sequences and the bars show SD. The shaded region represents the density distribution of all samples within that matrix type. B) PCoA of ASV Bray–Curtis dissimilarity, showing the clustering of the different wastewater sample types collected over 2 months. Each colored point within the PCoA represents one sequenced sample. C) Number of UMI-based consensus sequences generated with ssUMI_std mode for human stool samples inoculated with different donors. Each colored point represents one sequenced sample, the black dots represent the mean number of consensus sequences and the bars show SD. The shaded region represents the density distribution of all samples inoculated with that donor. D) PCoA of ASV Bray–Curtis dissimilarity, showing the clustering of the different human stool inocula and treatments. Each colored point within the PCoA represents one sequenced sample.
Fig. 7.
Fig. 7.
Abundance of Enterococcaceae ASVs under different osmolality and pH conditions. A) Relative abundances of Enterococcaceae ASVs generated with Illumina 16S rRNA amplicon sequencing targeting V4–V5 region. B) Relative abundances of Enterococcaceae ASVs generated with ssUMI_std mode for near full-length 16S rRNA amplicon sequencing targeting V1–V9 region. C) Absolute abundances of Enterococcaceae ASVs obtained by combining ddPCR quantification of total 16S rRNA genes and relative abundances obtained with ssUMI_std mode (see the Methods section). Only Enterococcaceae ASVs with > 0.5% abundance are shown. Note, the sample from 1,824 mOsm/kg in TL5 was not analyzed in this study because it did not yield sufficient data (Table  S9).

References

    1. Woese CR, Fox GE. 1977. Phylogenetic structure of the prokaryotic domain: the primary kingdoms. Proc Natl Acad Sci U S A. 74:5088–5090. - PMC - PubMed
    1. Pace NR. 2009. Mapping the tree of life: progress and prospects. Microbiol Mol Biol Rev. 73:565–576. - PMC - PubMed
    1. Giovannoni SJ, Britschgi TB, Moyer CL, Field KG. 1990. Genetic diversity in Sargasso sea bacterioplankton. Nature. 345:60–63. - PubMed
    1. Andersson AF, et al. 2008. Comparative analysis of human gut microbiota by barcoded pyrosequencing. PLoS One. 3:e2836. - PMC - PubMed
    1. Methé BA, et al. 2012. A framework for human microbiome research. Nature. 486:215–221. - PMC - PubMed

LinkOut - more resources