. 2024 Oct 6;4(10):2400201.
doi: 10.1002/smsc.202400201. Epub 2024 Sep 3.

Anti-aging Metabolite-Based Polymeric Microparticles for Intracellular Drug Delivery and Bone Regeneration

Affiliations

Anti-aging Metabolite-Based Polymeric Microparticles for Intracellular Drug Delivery and Bone Regeneration

Zhuozhi Wang et al. Small Sci. .

Abstract

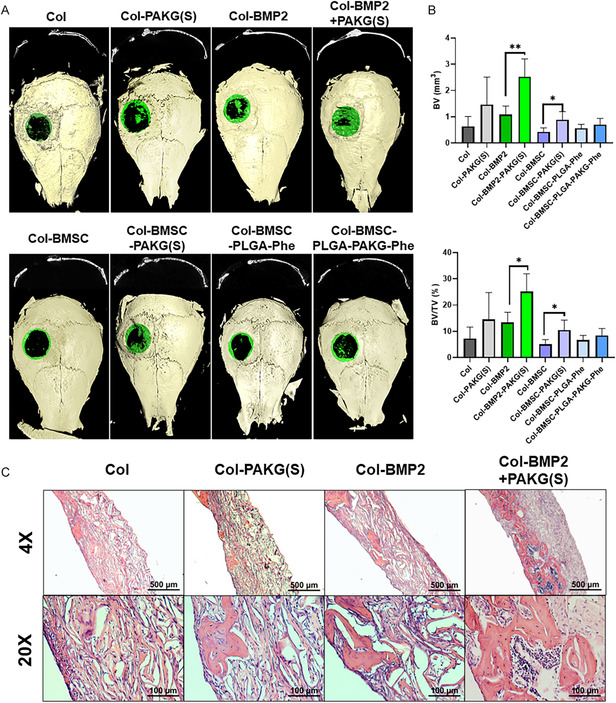
Alpha-ketoglutarate (AKG), a key component of the tricarboxylic acid (TCA) cycle, has attracted attention for its anti-aging properties. Our recent study indicates that locally delivered cell-permeable AKG significantly promotes osteogenic differentiation and mouse bone regeneration. However, the cytotoxicity and rapid hydrolysis of the metabolite limit its application. In this study, we synthesize novel AKG-based polymeric microparticles (PAKG MPs) for sustained release. In vitro data suggest that the chemical components, hydrophilicity, and size of the MPs can significantly affect their cytotoxicity and pro-osteogenic activity. Excitingly, these biodegradable PAKG MPs are highly phagocytosable for nonphagocytic pre-osteoblasts MC3T3-E1 and primary bone marrow mesenchymal stem cells (BMSCs), significantly promoting their osteoblastic differentiation. RNAseq data suggest that PAKG MPs strongly activate Wnt/β-catenin and PI3K-Akt pathways for osteogenic differentiation. Moreover, PAKG enables poly (L-lactic acid) and poly (lactic-co-glycolic acid) MPs (PLLA & PLGA MPs) for efficient phagocytosis. Our data indicate that PLGA-PAKG MPs-mediated intracellular drug delivery can significantly promote stronger osteoblastic differentiation compared to PLGA MPs-delivered phenamil. Notably, PAKG MPs significantly improve large bone regeneration in a mouse cranial bone defect model. Thus, the novel PAKG-based MPs show great promise to improve osteogenic differentiation, bone regeneration, and enable efficient intracellular drug delivery for broad regenerative medicine.

Keywords: Alpha-ketoglutarate; bone regeneration; intracellular drug delivery; microparticles; osteogenic differentiation.


Conflict of interest statement

Conflict of Interest The authors declare no conflict of interest.

Figures

Figure 1
Figure 1
AKG polymer (PAKG) synthesis, characterization, and microparticles (MPs) fabrication, characterization. A) Scheme of PAKG‐10diol, PAKG–10diol–PEG, PAKG–8diol, and PAKG–8diol–PEG synthesis. B) 1H NMR of PAKG–8diol–PEG. C) Schematic illustration of the fabrication of PAKG MPs. D) Scanning electron microscope (SEM) images of PLLA, PLGA, PAKG‐10diol, PAKG‐10diol‐PEG, PAKG‐8diol, and PAKG‐8diol‐PEG MPs (fabricated by homogenization) and their size distribution (scale bars = 10 μm).
Figure 2
Figure 2
Rationale of AKG polymer design, selection (effect of carbon chain length of diol and PEG), and PAKG MPs‐enhanced osteoblastic differentiation and mineralization. A) ALP activity of MC3T3‐E1 cultured with different doses of PAKG MPs for 7 days. B) MC3T3‐E1 cell proliferation with different concentrations of 1,8‐octanediol and 1,10‐decanediol. C) Improved ALP activity of MC3T3‐E1 cells by the same dose of PAKG–8diol and PAKG–8diol–PEG MPs on day 7. D) Microscope images of mineralization of MC3T3‐E1 with PAKG–8diol and PAKG–8diol–PEG MPs for 4 weeks after Alizarin Red S staining (scale bar = 500 μm) and Alizarin Red S quantitation after staining. Data are expressed as mean ± standard deviation (SD) (n = 3, *p < 0.05, **p < 0.01, ***p < 0.001).
Figure 3
Figure 3
Effect of microparticle size on osteoblastic differentiation and mineralization. A) SEM images of PAKG–8diol–PEG(S), PAKG–8diol(S), and PAKG–8diol–PEG(S) MPs (scale bars = 1 μm). B) ALP activity of MC3T3‐E1 and mBMSCs with PLLA(S), PLGA(S), PAKG–8diol–PEG(L), PAKG–8diol(S), and PAKG–8diol–PEG(S) MPs. C) Microscope images of MC3T3‐E1 cultured with PAKG–8diol–PEG(L), PAKG–8diol(S), PAKG–8diol–PEG(S) MPs for 24 days and mBMSCs cultured with PLLA(S), PLGA(S), PAKG–8diol–PEG(S) MPs for 28 days after Alizarin Red S staining (left) (sale bars = 500 μm) and Alizarin Red S quantification after staining (right). Data are expressed as mean ± SD (n = 3, *p < 0.05, **p < 0.01, ***p < 0.001).
Figure 4
Figure 4
RNA‐Seq analysis of pre‐osteoblasts treated by PAKG–8diol–PEG(S) MPs (PAKG). A) Volcano plot, B) KEEG pathway enrichment bubble plot, C) heatmap of differentially expressed genes. OC: no treatment and cultured in OC medium. PAKG: PAKG MPs‐treated group also cultured in OC medium. n = 3.
Figure 5
Figure 5
Osteoblast cell internalization of PAKG MPs through phagocytosis. A) Confocal microscopy images of 4',6‐diamidino‐2‐phenylindole (DAPI) (blue)‐ and phalloidin (green)‐stained MC3T3‐E1 cultured with different MPs. B) Confocal images of MC3T3‐E1 cultured with PAKG MPs, and PAKG MPs in the presence of cytochalasin D (CCD, a phagocytosis inhibitor, 50 nM) or Pitstop 2 (a clathrin‐independent endocytosis inhibitor, 30 μM). C) Quantitation of relative internalized MPs when treated with CCD or Pitstop 2. D) ALP activity of MC3T3‐E1 with CCD (50 nM), PAKG MPs, and PAKG MPs with CCD (50 nM). Scale bars = 50 μm. Data are expressed as mean ± SD (n = 3, **p < 0.01, ***p < 0.001).
Figure 6
Figure 6
PAKG enables PLGA MPs for intracellular drug delivery. A) SEM images of different MPs (scale bars = 10 μm) and confocal microscopy images of MC3T3‐E1 cultured with MPs for overnight (scale bars = 50 μm). B) Zeta potential of various MPs. C) Release profile of phenamil from PLGA and PLGA–PAKG MPs for 4 weeks. D) ALP activity of MC3T3‐E1 on day 7. E) Alizarin Red S staining (left) and quantification after (right) MC3T3‐E1 cultured with different MPs or Phe treatment in OC medium for 2 weeks (right). Scale bars = 500 μm. Data are expressed as mean ± SD (n = 3, *p < 0.05, ***p < 0.001, ****p < 0.0001).
Figure 7
Figure 7
PAKG MPs promote mouse cranial bone regeneration. A) μCT top‐view and cross‐section image of mouse cranial defects after 6 weeks post‐implantation. Newly generated bone marked in green color. B) Quantification measurement of total new bone volume (BV) and the ratio of bone volume versus total volume in defected area (BV/TV) in different treatment groups. All the results were expressed as means ± SD (n = 3–5, *p < 0.05, **p < 0.01). C) Representative H&E‐stained tissue sections acquired from the mouse cranial defects after 6 weeks post‐implantation (scale bars = 500 μm in the upper panel and 100 μm in the lower panel).

References

    1. Petite H., Viateau V., Bensaïd W., Meunier A., de Pollak C., Bourguignon M., Oudina K., Sedel L., Guillemin G., Nat. Biotechnol. 2000, 18, 959. - PubMed
    1. Ebraheim N. A., Elgafy H., Xu R., J. Am. Acad. Orthop. Surg. 2001, 9, 210. - PubMed
    1. Boerckel J. D., Kolambkar Y. M., Dupont K. M., Uhrig B. A., Phelps E. A., Stevens H. Y., García A. J., Guldberg R. E., Biomaterials 2011, 32, 5241. - PMC - PubMed
    1. Martino M. M., Briquez P. S., Maruyama K., Hubbell J. A., Adv. Drug Deliv. Rev. 2015, 94, 41. - PubMed
    1. Iaquinta M. R., Mazzoni E., Bononi I., Rotondo J. C., Mazziotta C., Montesi M., Sprio S., Tampieri A., Tognon M., Martini F., Front. Cell Dev. Biol. 2019, 7, 268. - PMC - PubMed

LinkOut - more resources