. 2024;13(1):55.
doi: 10.1007/s13721-024-00490-1. Epub 2024 Oct 7.

Motif discovery in hospital ward vital signs observation networks

Affiliations

Motif discovery in hospital ward vital signs observation networks

Rupert Ironside-Smith et al. Netw Model Anal Health Inform Bioinform. 2024.

Abstract

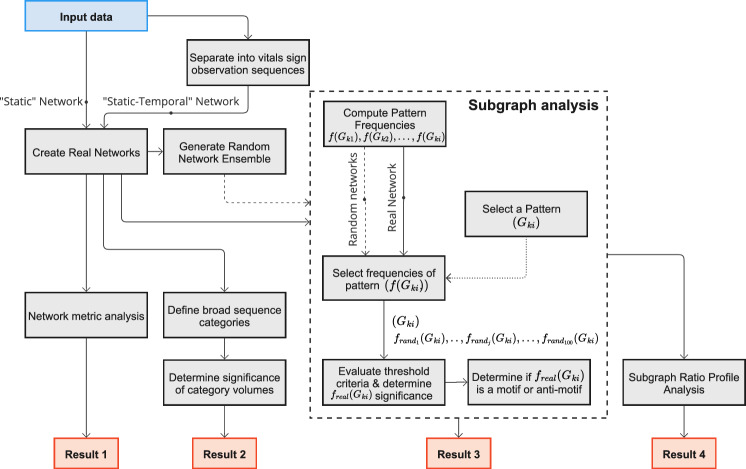
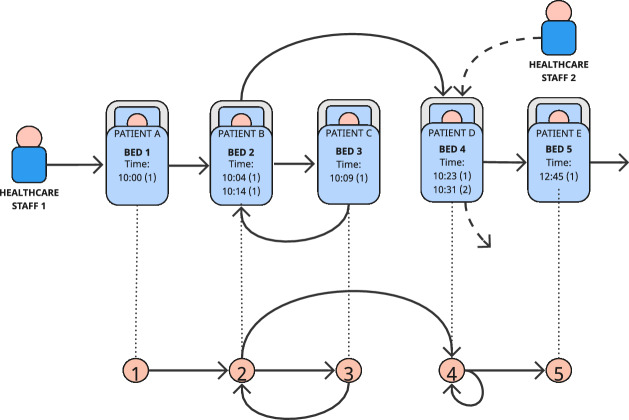
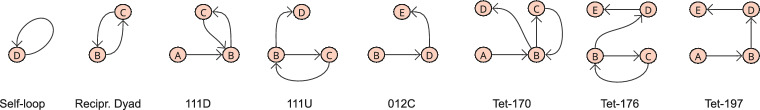
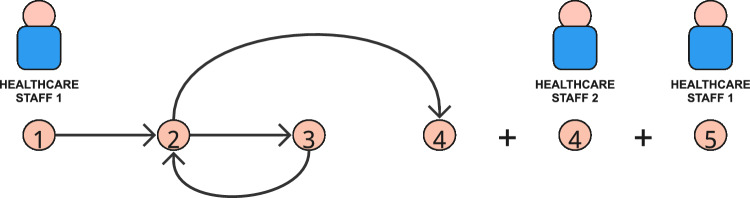
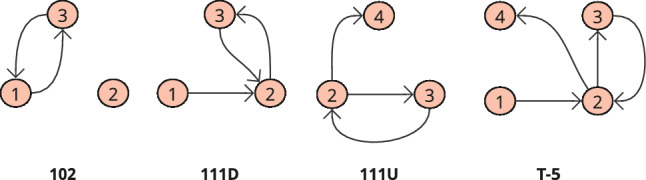
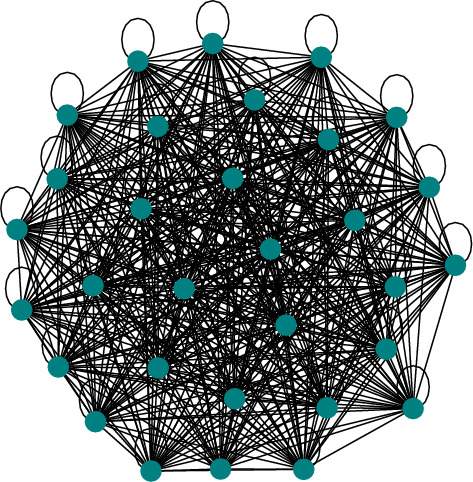
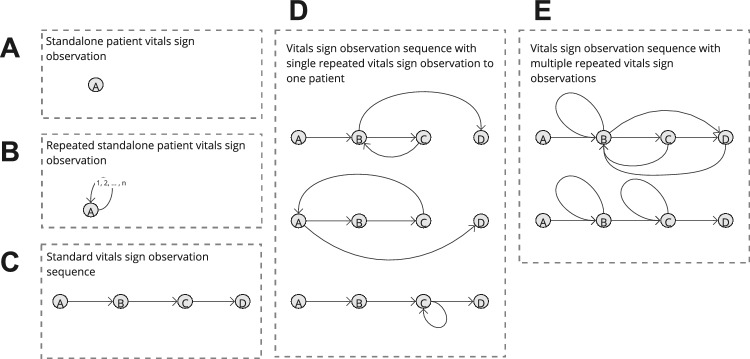
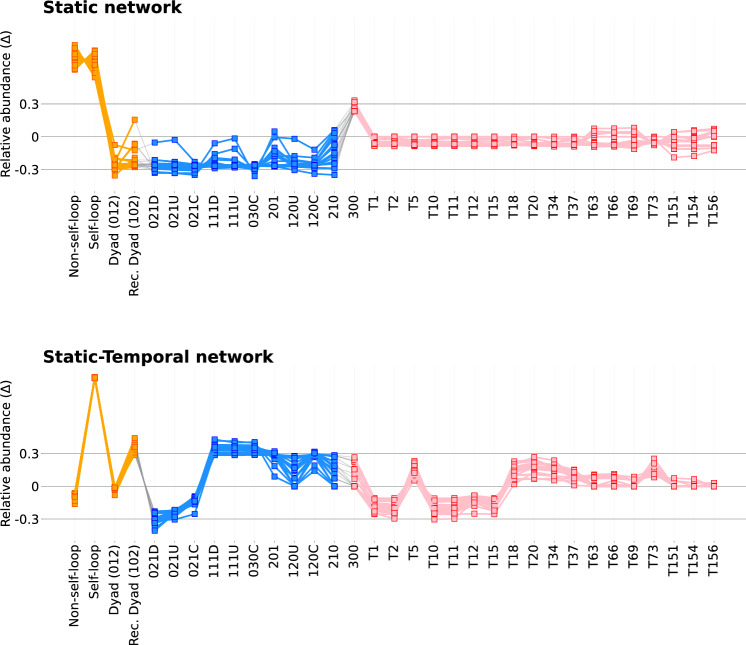
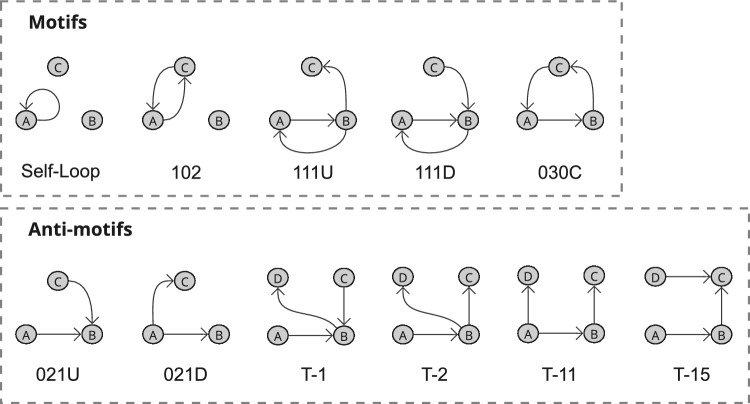
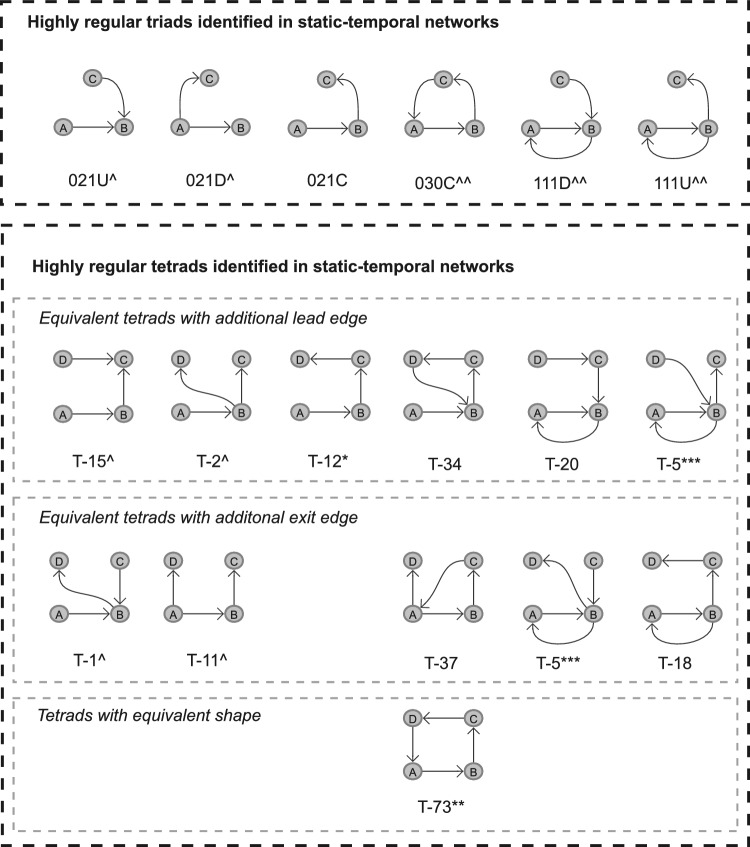
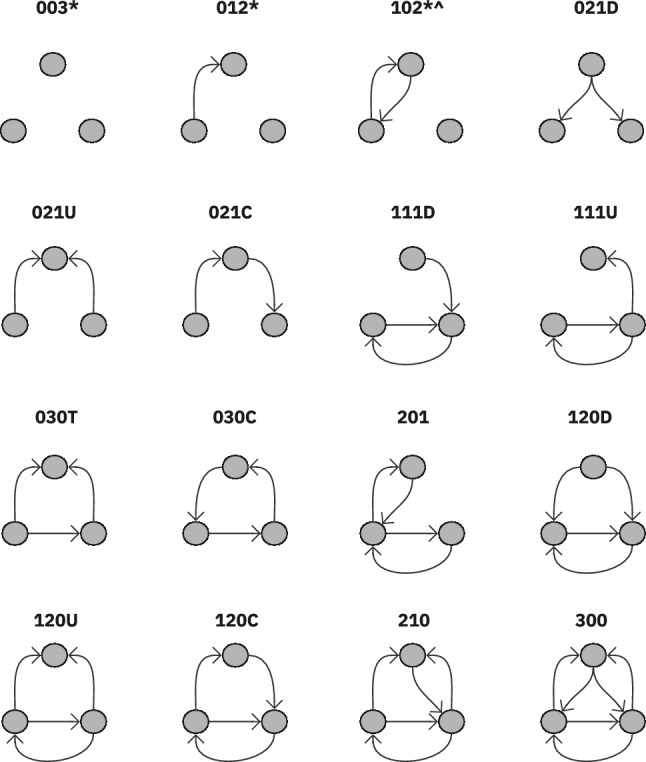
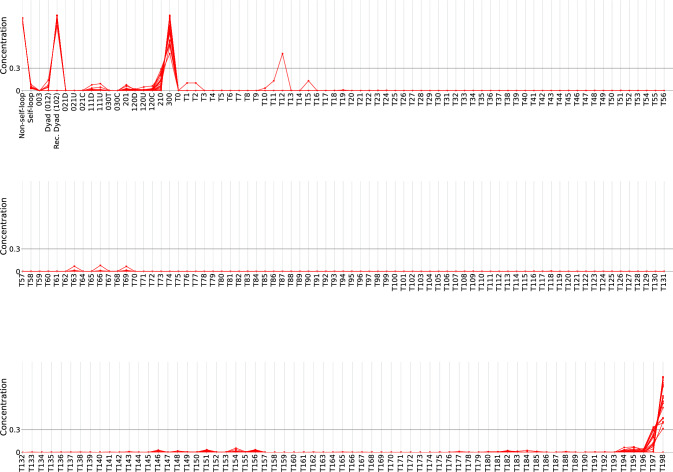
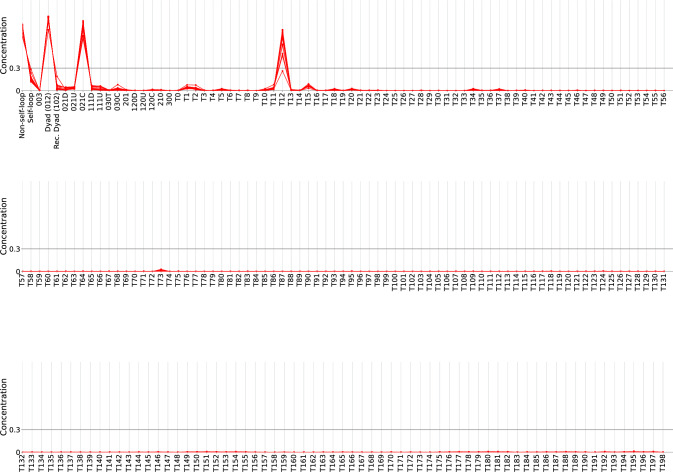
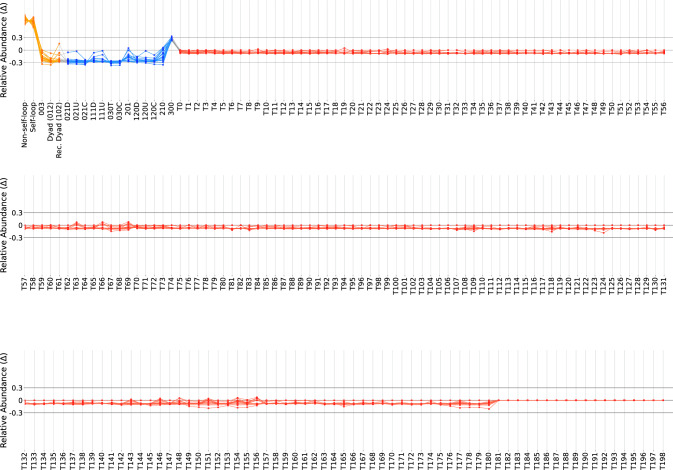
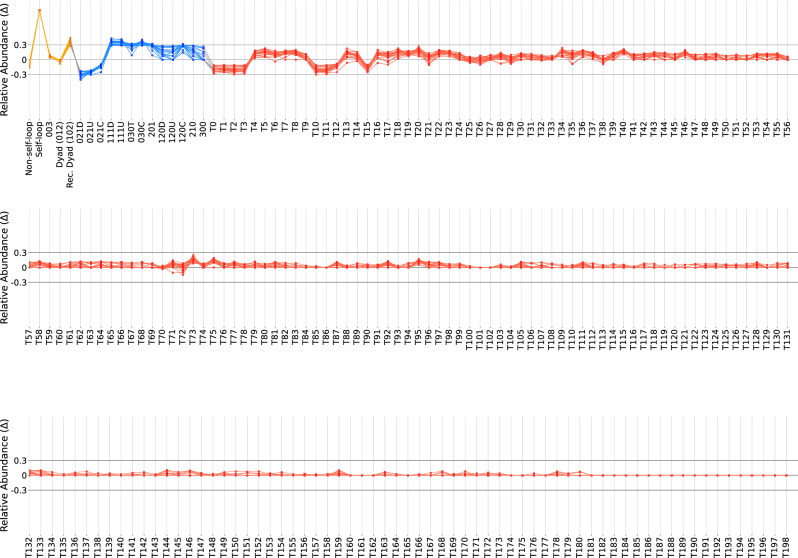
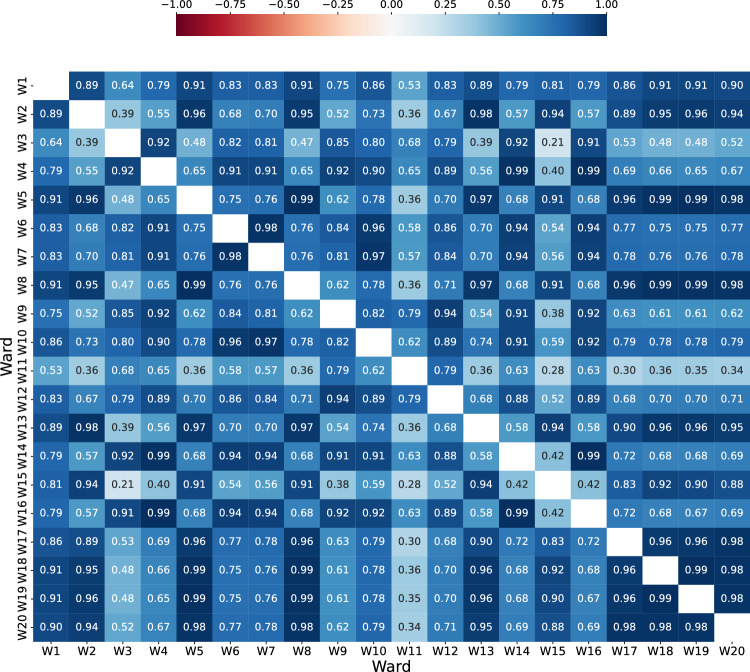
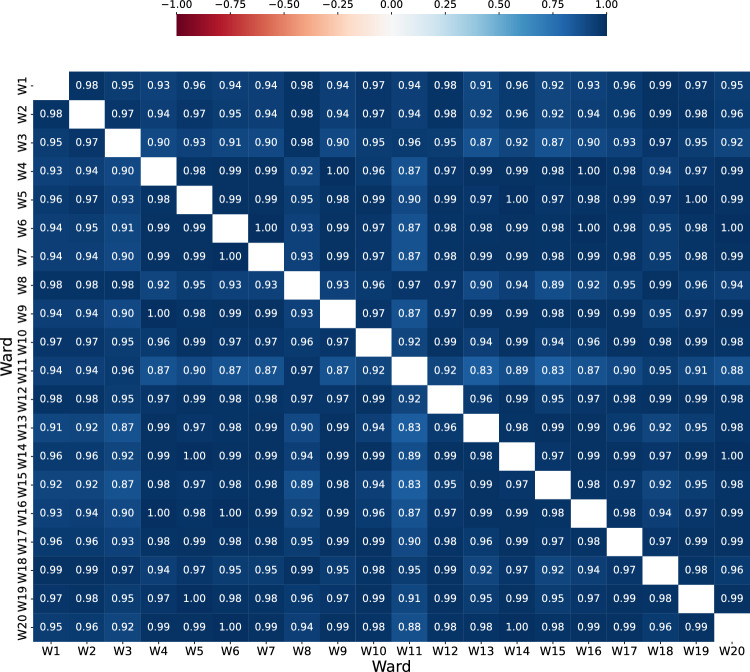
Vital signs observations are regular measurements used by healthcare staff to track a patient's overall health status on hospital wards. We look at the potential in re-purposing aggregated and anonymised hospital data sources surrounding vital signs recording to provide new insights into how care is managed and delivered on wards. In this paper, we conduct a retrospective longitudinal observational study of 770,720 individual vital signs recordings across 20 hospital wards in South Wales (UK) and present a network modelling framework to explore and extract behavioural patterns via analysis of the resulting network structures at a global and local level. Self-loop edges, dyad, triad, and tetrad subgraphs were extracted and evaluated against a null model to determine individual statistical significance, and then combined into ward-level feature vectors to provide the means for determining notable behaviours across wards. Modelling data as a static network, by aggregating all vital sign observation data points, resulted in high uniformity but with the loss of important information which was better captured when modelling the static-temporal network, highlighting time's crucial role as a network element. Wards mostly followed expected patterns, with chains or stand-alone supplementary observations by clinical staff. However, observation sequences that deviate from this are revealed in five identified motif subgraphs and 6 anti-motif subgraphs. External ward characteristics also showed minimal impact on the relative abundance of subgraphs, indicating a 'superfamily' phenomena that has been similarly seen in complex networks in other domains. Overall, the results show that network modelling effectively captured and exposed behaviours within vital signs observation data, and demonstrated uniformity across hospital wards in managing this practice.

Keywords: Motif discovery; Network analysis; Retrospective study; Subgraph ratio profile; Vital signs observations.


Conflict of interest statement

Conflict of interestAll authors declare they have no Conflict of interest.

Figures

Fig. 1
Fig. 1
Flow diagram of study methodology
Fig. 2
Fig. 2
PRISMA flow diagram of literature search methodology
Fig. 3
Fig. 3
Visual representation of the example set of vital signs observations (Table 2) and its corresponding network representation
Fig. 4
Fig. 4
Triads and tetrads represented in the example network shown in Fig. 3, where the full catalogue of triads is demonstrated in Fig. 13 and the full catalogue of Tetrads is demonstrated in Fig. 14
Fig. 5
Fig. 5
Adjusted network representation of the example network in Fig. 3. The network is segregated into 3; two ’stand-alone’ observations, one by Healthcare Staff 1 and one by Healthcare Staff 2, and one that can be described as an ’immediate intermediate patient return’ by Healthcare Staff 1
Fig. 6
Fig. 6
Clinical staff action in the static-temporal networks illustrated in Fig. 5 can be represented by four subgraphs; a reciprocating dyad, two triads, (111D and 111U, Fig. 13), and one tetrad (T5, Fig. 14)
Fig. 7
Fig. 7
The vital sign observations dataset for W1 visualised as a static network
Fig. 8
Fig. 8
Visualisation of a sample of 100 staff vital sign observation sequence networks extracted from the W1 dataset
Fig. 9
Fig. 9
A non-exhaustive example set of vital signs observation sequence networks (V=4) defined by 5 broad categories: A, a stand-alone vital sign observation, B, a rapidly repeated stand-alone vital signs observation, C, a vital sign observation sequence, D, a vital sign observation sequence with a single repeated vital sign observation for one patient, and E, a vital sign observation sequence with multiple repeated vital sign observations
Fig. 10
Fig. 10
Truncated SRPs of both static and static-temporal network constructions. SRPs are truncated by excluding subgraphs with C(Gk) μ values less than 0.01 for their respective construction. Subgraph labels in bold represent subgraphs that pass all motif or anti-motif candidate criteria discussed in Sect. 3.5. Figures 17 and 18 illustrate the non-truncated SRPs for both the static and static-temporal networks
Fig. 11
Fig. 11
Hospital ward motifs (Self-Loop, 102, 111U, 111D, and 030C) and anti-motifs (021U, 021D, T1, T2, T11, and T15) in the static-temporal network construction of vitals observation recordings (Sect. 4.4). Motifs and anti-motifs have been identified based on performance against criteria described in Sect. 3.5 and relative abundance, Δ, scores
Fig. 12
Fig. 12
Significant tetrads identified in the static-temporal vital sign observation networks effectively mirror the identified significant triads, accompanied by an additional leading or exiting edge. Where represents anti-motifs, motifs, * tetrads T12 that demonstrates both a lead and exit edge on top of a triad 021C, ** tetrad T73, the equivalent shape of 030C, and *** tetrad T5 which occurs twice
Fig. 13
Fig. 13
Variations of both static directed dyads, 012 and 102 (sometimes described as ‘Reciprocating Dyad’), and all 13 triad subgraphs. * marks weakly connected subgraphs (where any node in a subgraph cannot be reached by any other node) and marks subgraphs with strongly connected components (where there is a path between all vertices in the subgraph). Triads are labelled in line with convention (Batagelj and Mrvar 2001)
Fig. 14
Fig. 14
All 199 tetrads with labels
Fig. 15
Fig. 15
Concentration profile for all 217 subgraphs in the static network construction
Fig. 16
Fig. 16
Concentration profile for all 217 subgraphs for static-temporal network construction
Fig. 17
Fig. 17
Non-truncated SRP for all subgraphs for the static network construction
Fig. 18
Fig. 18
Non-truncated SRP for all subgraphs for the static-temporal network construction
Fig. 19
Fig. 19
Spearman’s correlation pairwise test matrix for the static network ward representation
Fig. 20
Fig. 20
Spearman’s correlation pairwise test matrix for the static-temporal network ward representation

References

    1. ABUHB (2017) Aneurin bevan university health board deteriorating patient policy
    1. Agasse-Duval M, Lawford S (2018) Subgraphs and motifs in a dynamic airline network. CoRR. arXiv:1807.02585
    1. Alon U (2003) Biological networks: the tinkerer as an engineer. Science 301:1866–1867. 10.1126/science.1089072 - PubMed
    1. Armstrong B, Walthall H, Clancy M et al (2008) Recording of vital signs in a district general hospital emergency department. Emerg Med J 25(12):799–802. 10.1136/emj.2007.052951 - PubMed
    1. Artzy-Randrup Y, Fleishman S, Ben-Tal N et al (2004) Comment on “network motifs: Simple building blocks of complex networks’’ and “superfamilies of evolved and designed networks’’. Science. 10.1126/science.1099334 - PubMed

LinkOut - more resources