Fatigue in early multiple sclerosis: MRI metrics of neuroinflammation, relapse and neurodegeneration
- PMID: 39386090
- PMCID: PMC11462441
- DOI: 10.1093/braincomms/fcae278
Fatigue in early multiple sclerosis: MRI metrics of neuroinflammation, relapse and neurodegeneration
Abstract
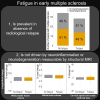
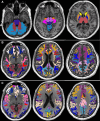
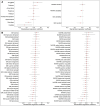
Multiple sclerosis (MS) is a neuroinflammatory and neurodegenerative disease affecting the brain and spinal cord. Fatigue is a common disabling symptom from MS onset, however the mechanisms by which underlying disease processes cause fatigue remain unclear. Improved pathophysiological understanding offers potential for improved treatments for MS-related fatigue. MRI provides insights into in vivo neuroinflammatory activity and neurodegeneration, although existing evidence for imaging correlates of MS fatigue is mixed. We explore associations between fatigue and MRI measures in the brain and spinal cord to identify neuroinflammatory and regional neurodegenerative substrates of fatigue in early relapsing-remitting MS (RRMS). Recently diagnosed (<6 months), treatment-naive people with RRMS (n = 440) were recruited to a longitudinal multi-centre nationally representative cohort study. Participants underwent 3-Tesla brain MRI at baseline and one year. We calculated global and regional white and grey matter volumes, white matter lesion (WML) load and upper cervical spinal cord cross-sectional area levels C2-3, and assessed new/enlarging WMLs visually. Participants were classed as fatigued or non-fatigued at baseline according to the Fatigue Severity Scale (>/≤36). Disability and depression were assessed with the expanded-disability status scale and Patient Health Questionnaire, respectively. MRI measures were compared between fatigue groups, both cross-sectionally and longitudinally, using regression analyses. Higher disability and depression scores were observed for participants with fatigue, with a higher number of fatigued participants receiving disease-modifying treatments at follow-up. Structural MRI data for brain were available for n = 313 (45% fatigued) and for spinal cord for n = 324 (46% fatigued). Cervical spinal cord cross-sectional area 2-3, white and grey matter volumes decreased, and WML volume increased, over time for both groups (q < 0.05). However, no significant between-group differences in these measures were found either cross-sectionally or longitudinally (q > 0.05). The presence of new/enlarging WMLs (49% in fatigued; 51% in non-fatigued) at follow-up also did not differ between groups (q > 0.05). Our results suggest that fatigue is not driven by neuroinflammation or neurodegeneration measurable by current structural MRI in early RRMS. This novel negative finding in a large multi-centre cohort of people with recently diagnosed RRMS helps to resolve uncertainty in existing literature. Notably, we showed that fatigue is prevalent in patients without brain radiological relapse, who may be considered to have inactive disease. This suggests that symptom detection and treatment should remain a clinical priority regardless of neuroinflammatory disease activity. More sensitive objective biomarkers are needed to elucidate fatigue mechanisms in RRMS, and ultimately facilitate development of effective targeted treatments for this important 'hidden disability'.
Keywords: fatigue; magnetic resonance imaging; multiple sclerosis; neurodegeneration; neuroinflammation.
© The Author(s) 2024. Published by Oxford University Press on behalf of the Guarantors of Brain.
Conflict of interest statement
The authors declare no conflicts of interest relevant to this paper. D.S.R. received research support from companies Abata Therapeutics, Sanofi-Genzyme and Vertex Pharmaceuticals, unrelated to this paper.
Figures


Comment in
-
Fatigue in multiple sclerosis: still elusive after all these years.Brain Commun. 2025 Mar 8;7(2):fcaf105. doi: 10.1093/braincomms/fcaf105. eCollection 2025. Brain Commun. 2025. PMID: 40177530 Free PMC article.
References
-
- Thompson AJ, Banwell BL, Barkhof F, et al. Diagnosis of multiple sclerosis: 2017 revisions of the McDonald criteria. Lancet Neurol. 2018;17(2):162–173. - PubMed
-
- Lysandropoulos AP, Havrdova E. ‘Hidden’ factors influencing quality of life in patients with multiple sclerosis. Eur J Neurol. 2015;22(S2):28–33. - PubMed
-
- Rooney S, Wood L, Moffat F, Paul L. Prevalence of fatigue and its association with clinical features in progressive and non-progressive forms of multiple sclerosis. Mult Scler Relat Disord. 2019;28:276–282. - PubMed
-
- Tremlett H, Marrie RA. The multiple sclerosis prodrome: Emerging evidence, challenges, and opportunities. Mult Scler J. 2021;27(1):6–12. - PubMed
Grants and funding
LinkOut - more resources
Full Text Sources
Miscellaneous
