. 2024 Sep 25:11:1358028.
doi: 10.3389/fvets.2024.1358028. eCollection 2024.

Predicting host species susceptibility to influenza viruses and coronaviruses using genome data and machine learning: a scoping review

Affiliations

Predicting host species susceptibility to influenza viruses and coronaviruses using genome data and machine learning: a scoping review

Famke Alberts et al. Front Vet Sci. .

Abstract

Introduction: Predicting which species are susceptible to viruses (i.e., host range) is important for understanding and developing effective strategies to control viral outbreaks in both humans and animals. The use of machine learning and bioinformatic approaches to predict viral hosts has been expanded with advancements in in-silico techniques. We conducted a scoping review to identify the breadth of machine learning methods applied to influenza and coronavirus genome data for the identification of susceptible host species.

Methods: The protocol for this scoping review is available at https://hdl.handle.net/10214/26112. Five online databases were searched, and 1,217 citations, published between January 2000 and May 2022, were obtained, and screened in duplicate for English language and in-silico research, covering the use of machine learning to identify susceptible species to viruses.

Results: Fifty-three relevant publications were identified for data charting. The breadth of research was extensive including 32 different machine learning algorithms used in combination with 29 different feature selection methods and 43 different genome data input formats. There were 20 different methods used by authors to assess accuracy. Authors mostly used influenza viruses (n = 31/53 publications, 58.5%), however, more recent publications focused on coronaviruses and other viruses in combination with influenza viruses (n = 22/53, 41.5%). The susceptible animal groups authors most used were humans (n = 57/77 analyses, 74.0%), avian (n = 35/77 45.4%), and swine (n = 28/77, 36.4%). In total, 53 different hosts were used and, in most publications, data from multiple hosts was used.

Discussion: The main gaps in research were a lack of standardized reporting of methodology and the use of broad host categories for classification. Overall, approaches to viral host identification using machine learning were diverse and extensive.

Keywords: coronaviruses; genome; influenza A viruses; interspecies transmission; machine-learning; scoping review; spillover.


Conflict of interest statement

The authors declare that the research was conducted in the absence of any commercial or financial relationships that could be construed as a potential conflict of interest.

Figures

Figure 1
Figure 1
The global distribution of a country-level number of distinct non-human species with an event of highly pathogenic H5 influenza detection between January 2014 and May 2024. An event is defined as a nationally confirmed influenza finding in animals or humans. This includes outbreaks on farms, village or commune level, cases in wildlife or humans, or positive surveillance findings in animals (3). This figure includes only non-human events. Data were obtained from the Food and Agricultural Organization (FAO) EMPRES-i dataset on May 29, 2024. Data includes all available HPAI H5 information from FAO. Species were reported as reported by the FAO and were not altered, whereas territory and country names were modified in the FAO’s dataset when needed to allow for complete joining between the map and the attribute data.
Figure 2
Figure 2
PRISMA flow diagram outlining the selection of relevant publications. PRISMA, Preferred Reporting Items for Systematic Reviews and Meta-Analyses; CIBB, Computational Intelligence Methods for Bioinformatics and Biostatistics; ICCBB, International Conference on Computational Biology and Bioinformatics; ISMB, Intelligent Systems for Molecular Biology.
Figure 3
Figure 3
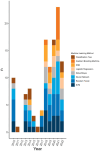
Viruses used per publication. (A) Viruses used per year per publication and the number of publications published per year. The search was conducted in May 2022 so there is not a complete record of publications from 2022. (B) Viruses used per publication, note: the publications where only others are listed did include coronavirus and influenza virus as part of a large group of viruses. Other viruses used are listed in Supplementary Table S5.
Figure 4
Figure 4
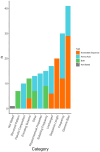
The databases used for obtaining viral genome sequences to be used within the classifiers and the number of analyses that used each database (n). Displayed by the virus type the database was used for (i.e., influenza virus or coronavirus). Database type was not collected for “other” viruses only influenza viruses and coronaviruses. Some analyses may have used multiple databases. RVDB, Reference Viral Database; Virus-Host DB, Virus-Host Database; ISD, Influenza Sequence Database (merged with IRD); ViPR, Virus Pathogen Database and Analysis Resource [merged with IRD to become Bacterial and Viral Bioinformatics Resource Center (BV-BRC)]; GISAID, Global Initiative on Sharing Avian Influenza Data; IRD, Influenza Research Database [merged with ViPR to become Bacterial and Viral Bioinformatics Resource Center (BV-BRC)]; NCBI, National Center for Biotechnology Information.
Figure 5
Figure 5
Sequence format transformations applied per analysis. Some analyses used multiple transformations. In some analyses, transformations were applied to both nucleotide sequence and amino acid sequence. Each category contains multiple different formats amalgamated into one category (Supplementary Table S8). The classification was determined by the most common sequence format used. The format used in the corresponding figure was determined based on whether nucleotide sequence, amino acid sequence, or both were selected in the corresponding input sequence question if no selection was made the classification defaulted to that used in Supplementary Table S8.
Figure 6
Figure 6
Top 8 machine learning algorithms used over time at the publication level. The representation of the top 8 machine learning algorithms used over time at the level of publication (i.e., if one publication used two different random forest classifiers it counts as random forest being used in a publication). Algorithms were displayed at the publication level rather than the classifier level to reflect the distribution of usage more accurately over time rather than representing a large change because one publication used one type of classifier multiple times.
Figure 7
Figure 7
Machine learning algorithm and feature selection method network analysis. The thickness of the edges reflects the impact and frequency of that relationship within the network, similarly, the size of the node reflects the frequency of the method.
Figure 8
Figure 8
Neural network algorithms used over time. The neural networks used per publication over time to see the trend of distribution of type over time. Neural networks were not used every year.

References

    1. Miller RS, Sweeney SJ, Slootmaker C, Grear DA, Di Salvo PA, Kiser D, et al. . Cross-species transmission potential between wild pigs, livestock, poultry, wildlife, and humans: implications for disease risk Management in North America. Sci Rep. (2017) 7:7821. doi: 10.1038/s41598-017-07336-z - DOI - PMC - PubMed
    1. Parrish CR, Holmes EC, Morens DM, Park E-C, Burke DS, Calisher CH, et al. . Cross-species virus transmission and the emergence of new epidemic diseases. Microbiol Mol Biol Rev. (2008) 72:457–70. doi: 10.1128/MMBR.00004-08 - DOI - PMC - PubMed
    1. Claes F, Kuznetsov D, Liechti R, Von Dobschuetz S, Dinh Truong B, Gleizes A, et al. . The EMPRES-i genetic module: a novel tool linking epidemiological outbreak information and genetic characteristics of influenza viruses. Database. (2014) 2014:bau008. doi: 10.1093/database/bau008 - DOI - PMC - PubMed
    1. Haydon DT, Cleaveland S, Taylor LH, Karen Laurenson M. Identifying reservoirs of infection: a conceptual and practical challenge. Emerg Infect Dis. (2002) 8:1468–73. doi: 10.3201/eid0812.010317, PMID: - DOI - PMC - PubMed
    1. Fermin G. Chapter 5 - Host Range, Host–Virus Interactions, and Virus Transmission. In: P Tennant, G Fermin, JE Foster, editors. Viruses [Internet]. London, United Kingdom: Academic Press; (2018). p. 101–34. Available from: https://www.sciencedirect.com/science/article/pii/B978012811257100005X.

Publication types

LinkOut - more resources