[Preprint]. 2025 Jan 2:2024.09.24.614777.
doi: 10.1101/2024.09.24.614777.

RanBALL: An Ensemble Random Projection Model for Identifying Subtypes of B-Cell Acute Lymphoblastic Leukemia

Affiliations

RanBALL: An Ensemble Random Projection Model for Identifying Subtypes of B-Cell Acute Lymphoblastic Leukemia

Lusheng Li et al. bioRxiv. .

Abstract

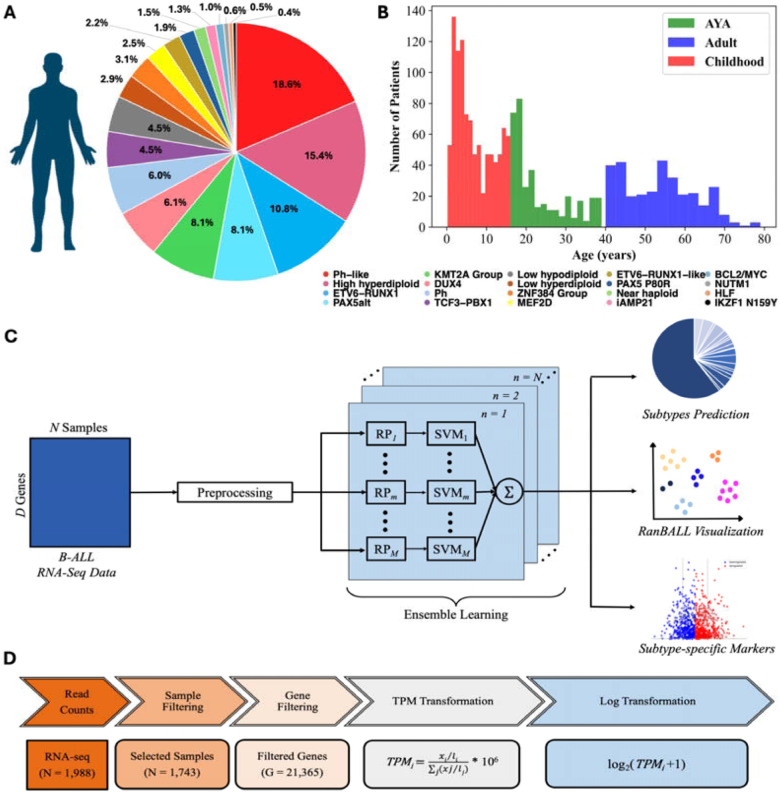
As the most common pediatric malignancy, B-cell acute lymphoblastic leukemia (B-ALL) has multiple distinct subtypes characterized by recurrent and sporadic somatic and germline genetic alterations. Identifying B-ALL subtypes can facilitate risk stratification and enable tailored therapeutic design. Existing methods for B-ALL subtyping primarily depend on immunophenotyping, cytogenetic tests and genomic profiling, which would be costly, complicated, and laborious. To overcome these challenges, we present RanBALL (an ensemble Random projection-based model for identifying B-ALL subtypes), an accurate and cost-effective model for B-ALL subtype identification. By leveraging random projection (RP) and ensemble learning, RanBALL can preserve patient-to-patient distances after dimension reduction and yield robustly accurate classification performance for B-ALL subtyping. Benchmarking results based on > 1700 B-ALL patients demonstrated that RanBALL achieved remarkable performance (accuracy: 0.93, F1-score: 0.93, and Matthews correlation coefficient: 0.93), significantly outperforming state-of-the-art methods like ALLSorts in terms of all performance metrics. In addition, RanBALL performs better than tSNE in terms of visualizing B-ALL subtype information. We believe RanBALL will facilitate the discovery of B-ALL subtype-specific marker genes and therapeutic targets to have consequential positive impacts on downstream risk stratification and tailored treatment design. To extend its applicability and impacts, a Python-based RanBALL package is available at https://github.com/wan-mlab/RanBALL.


Conflict of interest statement

Competing Interests The authors declare no conflict of interest.

Figures

Figure 1.
Figure 1.. Overview of B-ALL subtype identification study using RanBALL framework.
(A) The breakdown of the B-ALL dataset. The pie chart showed the distribution of 1,743 B-ALL samples across 20 molecular subtypes, each represented by a distinct color. Percentages reflected the relative prevalence of each subtype within the dataset. (B) The age distribution of the B-ALL dataset. The histogram illustrated the number of patients within each age group across three categories: childhood (red), adolescent and young adult (AYA, green), and adult (blue). (C) The framework of RanBALL. The feature dimension of preprocessed data was reduced by RP, and an ensemble of SVM classifier was trained on multiple dimensionally reduced matrices. In this framework, the dimensionality to be reduced to was predefined as 1200. The symbol m represents the m-th reduced-dimensional data matrix, while n denotes the predicted subtype. The RanBALL framework was designed to classify distinct subtypes, with the final prediction obtained through an aggregated output from the ensemble. Beyond subtype prediction, RanBALL also facilitated enhanced visualization of subtype clusters and the identification of subtype-specific markers, providing additional insights into the biological characteristics of each subtype. (D) Data preprocessing pipeline. The flowchart outlines the multi-step preprocessing applied to the RNA-seq data, starting with raw read counts and ending with log-transformed TPM values for 21,365 genes from 1,743 selected samples.
Figure 2.
Figure 2.. RP preserves sample-to-sample information better than state-of-the-art dimension reduction methods including PCA, t-SNE, and UMAP for RanBALL subtype identification.
We compared RP with other state-of-the-art dimensionality reduction methods across different dimensions (400, 600,…, 2000). The upper triangular section of each matrix displayed the PCC between the sample-to-sample distances in the original high-dimensional space (Ori.) and the corresponding reduced-dimensional space for each method. Higher PCC values indicated better preservation of the original data structure. RP consistently achieved higher PCC (highlighted in red) that outperformed PCA, t-SNE, and UMAP. The lower triangular section provided scatter plots of pairwise distances between samples before and after dimensionality reduction, illustrating how well each method preserved the relative distances between points.
Figure 3.
Figure 3.. The performance of RanBALL in different RP models.
(A) The ensemble RP model outperformed individual RP models across different reduced dimensions. Red boxes represented the accuracy distribution of the ensemble method aggregating 30 RPs, while green boxes denoted the accuracy distribution of individual classifiers on single RP. Statistical significance was assessed using the Wilcoxon signed-rank test, with p-values displayed above each comparison. (B) The model performance across different reduced dimensions. The violin plot illustrated the distribution of accuracy scores for dimensions ranging from 100 to 2000, with an interval of 200. (C) The model performance across different ensemble sizes. Violin plots depicted the distribution of accuracy scores for ensemble sizes ranging from 5 to 50. Black dots represented individual data points, while the violin shape showed the probability density of the data.
Figure 4.
Figure 4.. Comparing RanBALL with state-of-the-art methods like ALLSorts for B-ALL subtyping.
(A) Comparing RanBALL and ALLSorts for identifying B-ALL subtypes in terms of various performance metrics. Accuracy, F1-score and MCC were used for evaluating model performance. Box plots illustrated the distribution of Accuracy, F1-score, and MCC across 100 times 5-fold cross validation. (B) Prediction probability distribution for the 30% held-out test set using RanBALL. Each point represents the probability of a sample (out of 521) being classified into a specific B-ALL subtype. Specifically, the blue dots indicate the specific subtype that the RanBALL model predicts to align with the categories on the horizontal axis. (C, D) Confusion matrices for the 30% held-out test set, comparing RanBALL (C) and ALLSorts (D) performance. Each element of the matrices shows the number of samples classified, with the diagonal representing correct classifications (True Positives). Color intensity correlates with the number of samples.
Figure 5.
Figure 5.. Comparing B-ALL and state-of-the-art visualization methods like tSNE for visualizing B-ALL subtype groups.
(A) RanBALL visualization of the reduced dimension matrix incorporating predicted subtype information. (B) t-SNE visualization of the reduced dimension matrix with conventional gene expression profiling information only. The same color scheme was used in the two plots.
Figure 6.
Figure 6.. Subtype-specific differential gene expression analysis within B-ALL subtypes.
(A, D, G) Volcano plots illustrated differential expression genes between specific B-ALL subtypes and all other subtypes. The x-axis represented log2 fold change, while the y-axis showed -log10(p-value). Red dots indicated 20 significantly up-regulated genes, blue dots represented 20 significantly down-regulated genes. Top 20 DEGs were labeled, with the most significant gene circled in red. (A) Ph-like vs. rest; (D) PAX5alt vs. rest; (G) High hyperdiploid vs. rest. (B, E, H) Heatmaps displayed expression patterns of the top 20 DEGs for each subtype comparison. Rows represented genes, columns represented samples. Color scale ranges from blue (low expression) to red (high expression). Hierarchical clustering dendrograms were shown for both genes and samples. Sidebar annotations indicated sample subtypes and relative level of gene expression. (B) Ph-like vs. rest; (E) PAX5alt vs. rest; (H) High hyperdiploid vs. rest. (C, F, I) The expression plot of the up-regulated DEG for Ph-like subtype. RanBALL plots visualized the expression levels of the significantly up-regulated gene for each subtype across all B-ALL samples. Each point represented a sample, colored by expression intensity (red: high, grey: low). Numbers indicated different B-ALL subtypes. (C) DEG for Ph-like (ENAM); (F) DEG for PAX5alt (TPBG); (I) DEG for High hyperdiploid (LOXHD1).

References

    1. Hunger Stephen P., Mullighan Charles G. Acute Lymphoblastic Leukemia in Children. N Engl J Med. 373 (16): 1541–52. - PubMed
    1. Chouvarine P, Antić Ž, Lentes J, Schröder C, Alten J, Brüggemann M, et al. Transcriptional and Mutational Profiling of B-Other Acute Lymphoblastic Leukemia for Improved Diagnostics. Cancers. 2021. Nov 12;13(22):5653. - PMC - PubMed
    1. Frisch Avraham, Ofran Yishai. How I diagnose and manage Philadelphia chromosome-like acute lymphoblastic leukemia. Haematologica. 2019. Oct 30;104(11):2135–43. - PMC - PubMed
    1. Meyers S, Alberti-Servera L, Gielen O, Erard M, Swings T, De Bie J, et al. Monitoring of Leukemia Clones in B-cell Acute Lymphoblastic Leukemia at Diagnosis and During Treatment by Single-cell DNA Amplicon Sequencing. HemaSphere [Internet] 2022;6(4). Available from: https://journals.lww.com/hemasphere/fulltext/2022/04000/monitoring_of_le... - PMC - PubMed
    1. Bassan R, Hoelzer D. Modern Therapy of Acute Lymphoblastic Leukemia. J Clin Oncol. 2011. Feb 10;29 (5):532–43. - PubMed

Publication types