[Preprint]. 2024 Sep 24:2024.09.21.614255.
doi: 10.1101/2024.09.21.614255.

MAX inactivation deregulates the MYC network and induces neuroendocrine neoplasia in multiple tissues

Affiliations

MAX inactivation deregulates the MYC network and induces neuroendocrine neoplasia in multiple tissues

Brian Freie et al. bioRxiv. .

Update in

Abstract

The MYC transcription factor requires MAX for DNA binding and widespread activation of gene expression in both normal and neoplastic cells. Surprisingly, inactivating mutations in MAX are associated with a subset of neuroendocrine cancers including pheochromocytoma, pituitary adenoma and small cell lung cancer. Neither the extent nor the mechanisms of MAX tumor suppression are well understood. Delet-ing Max across multiple mouse neuroendocrine tissues, we find Max inactivation alone produces pituitary adenomas while Max loss cooperates with Rb1/Trp53 loss to accelerate medullary thyroid C-cell and pituitary adenoma development. In the thyroid tumor cell lines, MAX loss triggers a striking shift in genomic occupancy by other members of the MYC network (MNT, MLX, MondoA) supporting metabolism, survival and proliferation of neoplastic neuroendocrine cells. Our work reveals MAX as a broad suppressor of neuroendocrine tumorigenesis through its ability to maintain a balance of genomic occupancies among the diverse transcription factors in the MYC network.


Conflict of interest statement

Competing interests: Authors declare they have no competing interests

Figures

Figure 1:
Figure 1:. Max deletion results in pituitary adenomas that arise with long latency.
A) Illustration of mouse models employed to study roles for Max in neuroendocrine tumorigenesis. B) Kaplan-Meier curve showing survival with Max inactivation in the Ascl1-Cre-ERT2 model following tamoxifen delivery with p-value from log-rank test shown. C) Histology showing pituitary lesions in control and Max-deleted mice. D) Western blot analyses of pituitary tumors arising with Max deletion. As a positive control, pituitary tumors from RP mice with Rb1/Trp53 deletion driven by Ascl1-Cre-ERT2 are also shown. Asterisk indicates position of the N-terminal fragment of the truncated MAX protein in RPMax cells.
Figure 2:
Figure 2:. Max deletion cooperates with Rb1/Trp53 loss to drive medullary thyroid carcinoma and pituitary adenomas.
A) Illustration of mouse models employed to examine synergy between Rb1/Trp53 and Max loss in neuroendocrine tumorigenesis. B) Hematoxylin and Eosin staining of pituitary and thyroid from RP vs RPMax models at 10-weeks post tamoxifen, with RP model exhibiting medullary hyperplasia and small pituitary adenomas while the RPMax model exhibiting bilateral medullary adenomas and large pituitary tumors. Quantification of increase in pituitary tumor size in the RPMax model shown to the right. C) Kaplan-Meier curve showing accelerated time to morbidity in the RPMax cohort with p-value fromlog-rank test shown. D,E) Mice in both RP and RPMax models exhibited medullary thyroid C cell and pituitary adenomas, with representative hematoxylin and eosin images of thyroid (D) and pituitary tumors (E) shown. F,G) Western blot analyses in thyroid tumors (F) and pituitary tumors (G) showing increased abundance of one carbon pathway proteins SHMT1 and ATIC with MAX loss. Asterisks indicate position of the N-terminal fragment of the truncated MAX protein in RPMax cells. H) Heat map showing RNA-seq data from pituitary tumors of RP and RPMax models as well as the Max-null only tumors (Rb1/Trp53 wild-type) that arise with long latency.
Figure 3:
Figure 3:. Increased proliferation in RPMax vs RP cell thyroid carcinoma cell lines.
A) Western blot analysis showing loss of full-length MAX in thyroid cancer cell lines derived from the RPMax compared to those derived from the RP model. Asterisk indicates position of the N-terminal fragment of the truncated MAX protein in RPMax cells. B) CellTiter-Glo assays showing cell growth in 4 RPM and 4 RP thyroid cancer lines (n= 3 independent experiments). C) Western blot showing doxycycline-inducible return of MAX to an RPMax thyroid cancer cell line H7536. D) CellTiter-Glo assays showing suppressed cell growth upon return of MAX to the H7536 cell line (n=3 independent experiments). E) Venn diagram showing genes with increased expression upon MAX loss (EdgeR analyses, FDR <0.05) comparing RPMax to RP thyroid tumors, tumor-derived cell lines and genes with decreased expression upon doxycycline induced return of MAX to H7536. F,G) Pathway enrichment analyses querying GO Biological Processes (F) and ENCODE/CHEA datasets (G) including the 50 core MAX-regulated genes from (E).
Figure 4.
Figure 4.. MAX genomic occupancy and correlation with gene expression changes in MAX-null thyroid tumors.
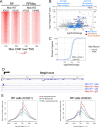
A) Chromatin Immunopreciptation (ChIP) was performed on cell lines established from thyroid tumors with wild-type Max gene (RP, Max WT) or a mutant Max gene (RPMax, Max KO). Two of 3 biological replicates are shown. ChIP was carried out using anti-MAX or control IgG antibody. Heatmaps of MAX signal were generated centered on the transcription start site (TSS) +/− 2kb of flanking regions for each gene. B) Volcano plots of RNA-Seq data (comparing RPMax vs RP cell lines) were generated showing gene expression change (Log2FoldChange, x-axis) vs statistical significance (−log10 adjusted p value, y-axis) for every expressed gene comparing RPMax to RP cell lines. Genes occupied by Max ChIP in RP cell lines (identified by peakcalls) are shown in blue. Genes up-regulated in all data sets (50 genes, from Figure 3E) and bound by MAX are shown as red dots. The number of MAX bound genes that are up- and down-regulated are also shown. C) Cumulative distribution plots depicting the rank-order (y-axis, Percent of genes) of log2FoldChange (x-axis) of RNA-Seq data (comparing RPMax vs RP cell lines). MAX bound genes (dark blue) and genes determined to be MAX unbound (light blue) are shown. The difference between the distributions is statistically determined using Kolmogorov-Smirnov (KS) statistics. D) Genomic tracks showing Max occupancy at the Stag3 gene locus in RP and RPMax cells. E) Line plots from ChIP experiments performed in (A) on Max WT RP cells were generated for all significantly changed (blue line), up-regulated (red), and down-regulated (green) genes in the RPMax cells. Each line is centered on the TSS (+/− 2kb) of every gene represented.
Figure 5.
Figure 5.. Alterations in MNT genomic occupancy correlates with gene expression changes in RP and RPMax tumor cells.
A) Plots of genomic region over gene bodies (x-axis) vs normalized coverage (y-axis) of MAX/MNT bound cluster 1 (see Figure S3C), which was a cluster of peaks determined to be differentially occupied by MNT. Coverage of MAX for RP (MAX WT, blue) is compared to that from RPMax (MAX KO, red) cells. B) Plots of MNT coverage of MAX/MNT bound cluster 1 comparing RP (blue) and RPMax (red) cells, similar to panel A. C) Genomic tracks showing differential occupation of the Rorc promoter in RP (Max WT) and RPMax (Max KO) cells as determined by ChIP-Seq. The antibodies (against MAX, MNT, MLX) used for ChIP are shown (at left) after the hyphen. D) Volcano plot of RNA-Seq gene expression changes comparing RP vs RPMax thyroid tumors (Log2FoldChange on the x-axis, −Log10 adjusted p value on y-axis). Genes with peaks that map to MAX bound sites (blue) and in MAX/MNT cluster 1 (red) are shown. E) Cumulative distribution plots depicting the ranked-order (y-axis, Percent of genes) vs log2FoldChange (x-axis) of RNA-Seq data (comparing RPMax vs RP thyroid tumors). MNT cluster 1 genes (dark blue) and a similarly sized set of genes determined to not be MNT occupied (light blue) are shown. The difference between the distributions is statistically determined using Kolmogorov-Smirnov (KS) statistics. F) Enrichment analysis of genes found to be differentially occupied by MAX and MNT in Max WT RP tumor-derived thyroid cell lines (Mnt cluster1 from Fig. S5C). Enrichment categories are plotted as the −log10 of the adjusted P value (y-axis, −log10 padj), and Odds.Ratio (x-axis).
Figure 6.
Figure 6.. Altered MondoA genomic occupancy in RPMax tumor lines and MAX addback cell lines.
A,B) Cut&Run heatmap analysis of MAX or MondoA in cells derived from Max-mutant thyroid tumor cells expressing DOX-inducible MAX (MAX-addback) or control vector (Vector). Cut&Run was performed on 1 million cells using the Auto Cut&Run robotic method with anti-Max, anti-MondoA, or control IgG antibody. Duplicate samples were merged, and heatmaps were plotted for Max (left) or MondoA (right) centered on the TSS +/− 2kb of flanking regions for every gene (panel A) or MondoA centered on MAX peaks as determined by peakcalls (panel B). C) Genomic tracks showing differential MondoA occupancy of the Npm1 promoter in Max-null cells reconstituted with DOX induced MAX (MAX-addback), or vector control as determined by ChIP-Seq. The antibodies used for ChIP are shown (left) left after the hyphen for each cell type. D) Volcano plot of RNA-Seq gene expression changes comparing RP vs RPMax thyroid tumors (Log2FoldChange on the x-axis, −Log10 adjusted p value on y-axis). Genes with peaks that map to Mlx cluster 1 (blue) and both Mlx cluster 1 and Max (red) are shown. E) Cumulative distribution plots depicting the rank-order (y-axis, Percent of genes) vs log2FoldChange (x-axis) of RNA-Seq data (comparing RPMax vs RP thyroid tumors). Mlx cluster 1 genes (dark blue) and a similar sized set of genes not in an Mlx occupied cluster (light blue) are shown. The difference between the distributions are statistically determined using Kolmogorov-Smirnov (KS) stats.
Figure 7.
Figure 7.. Differential sensitivity and changes in gene expression of Max-inactivated thyroid tumor upon inhibition of MNT, MLX and MondoA.
A) Thyroid tumor cell lines (3 independent RP and 3 RPMax lines) were transfected with the indicated siRNA and allowed to reconstitute over 4 days. Outgrown spheres were enumerated and normalized to the siCtrl condition. siDeath is included as a control for transfection efficacy. B) Thyroid tumor cell lines (3 independent RP and 3 RPMax lines) were seeded at equal density with either vehicle (DMSO) or SBI-477 (Mondo Inhibitor, 20uM). After 4 days, cells were counted and normalized to DMSO. C) RPMax thyroid tumor cell line H7536, reconstituted with either control vector (pCW Vector) or doxycycline-inducible Max construct (pCW MAX) were cultured in the absence or presence of DOX and/or SBI-477 for 96 hours then cells were counted and normalized to untreated cells for each line. For all data, p-values were calculated using ANOVA with a Tukey’s adjustment. D) Enrichment analysis of genes that were down-regulated in tumor cells expressing wild-type Max, but up-regulated in tumor cells with Max deleted upon MondoA silencing (using a Mondo inhibitor, SBI-477). Enrichment categories are plotted as the −log10 of the adjusted P value (y-axis, −log10 padj), and Odds.Ratio (x-axis). E, F) Volcano plots of RNA-Seq gene expression changes (Log2FoldChange on the x-axis, −Log10 adjusted p value on y-axis) comparing cells treated with vehicle control to cells treated with MondoA inhibitor (SBI-477) for RP cells (D) or RPMax cells (E). Genes that are important in the unfolded protein response are highlighted in blue. G) Plot of expression changes (Log2FoldChange) of RP (y-axis) vs RPMax (x-axis) cells. Genes important for the unfolded protein response are highlighted by yellow-red color. Yellow-red shading depicts the adjusted p value (padj), and higher red intensity indicates greater significance in gene expression change between the two datasets.
Figure 8.
Figure 8.
Diagram showing predicted stages in the development of tumors derived from cells with inactivated MAX (see Discussion).

References

    1. Carroll P. A., Freie B. W., Mathsyaraja H., Eisenman R. N., The MYC transcription factor network: balancing metabolism, proliferation and oncogenesis. Front. Med. 12, 412–425 (2018). - PMC - PubMed
    1. Blackwood E. M., Eisenman R. N., Max: a helix-loop-helix zipper protein that forms a sequence-specific DNA binding complex with Myc. Science 251, 1211–1217 (1991). - PubMed
    1. Amati B., Dalton S., Brooks M. W., Littlewood T. D., Evan G. I., Land H., Transcriptional activation by the human c-Myc oncoprotein in yeast requires interaction with Max. Nature 359, 423–426 (1992). - PubMed
    1. Ayer D. E., Kretzner L., Eisenman R. N., Mad: A heterodimeric partner for Max that antagonizes Myc transcriptional activity. Cell 72, 211–222 (1993). - PubMed
    1. Nair S. K., Burley S. K., X-ray structures of myc-max and mad-max recognizing DNA. Molecular bases of regulation by proto-oncogenic transcription factors. Cell 112, 193–205 (2003). - PubMed

Publication types