[Preprint]. 2024 Sep 27:2024.09.26.613931.
doi: 10.1101/2024.09.26.613931.

Transcripts with high distal heritability mediate genetic effects on complex metabolic traits

Transcripts with high distal heritability mediate genetic effects on complex metabolic traits

Anna L Tyler et al. bioRxiv. .

Update in

Abstract

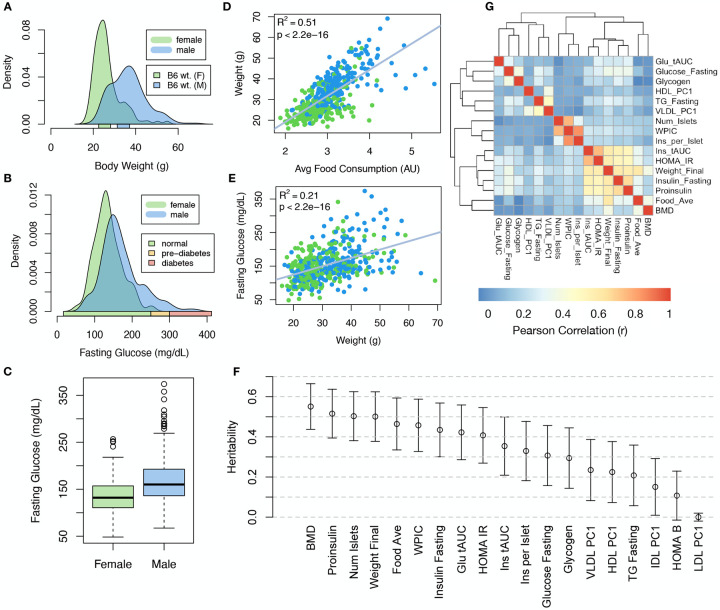
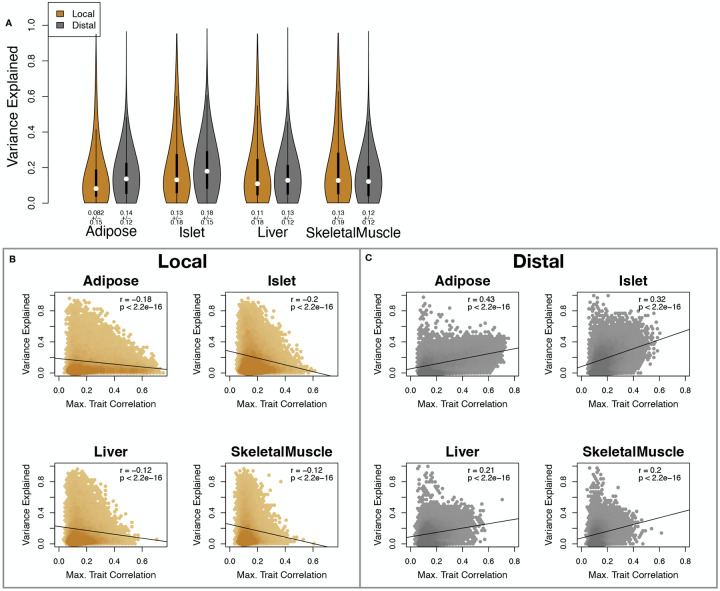
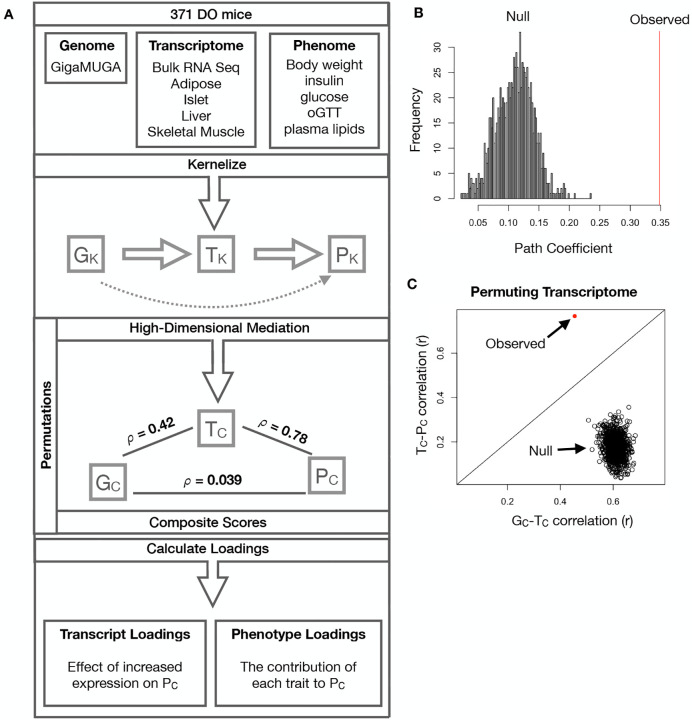
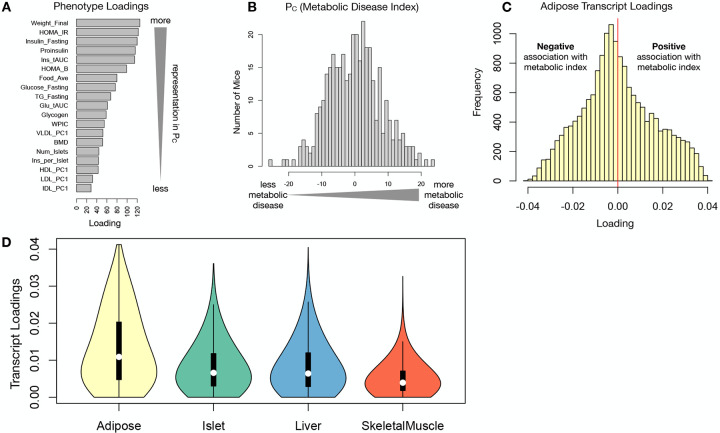
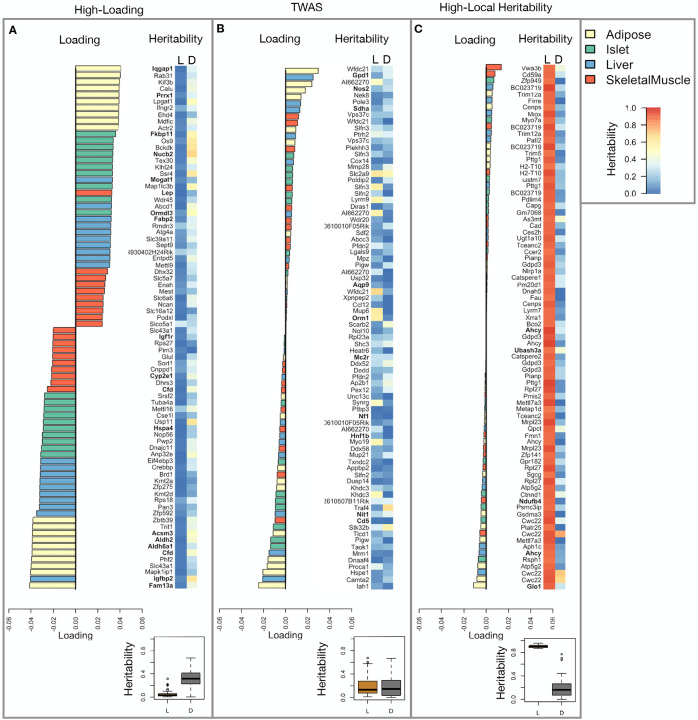
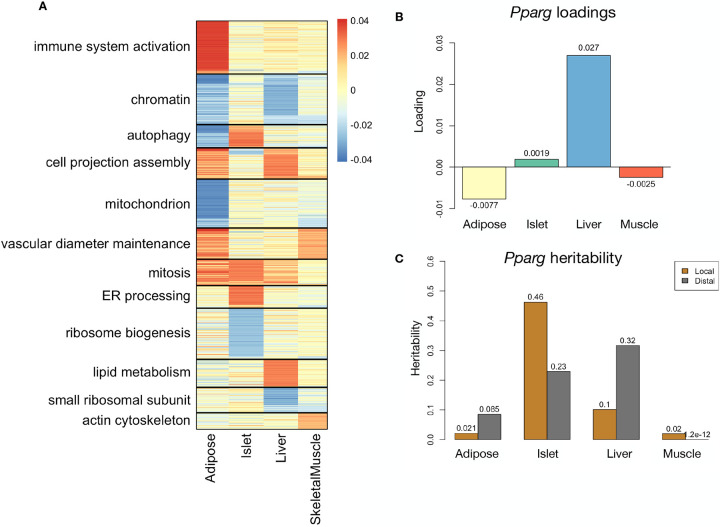
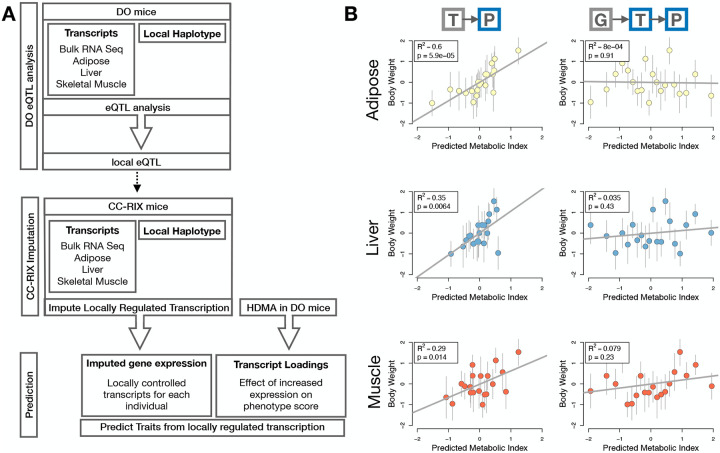
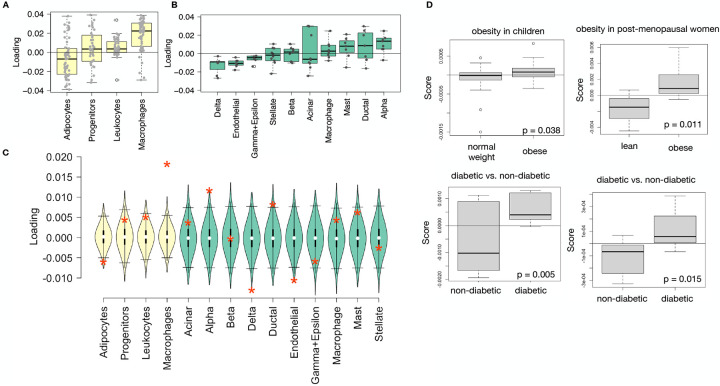
Although many genes are subject to local regulation, recent evidence suggests that complex distal regulation may be more important in mediating phenotypic variability. To assess the role of distal gene regulation in complex traits, we combined multi-tissue transcriptomes with physiological outcomes to model diet-induced obesity and metabolic disease in a population of Diversity Outbred mice. Using a novel high-dimensional mediation analysis, we identified a composite transcriptome signature that summarized genetic effects on gene expression and explained 30% of the variation across all metabolic traits. The signature was heritable, interpretable in biological terms, and predicted obesity status from gene expression in an independently derived mouse cohort and multiple human studies. Transcripts contributing most strongly to this composite mediator frequently had complex, distal regulation distributed throughout the genome. These results suggest that trait-relevant variation in transcription is largely distally regulated, but is nonetheless identifiable, interpretable, and translatable across species.


Figures

Figure 1:
Figure 1:
Clinical overview. A. Distributions of body weight in the diversity outbred mice. Sex is indicated by color. The average B6 male and female adult weights at 24 weeks of age are indicated by blue and green bars on the x-axis. B. The distribution of fasting glucose across the population split by sex. Normal, pre-diabetic, and diabetic fasting glucose levels for mice are shown by colored bars along the x-axis. C. Males had higher fasting blood glucose on average than females. D. The relationship between food consumption and body weight for both sexes. E. Relationship between body weight and fasting glucose for both sexes. F. Heritability estimates for each physiological trait. Bars show standard error of the estimate. G. Correlation structure between pairs of physiological traits. BMD - bone mineral density, WPIC - whole pancreas insulin content, Glu tAUC - glucose total area under the curve, HOMA IR - homeostatic measurement of insulin resistance, HOMA B - homeostatic measure of beta cell health, VLDL - very low-density lipoprotein, LDL - low-density lipoprotein, IDL - intermediate density lipoprotein, HDL - high-density lipoprotein, TG - triglyceride.
Figure 2:
Figure 2:
Transcript heritability and trait relevance. A. Distributions of distal and local heritability of transcripts across the four tissues. Overall local and distal factors contribute equally to transcript heritability. The relationship between (B.) local and (C.) distal heritability and trait relevance across all four tissues. Here trait relevance is defined as the maximum correlation between the transcript and all traits. Local heritability was negatively correlated with trait relevance, and distal heritability is positively correlated with trait relevance. Pearson (r) and p values for each correlation are shown in the upper-right of each panel.
Figure 3:
Figure 3:
High-dimensional mediation. A. Workflow indicating major steps of high-dimensional mediation. The genotype, transcriptome, and phenotype matrices were independently normalized and converted to kernel matrices representing the pairwise relationships between individuals for each data modality (KG = genome kernel, KT = transcriptome kernel; KP = phenome kernel). High-dimensional mediation was applied to these matrices to maximize the direct path GTP, the mediating pathway (arrows), while simultaneously minimizing the direct GP pathway (dotted line). The composite vectors that resulted from high-dimensional mediation were Gc, TC, and PC. The partial correlations ρ between these vectors indicated perfect mediation. Transcript and trait loadings were calculated as described in the methods. B. The null distribution of the path coefficient derived from 10,000 permutations compared to the observed path coefficient (red line). C. The null distribution of the GC-TC correlation vs. the TC-PC correlation compared with the observed value (red dot).
Figure 4:
Figure 4:
Interpretation of loadings. A. Loadings across traits. Body weight and insulin resistance contributed the most to the composite trait. B. Phenotype scores across individuals. Individuals with large positive phenotype scores had higher body weight and insulin resistance than average. Individuals with large negative phenotype scores had lower body weight and insulin resistance than average. C. Distribution of transcript loadings in adipose tissue. For transcripts with large positive loadings, higher expression was associated with higher phenotype scores. For transcripts with large negative loadings, higher expression was associated with lower phenotype scores. D. Distribution of absolute value of transcript loadings across tissues. Transcripts in adipose tissue had the largest loadings indicating that adipose tissue gene expression was a strong mediator of genotype on body weight and insulin resistance.
Figure 5:
Figure 5:
Transcripts with high loadings have high distal heritability and literature support. Each panel has a bar plot showing the loadings of transcripts selected by different criteria. Bar color indicates the tissue of origin. The heat map shows the local (L - left) and distal (D - right) heritability of each transcript. A. Loadings for the 10 transcripts with the largest positive loadings and the 10 transcripts with the largest negative loadings for each tissue. B. Loadings of TWAS candidates with the 10 largest positive correlations with traits and the largest negative correlations with traits across all four tissues. C. The transcripts with the largest local heritability (top 20) across all four tissues.
Figure 6:
Figure 6:
Tissue-specific transcriptional programs were associated with obesity and insulin resistance. A Heat map showing the loadings of all transcripts with loadings greater than 2.5 standard deviations from the mean in any tissue. The heat map was clustered using k medoid clustering. Functional enrichments of each cluster are indicated along the left margin. B Loadings for Pparg in different tissues. C Local and distal of Pparg expression in different tissues.
Figure 7:
Figure 7:
Transcription, but not local genotype, predicts phenotype in the CC-RIX. A. Workflow showing procedure for translating HDMA results to an independent population of mice. B. Relationships between the predicted metabolic disease index (MDI) and measured body weight. The left column shows the predictions using measured transcripts. The right column shows the prediction using transcript levels imputed from local genotype. Gray boxes indicate measured quantities, and blue boxes indicate calculated quantities. The dots in each panel represent individual CC-RIX strains. The gray lines show the standard deviation on body weight for the strain.
Figure 8:
Figure 8:
HDMA results translate to humans. A. Distribution of loadings for cell-type-specific transcripts in adipose tissue. B. Distribution of loadings for cell-type-specific transcripts in pancreatic islets (green). C. Null distributions for the mean loading of randomly selected transcripts in each cell type compared with the observed mean loading of each group of transcripts (red asterisk). D. Predictions of metabolic phenotypes in four adipose transcription data sets downloaded from GEO. In each study the obese/diabetic patients were predicted to have greater metabolic disease than the lean/non-diabetic patients based on the HDMA results from DO mice.

Similar articles

References

    1. Maurano M. T., Humbert R., Rynes E., Thurman R. E., Haugen E., Wang H., Reynolds A. P., Sandstrom R., Qu H., Brody J., Shafer A., Neri F., Lee K., Kutyavin T., Stehling-Sun S., Johnson A. K., Canfield T. K., Giste E., Diegel M., Bates D., Hansen R. S., Neph S., Sabo P. J., Heimfeld S., Raubitschek A., Ziegler S., Cotsapas C., Sotoodehnia N., Glass I., Sunyaev S. R., Kaul R., and Stamatoyannopoulos J. A.. Systematic localization of common disease-associated variation in regulatory DNA. Science, 337(6099):1190–1195, Sep 2012. - PMC - PubMed
    1. Farh K. K., Marson A., Zhu J., Kleinewietfeld M., Housley W. J., Beik S., Shoresh N., Whitton H., Ryan R. J., Shishkin A. A., Hatan M., Carrasco-Alfonso M. J., Mayer D., Luckey C. J., Patsopoulos N. A., De Jager P. L., Kuchroo V. K., Epstein C. B., Daly M. J., Hafler D. A., and Bernstein B. E.. Genetic and epigenetic fine mapping of causal autoimmune disease variants. Nature, 518(7539):337–343, Feb 2015. - PMC - PubMed
    1. Pennisi E.. The Biology of Genomes. Disease risk links to gene regulation. Science, 332(6033):1031, May 2011. - PubMed
    1. Hindorff L. A., Sethupathy P., Junkins H. A., Ramos E. M., Mehta J. P., Collins F. S., and Manolio T. A.. Potential etiologic and functional implications of genome-wide association loci for human diseases and traits. Proc Natl Acad Sci, 106(23):9362–9367, Jun 2009. - PMC - PubMed
    1. Pickrell J. K.. Joint analysis of functional genomic data and genome-wide association studies of 18 human traits. Am J Hum Genet, 94(4):559–573, Apr 2014. - PMC - PubMed

Publication types