[Preprint]. 2024 Sep 26:2024.09.24.614742.
doi: 10.1101/2024.09.24.614742.

Location-biased β-arrestin conformations direct GPCR signaling

Affiliations

Location-biased β-arrestin conformations direct GPCR signaling

Uyen Pham et al. bioRxiv. .

Abstract

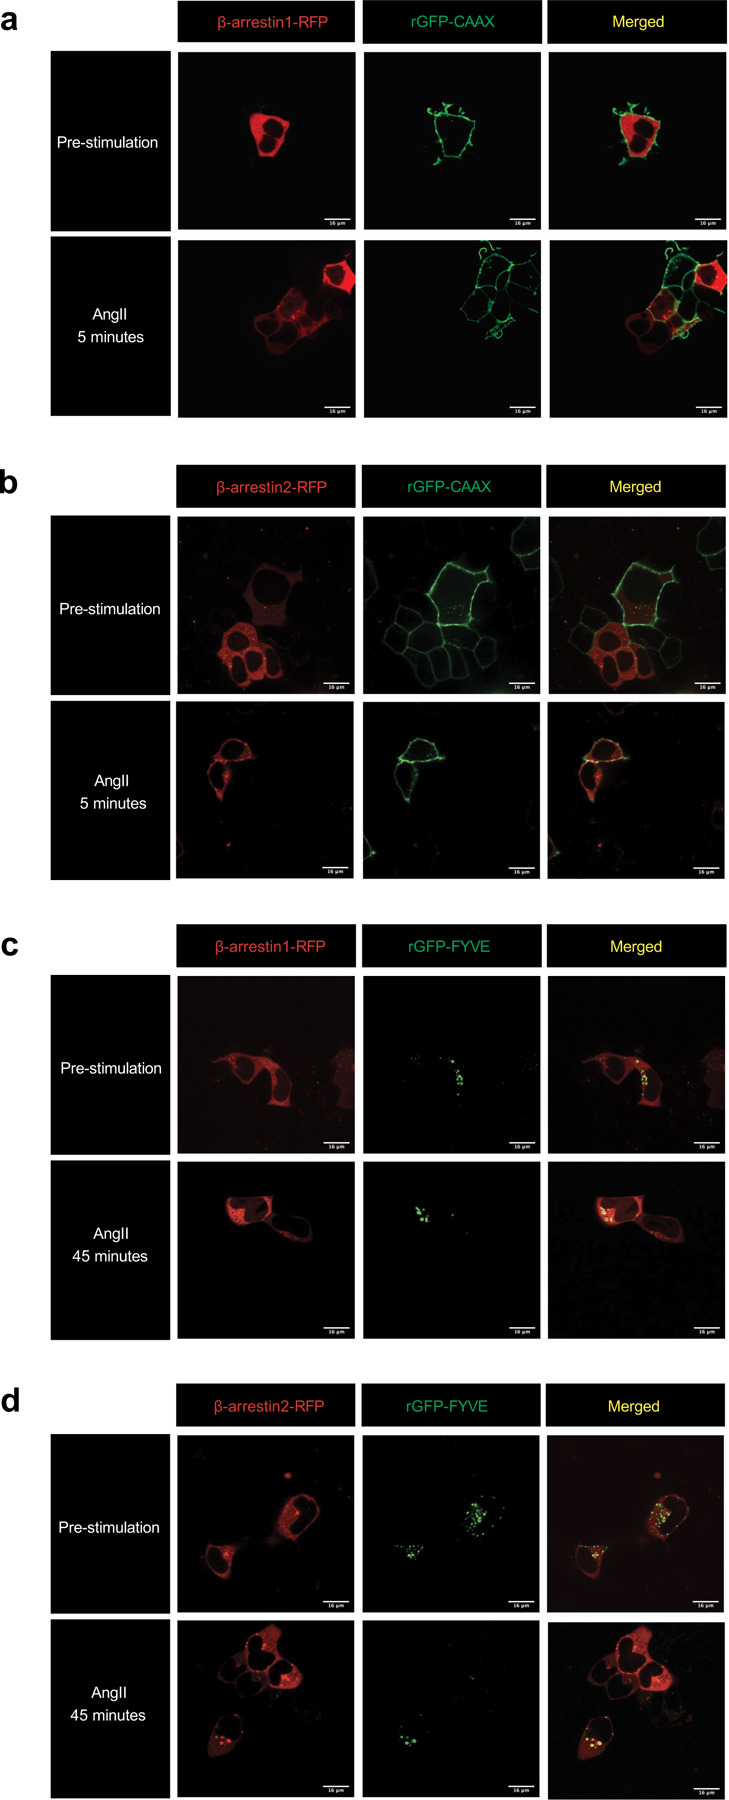
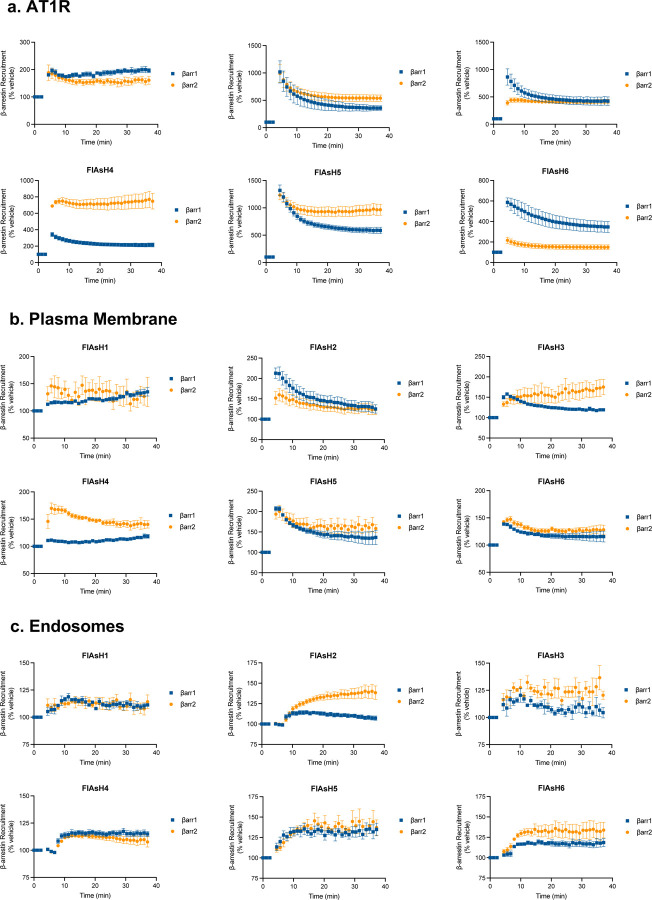
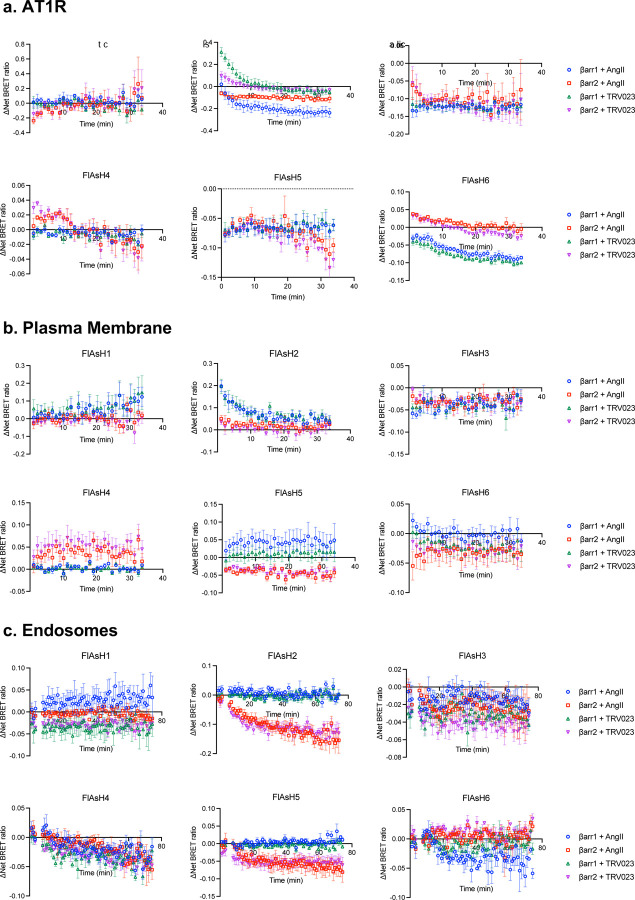
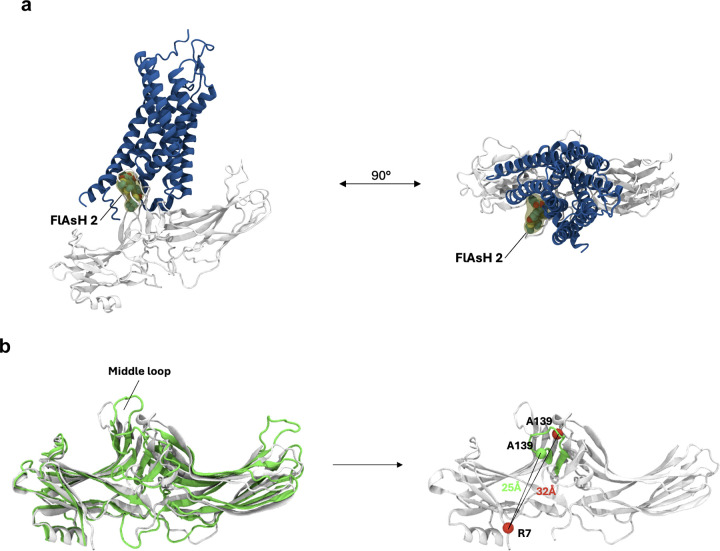
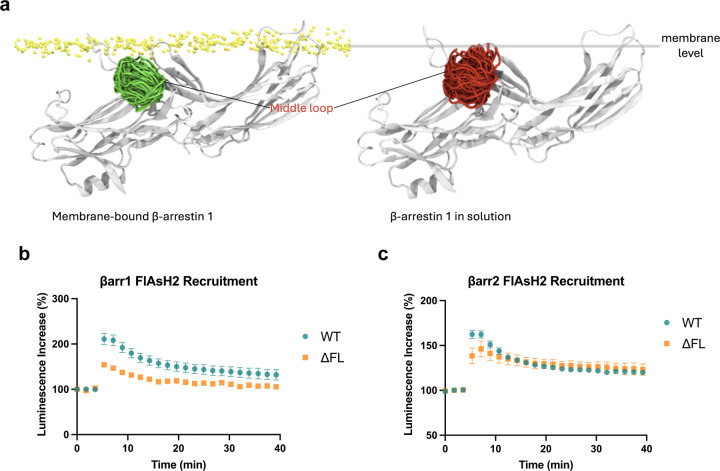
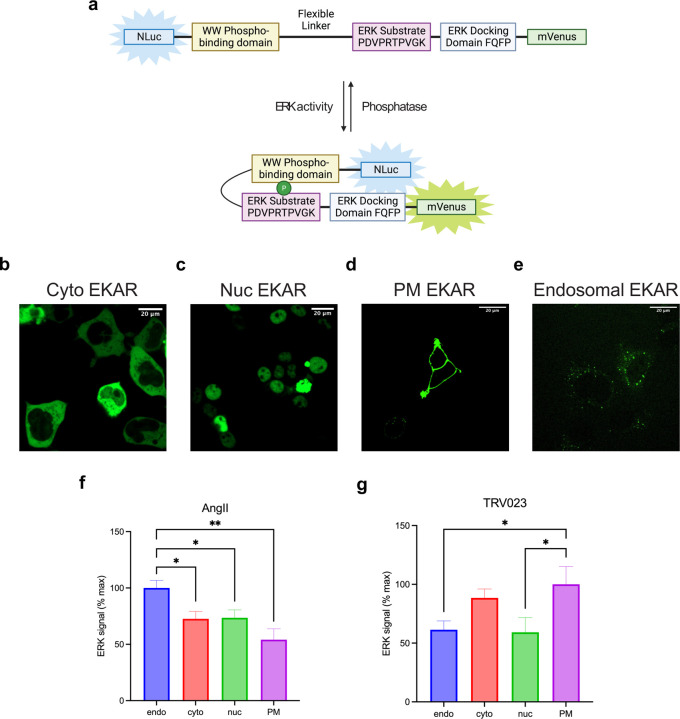
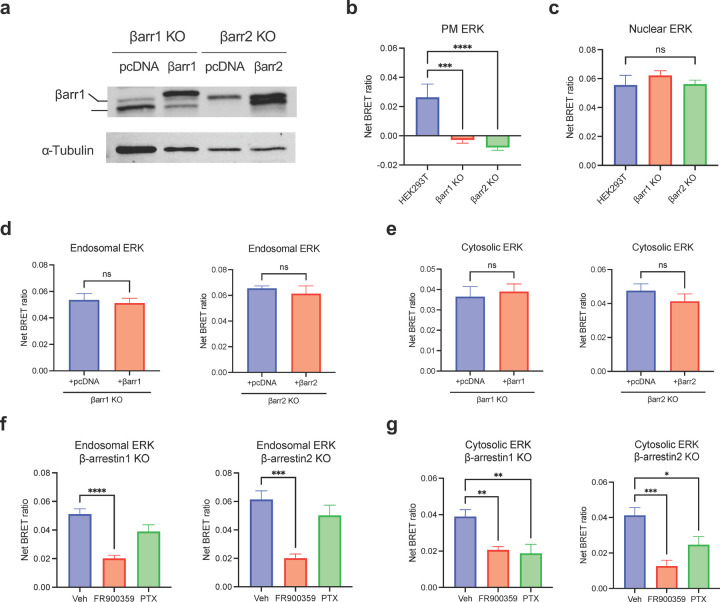
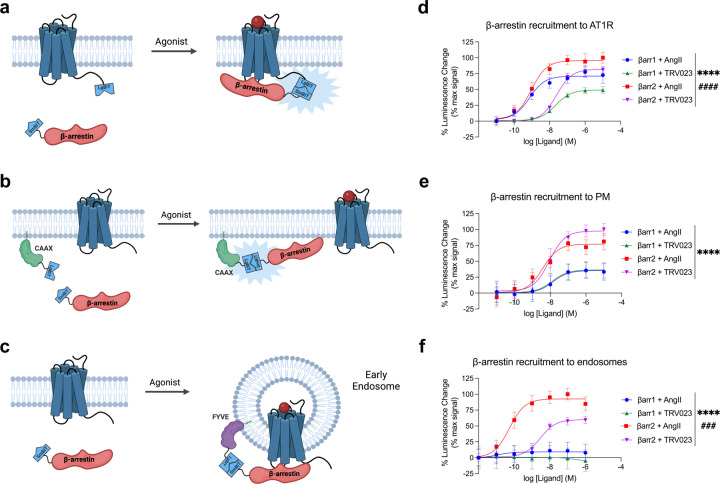
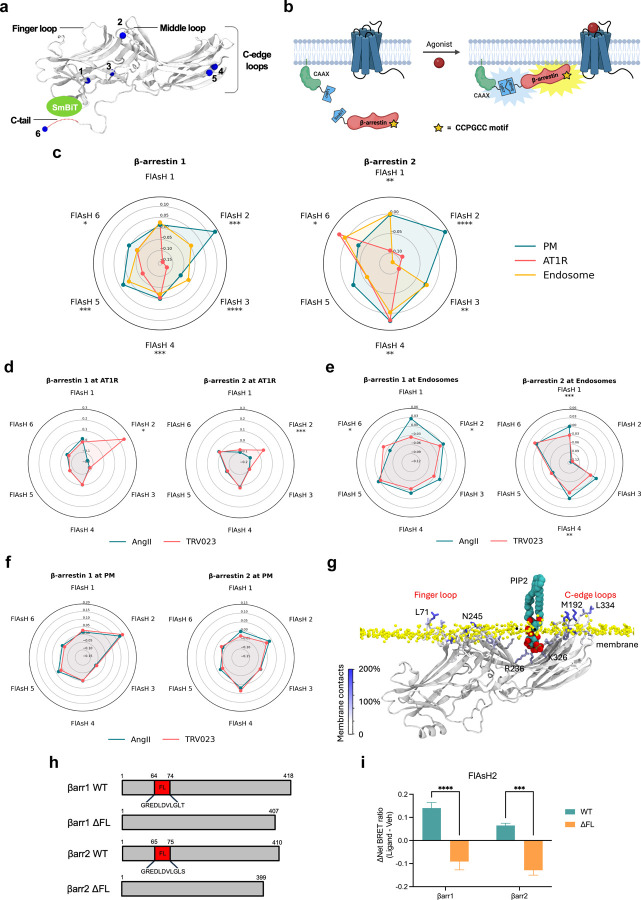
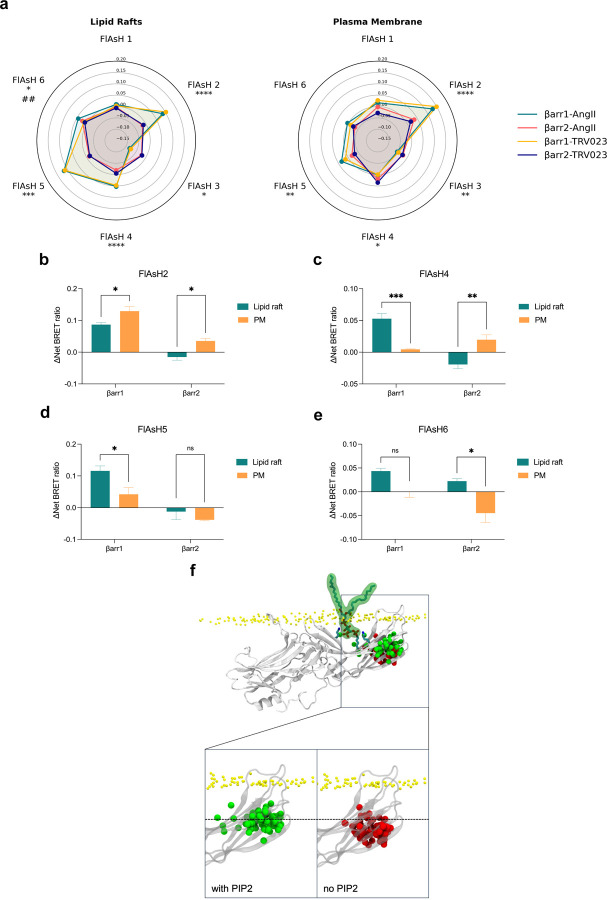
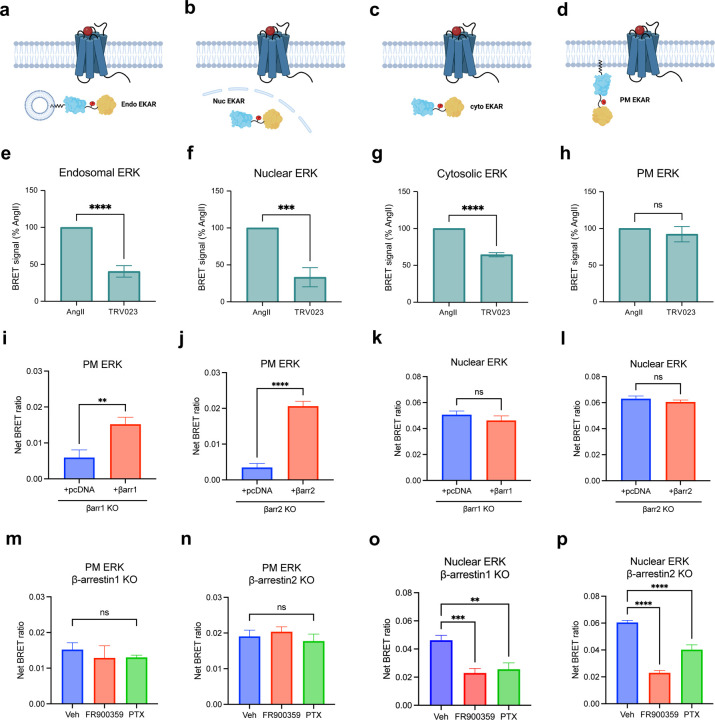
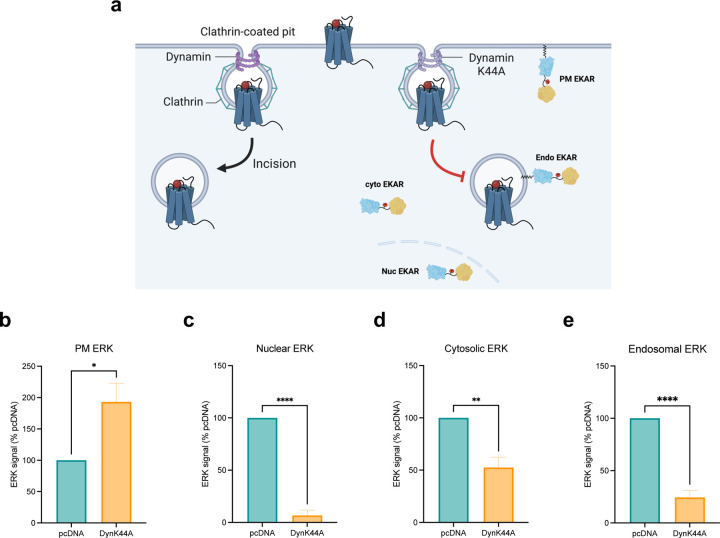
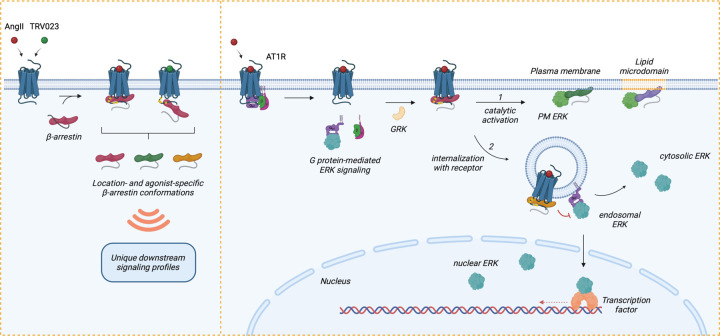
β-arrestins are multifunctional intracellular proteins that regulate the desensitization, internalization and signaling of over 800 different G protein-coupled receptors (GPCRs) and interact with a diverse array of cellular partners1,2. Beyond the plasma membrane, GPCRs can initiate unique signaling cascades from various subcellular locations, a phenomenon known as "location bias"3,4. Here, we investigate how β-arrestins direct location-biased signaling of the angiotensin II type I receptor (AT1R). Using novel bioluminescence resonance energy transfer (BRET) conformational biosensors and extracellular signal-regulated kinase (ERK) activity reporters, we reveal that in response to the endogenous agonist Angiotensin II and the β-arrestin-biased agonist TRV023, β-arrestin 1 and β-arrestin 2 adopt distinct conformations across different subcellular locations, which are intricately linked to differential ERK activation profiles. We also uncover a population of receptor-free catalytically activated β-arrestins in the plasma membrane that exhibits insensitivity to different agonists and promotes ERK activation on the plasma membrane independent of G proteins. These findings deepen our understanding of GPCR signaling complexity and also highlight the nuanced roles of β-arrestins beyond traditional G protein pathways.

Keywords: FlAsH; G protein-coupled receptor; GPCR; MAP kinase; beta-arrestin; biased agonism; biased signaling; biosensors; catalytic activation; conformations; location bias.


Conflict of interest statement

DECLARATION OF INTERESTS The authors declare no competing interests.

Figures

Extended Data Figure 1:
Extended Data Figure 1:. Confocal microscopy images of β-arrestin 1 and β-arrestin 2 trafficking to the plasma membrane and early endosomes.
HEK293T cells transfected with FLAG-AT1R, PM marker rGFP-CAAX, and β-arrestin 1-RFP (a) or β-arrestin 2-RFP (b) pre-stimulation and after 5-minute stimulation of 1 μM AngII. HEK293T cells transfected with FLAG-AT1R, early endosomal targeting peptide rGFP-2xFYVE, and β-arrestin 1-RFP (c) or β-arrestin 2-RFP (d) pre-stimulation and after 45-minute stimulation of 1 μM AngII.
Extended Data Figure 2:
Extended Data Figure 2:. Recruitment of NanoBiT FlAsH biosensors to the AT1R, plasma membrane, and early endosomes.
(a) For recruitment to AT1R, HEK293T cells were transfected with AT1R-LgBiT, one of the six SmBiT-β-arrestin1-FlAsH biosensors or six SmBiT-β-arrestin2-FlAsH biosensors, and stimulated with 1 μM AngII. (b) For recruitment to the PM, HEK293T cells were transfected with FLAG-AT1R, LgBiT-CAAX, and SmBiT-β-arrestin-FlAsH biosensors and stimulated with 1 μM AngII. (c) For recruitment to endosomes, HEK293T cells were transfected with FLAG-AT1R, 2xFYVE-LgBiT, and SmBiT-β-arrestin-FlAsH biosensors and stimulated with 1 μM AngII. The luminescence signal from the complementation of NanoBiT fragments was normalized to pre-stimulation signals and then normalized to vehicle. Data represents mean ± SEM of n independent biological replicates, n=4 for CAAX and AT1R, n=5 for 2xFYVE.
Extended Data Figure 3:
Extended Data Figure 3:. Kinetic tracings of BRET signals from NanoBiT FlAsH assays to detect location-specific β-arrestin conformations.
(a) For β-arrestin conformations at AT1R, HEK293T cells were transfected with AT1R-LgBiT and one of the six SmBiT-β-arrestin1-FlAsH biosensors or six SmBiT-β-arrestin2-FlAsH biosensors. (b) For β-arrestin conformations at the PM, HEK293T cells were transfected with FLAG-AT1R, LgBiT-CAAX, and SmBiT-β-arrestin-FlAsH biosensors. (c) For β-arrestin conformations in endosomes, HEK293T cells were transfected with FLAG-AT1R, 2xFYVE-LgBiT, and SmBiT-β-arrestin-FlAsH biosensors. Cells were then labeled with the arsenic dye FlAsH-EDT2 or HBSS mock label and stimulated with 1 μM AngII or 10 μM TRV023. ΔNet BRET ratio was calculated by subtracting the net BRET values of FlAsH-labeled cells from the mock-labeled condition. Data represents mean ± SEM of n independent biological replicates. For AT1R, FlAsH 1: n=3, FlAsH 2,4: n=4, FlAsH 3, 5, 6: n=5. For CAAX, FlAsH 1–4: n=4, FlAsH 5: n=5, FlAsH 6: n=6. For 2xFYVE, FlAsH 1–5: n=4, FlAsH 6: n=3. Data with TRV023 has the same number of replicates as AngII, except FlAsH 5 (CAAX): n=7 and FlAsH 2 (FYVE): n=5.
Extended Data Figure 4:
Extended Data Figure 4:. Orientation of FlAsH 2 in different configurations of receptor-β-arrestin1 complex.
(a) Spatial orientation of FlAsH 2 in a β-arrestin 1-GPCR core complex. Using the structure of the neurotensin receptor 1 (blue) in complex with β-arrestin 1 (gray) (PDB: 6UP7), we manually modelled the full-length FlAsH 2 into the complex (yellow). Subsequently, the structure was subjected to a short minimization run (0.1 RMS kcal/mol/Å2 gradient, Amber10:EHT forcefield). The resulting structural model suggests that in the GPCR core complex, FlAsH 2 would intercalate into the receptor structure, thus reducing its mobility and resulting in a low BRET ratio. (b) Spatial orientation of FlAsH 2 in a β-arrestin 1-GPCR C-tail complex. Comparison of the structures of the V2Rpp-bound (green, PDB: 4JQI) and inactive (white, PDB: 1G4M) β-arrestin 1. The position of the insertion of FlAsH 2 (A139) within the middle loop is depicted as a sphere (green – 4JQI, red – 1G4M). The distance between FlAsH 2 and the NLuc donor was approximated by plotting the distance between the insertion position and the N-terminally located R7.
Extended Data Figure 5:
Extended Data Figure 5:. Membrane insertion of the finger loop affects the middle loop’s orientation.
(a) MD simulations comparing the orientation of the middle loop of membrane-anchored β-arrestin 1 vs β-arrestin 1 in solution. The flexibility of the middle loop was illustrated using structural snapshots from accumulated frames (one snapshot every 30 ns) for β-arrestin 1 embedded in membrane (green) and β-arrestin 1 in solution (red). (b) Recruitment of FlAsH 2 biosensors for WT β-arrestins and finger loop deletion mutants (ΔFL) to the PM using the NanoBiT assay. Data shown represents mean ± SEM, n=4 independent biological replicates.
Extended Data Figure 6:
Extended Data Figure 6:. EKAR BRET biosensors to assess location-specific ERK1/2 activation in HEK293T cells.
(a) Schematic of BRET-based EKAR biosensors adapted from the previously published FRET versions (b-e) Confocal microscopy images of EKAR biosensor expression in the cytosol, nucleus, PM, and early endosomes. (f-g) Distinct distribution of subcellular pools of ERK signaling promoted by AngII and TRV023. Data was quantified as AUC of BRET signals over 50 minutes after ligand stimulation and normalized to the max signal of each ligand. Data represents mean ± SEM of n independent biological replicates, n=4 for PM and cytosolic ERK, n=5 for nuclear and endosomal ERK. One-way ANOVA with Holm-Šídák’s posthoc test comparing to subcellular location with max signal. *P<0.05; **P<0.005.
Extended Data Figure 7:
Extended Data Figure 7:. EKAR BRET biosensors to assess location-specific ERK1/2 activation in β-arrestin KO HEK293 cells.
(a) Representative western blot of β-arrestin1/2 (A1CT) in β-arrestin 1 KO and β-arrestin 2 KO HEK293 cells with pcDNA control or FLAG-β-arrestin rescue. n=3 independent biological replicates. (b, c) PM and nuclear ERK activity in WT HE293T, β-arrestin 1 KO, and β-arrestin 2 KO cells. Data represents mean ± SEM of n independent biological replicates, n=5 for HEK293T, n=8 for β-arrestin 1 and 2 KO cells. One-way ANOVA with Dunnett’s multiple comparison test to compare β-arrestin KO cells vs HEK293T. ***P<0.0005; ****P<0.0001; ns, not significant. (d, e) Endosomal and cytosolic ERK activity in β-arrestin 1 or β-arrestin 2 KO HEK293 cells upon rescue with pcDNA control or FLAG-β-arrestin 1 or FLAG-β-arrestin 2. Cells were stimulated for 30 minutes with 1 μM AngII. Data represents mean ± SEM, n=7 independent biological replicates. Unpaired two-tailed t-tests comparing pcDNA vs. β-arrestin rescue. ns, not significant. (f, g) Effect of Gq inhibition and Gi inhibition using FR900359 and PTX, respectively, on endosomal and cytosolic ERK signaling in β-arrestin 1 or β-arrestin 2 KO HEK293 cells overexpressing FLAG-βarrestin 1 or FLAG-βarrestin 2. Data represents mean ± SEM, n=7 independent biological replicates. One-way ANOVA with Šídák’s posthoc test comparing inhibitors vs vehicle. *P<0.05; **P<0.005; ***P<0.0005; ****P<0.0001.
Figure 1:
Figure 1:. AngII and TRV023 promote different trafficking patterns of β-arrestins 1 and 2.
(a-c) Schematics of NanoBiT assay monitoring the trafficking of β-arrestin 1 or β-arrestin 2 to the AT1R, PM, and early endosomes. (d-f) Dose response curves of the trafficking of β-arrestin isoforms to the AT1R (d), PM (e), and early endosomes (f). HEK293T cells were stimulated with agonist at the concentrations listed. Data is shown as percent change over vehicle normalized to max signal. Data represents mean ± SEM of n independent biological replicates, n=3 for AT1R and endosomes, n=5 for PM. One-way ANOVA with Tukey’s multiple comparison test to compare the Emax and EC50 values. * denotes the statistically significant differences between the Emax values. # denotes the statistically significant differences between the EC50 values. ****P<0.0001; ###P<0.0005; ####P<0.0001.
Figure 2:
Figure 2:. AT1R agonists promote distinct conformations of β-arrestins 1 and 2 at the receptor and endosomes but not the plasma membrane.
(a) Schematic of NanoBiT FLAsH conformational biosensors. The tetracysteine motif CCPGCC (blue) is inserted after amino acid G39, K138, K170, N223, T261 and G409 for SmBiT-β-arrestin 1 or G40, K139, K171, N225, T263 and G410 for SmBiT-β-arrestin 2 to generate FlAsH 1–6, respectively. (b) Diagram of the NanoBiT FlAsH assay to detect the conformations of β-arrestins 1 and 2 at the receptor, the PM, or early endosomes. (c) Radar plots of the BRET signals from six FlAsH probes represent the location-specific conformations of β-arrestin 1 and β-arrestin 2 following stimulation with 1 μM AngII at the AT1R, PM or endosomes. Data represents mean ± SEM of n independent biological replicates. For AT1R, FlAsH 1: n=3, FlAsH 2,4: n=4, FlAsH 3, 5, 6: n=5. For CAAX, FlAsH 1–4: n=4, FlAsH 5: n=5, FlAsH 6: n=6. For 2xFYVE, FlAsH 1–5: n=4, FlAsH 6: n=3. One-way ANOVA with Tukey’s post hoc test comparing different subcellular locations for a specific FlAsH probe. *P<0.05; **P<0.005; ***P<0.0005; ****P<0.0001. (d, e, f) Radar plots comparing the ligand-specific effects on the conformational profiles of β-arrestins 1 and 2 in different subcellular locations. Cells were stimulated with 1 μM AngII or 10 μM TRV023. Data represents mean ± SEM of n independent biological replicates. Data with TRV023 has the same number of replicates as AngII, except FlAsH 5 (CAAX): n=7 and FlAsH 2 (FYVE): n=5. Unpaired two-tailed t-tests comparing AngII vs. TRV023 for each FlAsH sensor. *P<0.05; **P<0.005; ***P<0.0005; ****P<0.0001. (g) MD simulations of membrane-bound β-arrestin 1 anchored to the lipid bilayer with the finger loop, C-loop, and C-edge loops (3 × 500 ns). Residues have been colored according to the stability of contacts formed with the membrane (the frequency of contacts of each residue with individual membrane components has been calculated and summed in a per-residue fashion; residues with higher values form more stable interactions with the membrane). The position of PIP2 is also highlighted. (h) Diagram of WT β-arrestin 1, WT β-arrestin 2, and their finger loop deletion mutants. The position of the finger loop is highlighted in red. (i) Changes in FlAsH 2 signal of PM-localized β-arrestin 1 and β-arrestin 2 with deletion of the finger loop region. Data represents mean ± SEM, n=4 independent biological replicates. Two-way ANOVA with Šídák’s multiple comparisons comparing WT vs. ΔFL mutants. ***P<0.0005; ****P<0.0001.
Figure 3:
Figure 3:. β-arrestin conformations are dependent on the lipid environment of the plasma membrane.
(a) Radar plots from NanoBiT FlAsH assay demonstrate distinct conformations of β-arrestins 1 and 2 in non-raft membrane and lipid rafts after 2–10 min stimulation of AT1R with 1 μM AngII or 10 μM TRV023. No statistically significant agonist effect was observed in β-arrestin 1 and 2 conformations. Two-way ANOVA with Tukey’s multiple comparison test. * denotes the statistically significant differences between the β-arrestin isoforms. # denotes the statistically significant differences between the AT1R agonists. *P<0.05; **P<0.005; ***P<0.0005; ****P<0.0001; ##P<0.005. (b-e) Comparison of the BRET signals of FlAsH 2, FlAsH 4, FlAsH 5, and FlAsH 6 of β-arrestins 1 and 2 at lipid rafts and PM. Cells were stimulated with AngII. Data represents mean ± SEM, n=3 independent biological replicates for lipid rafts, n values for PM similar to figure 2. Two-way ANOVA with Šídák’s multiple comparison test to compare between PM vs lipid raft for each isoform. *P<0.05; **P<0.005; ***P<0.0005; ns, not significant. (f) MD simulations of β-arrestin 1 anchored to the PM (3 × 500ns) with (green) and without (red) PIP2. The simulation was aligned using membrane atoms. The position of the Cα atom of N223 (FlAsH 4) during the last half of each replicate is depicted in 10 ns intervals.
Figure 4:
Figure 4:. AngII and TRV023 promote distinct ERK signaling profiles at different cellular locations.
(a-d) Diagrams of EKAR BRET biosensors subcellular targeted to the early endosomes, the nucleus, the cytosol, and the PM to measure location-specific ERK activity induced by AT1R ligands. (e-h) Area-under-the-curve (AUC) quantification of endosomal, nuclear, cytosolic, and PM ERK activity during the 50-minute stimulation of 1 μM AngII or 10 μM TRV023. Data was normalized to AngII as max signal and represents mean ± SEM of n independent biological replicates, n=4 for PM and cytosolic ERK, n=5 for nuclear and endosomal ERK. Unpaired Student’s t-tests comparing AngII versus TRV023. ***P<0.0005; ****P<0.0001; ns, not signficant. (i-l) PM and nuclear ERK activity measured in β-arrestin 1 KO or β-arrestin 2 KO HEK293 cells upon rescue with pcDNA control or FLAG-β-arrestin 1 or FLAG-β-arrestin 2. Cells were stimulated with 1 μM AngII for 5 min (PM ERK) or 30 min (nuclear ERK). Data represents mean ± SEM of n independent biological replicates, n=9 for PM ERK, n=7 for nuclear ERK. Unpaired two-tailed t-tests comparing pcDNA vs. β-arrestin rescue. **P<0.005; ****P<0.0001; ns, not significant. (m-p) Effect of Gq inhibition and Gi inhibition using FR900359 and PTX, respectively, on PM and nuclear ERK signaling in β-arrestin 1 KO or β-arrestin 2 KO HEK293 cells overexpressing FLAG-βarrestin 1 or FLAG-βarrestin 2. Cells were stimulated with 1 μM AngII for 5 min (PM ERK) or 30 min (nuclear ERK). Data represents mean ± SEM of n independent biological replicates, n=7 for nuclear EKAR, n=9 for PM ERK with vehicle, n=5 for PM ERK with the inhibitors. One-way ANOVA with Šídák’s posthoc test comparing inhibitors vs vehicle. ***P<0.0005; ****P<0.0001; ns, not significant.
Figure 5:
Figure 5:. Endocytosis is essential for regulating ERK signaling in subcellular locations.
(a) Schematic of EKAR BRET assay with or without endocytosis inhibition. Cells were transfected with FLAG-AT1R, EKAR biosensors, and dynamin K44A to inhibit receptor internalization or pcDNA 3.1 as control. (b-e) AUC quantification of ERK activity in early endosomes, nucleus, cytosol, and PM with endocytosis inhibition. Cells were stimulated with 1 μM AngII for 5 min (PM ERK) or 30 min (nuclear, cytosolic, endosomal ERK). Data was normalized to AngII-stimulated pcDNA condition as 100% and is shown as mean ± SEM of n independent biological replicates, n=4 for PM and cytosolic ERK, n=5 for nuclear and endosomal ERK. Statistical analysis was performed using unpaired two-tailed t-tests to compare pcDNA vs. dynamin K44A. *P<0.05; **P<0.005; ****P<0.0001.
Figure 6:
Figure 6:. Model of regulation of location-biased ERK activation downstream of AT1R.
Upon stimulation with agonists, AT1R activates Gαq and Gαi, resulting in the dissociation of the G protein subunits and promoting endosomal ERK signaling (after receptor internalization mediated by β-arrestins), which can propagate into the cytosol and nucleus. Following G protein activation, GRKs phosphorylate the receptor C-tail, which promotes the recruitment of β-arrestins. Depending on the agonist, β-arrestins can form two main complexes with the receptor: a core conformation induced by AngII and a hanging tail conformation induced by TRV023. Each configuration stabilizes distinct conformational profiles of receptor-bound β-arrestins. Subsequently, β-arrestins either (1) undergo catalytic activation by the receptor, allowing them to translocate across the PM and lipid microdomains independently of the receptor, or (2) co-traffic with the internalized receptor into endosomes. Depending on the membrane lipid environment and subcellular locations, catalytically active β-arrestins and receptor-associated β-arrestins adopt unique conformational signatures that dictate their function, such as regulating the ERK/MAPK signaling pathway. While ERK activity at the PM is mainly promoted by catalytically active β-arrestins, endosomal and nuclear ERK signaling is activated by Gαq and Gαi and can be inhibited by β-arrestins. Receptor endocytosis distributes subcellular pools of ERK signaling from the PM into the endosome, cytosol, and nucleus. In summary, β-arrestin plays critical roles in regulating the intensity, duration, and location bias of AT1R signaling through desensitization, internalization, and catalytic activation initiating its own pattern of ERK signaling, thus modulating the cellular response.

References

    1. Gurevich V. V. & Gurevich E. V. GPCR Signaling Regulation: The Role of GRKs and Arrestins. Front Pharmacol 10, 125 (2019). 10.3389/fphar.2019.00125 - DOI - PMC - PubMed
    1. Smith J. S. & Rajagopal S. The beta-Arrestins: Multifunctional Regulators of G Protein-coupled Receptors. J Biol Chem 291, 8969–8977 (2016). 10.1074/jbc.R115.713313 - DOI - PMC - PubMed
    1. Mohammad Nezhady M. A., Rivera J. C. & Chemtob S. Location Bias as Emerging Paradigm in GPCR Biology and Drug Discovery. iScience 23, 101643 (2020). 10.1016/j.isci.2020.101643 - DOI - PMC - PubMed
    1. Eiger D. S., Hicks C., Gardner J., Pham U. & Rajagopal S. Location bias: A “Hidden Variable” in GPCR pharmacology. Bioessays 45, e2300123 (2023). 10.1002/bies.202300123 - DOI - PMC - PubMed
    1. Lagerstrom M. C. & Schioth H. B. Structural diversity of G protein-coupled receptors and significance for drug discovery. Nat Rev Drug Discov 7, 339–357 (2008). 10.1038/nrd2518 - DOI - PubMed

Publication types

LinkOut - more resources