[Preprint]. 2024 Sep 26:2024.09.24.614821.
doi: 10.1101/2024.09.24.614821.

The formation and propagation of human Robertsonian chromosomes

Affiliations

The formation and propagation of human Robertsonian chromosomes

Leonardo Gomes de Lima et al. bioRxiv. .

Update in

  • The formation and propagation of human Robertsonian chromosomes.
    de Lima LG, Guarracino A, Koren S, Potapova T, McKinney S, Rhie A, Solar SJ, Seidel C, Fagen BL, Walenz BP, Bouffard GG, Brooks SY, Peterson M, Hall K, Crawford J, Young AC, Pickett BD, Garrison E, Phillippy AM, Gerton JL. de Lima LG, et al. Nature. 2025 Sep 24. doi: 10.1038/s41586-025-09540-8. Online ahead of print. Nature. 2025. PMID: 40993387

Abstract

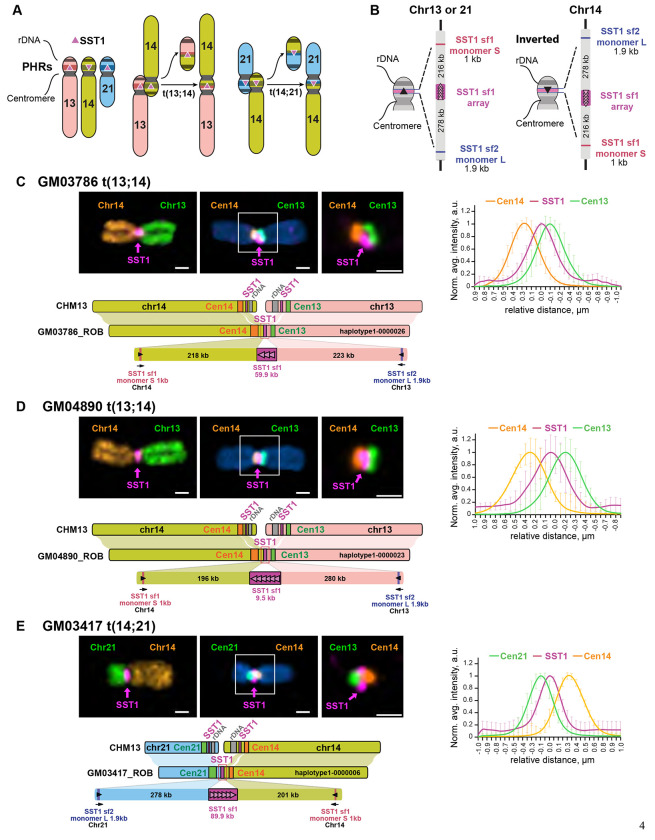
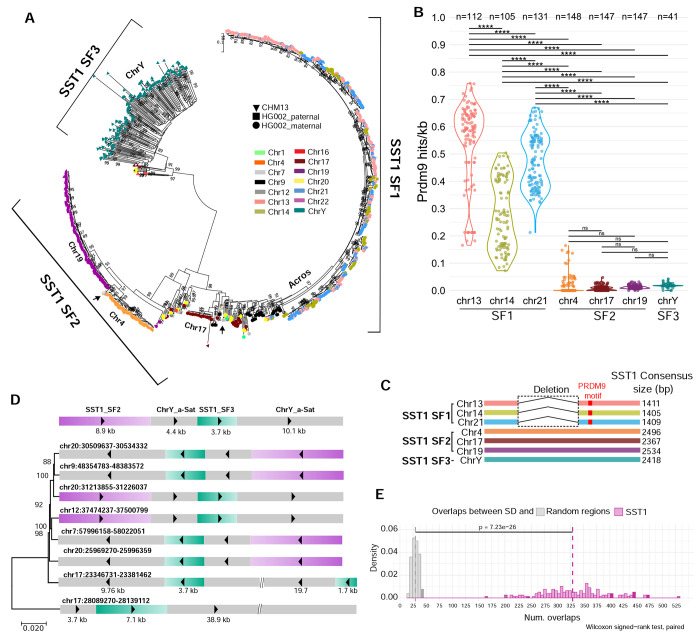
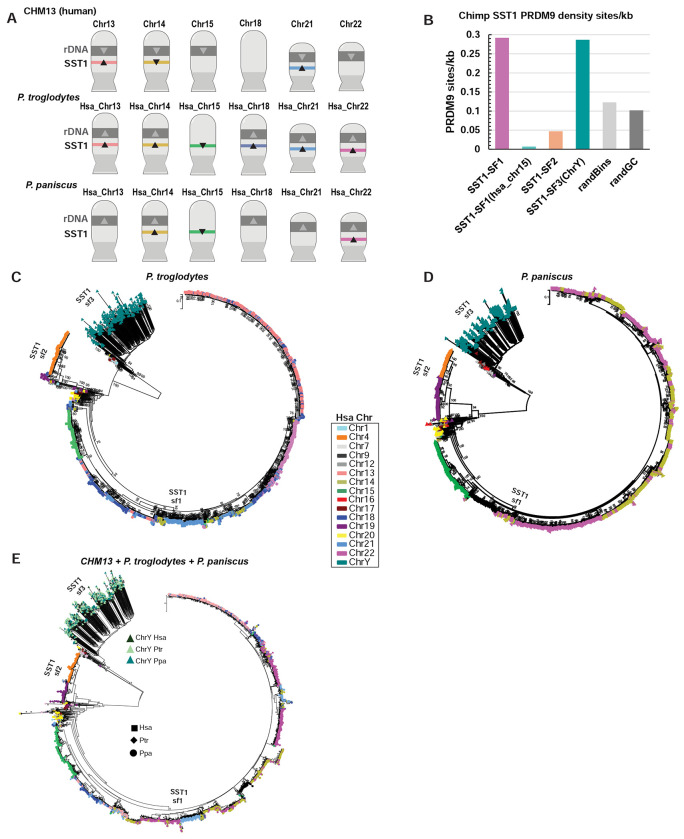
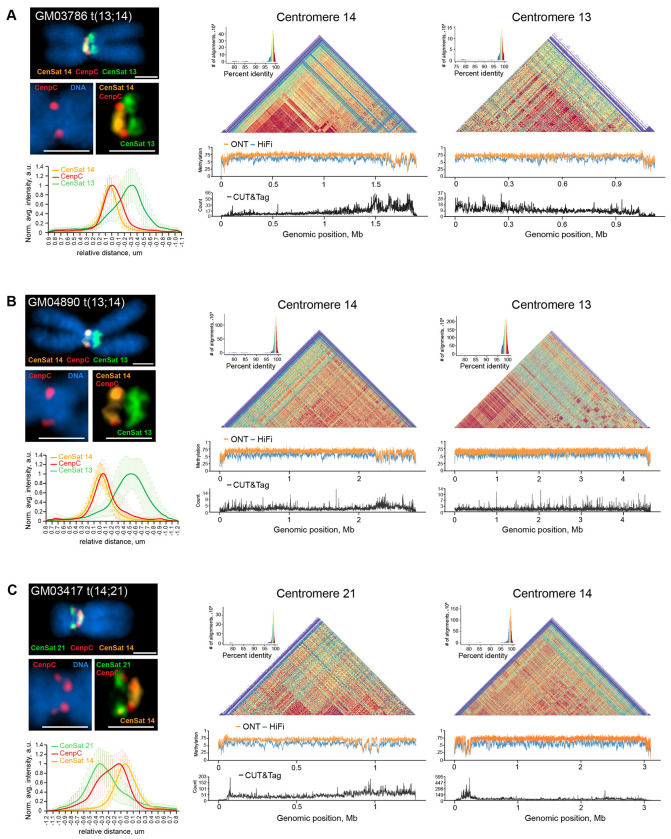
Robertsonian chromosomes are a type of variant chromosome found commonly in nature. Present in one in 800 humans, these chromosomes can underlie infertility, trisomies, and increased cancer incidence. Recognized cytogenetically for more than a century, their origins have remained mysterious. Recent advances in genomics allowed us to assemble three human Robertsonian chromosomes completely. We identify a common breakpoint and epigenetic changes in centromeres that provide insight into the formation and propagation of common Robertsonian translocations. Further investigation of the assembled genomes of chimpanzee and bonobo highlights the structural features of the human genome that uniquely enable the specific crossover event that creates these chromosomes. Resolving the structure and epigenetic features of human Robertsonian chromosomes at a molecular level paves the way to understanding how chromosomal structural variation occurs more generally, and how chromosomes evolve.


Figures

Figure 1.
Figure 1.. Complete assembly of ROBs
A) Working model for ROB formation depending on recombination between SST1 repeats (pink triangles) located in PHRs (colored bands) on the short arms of human chromosomes 13, 14, and 21. The adjacent 45S rDNA arrays, also called NORs, facilitate 3D proximity by co-locating in nucleoli. B) Schematic representation of the main SST1 arrays and flanking sequences in acrocentric chromosomes from CHM13. This region is similar on chromosomes 13 and 21, but inverted on chromosome 14. C-E) Representative images of ROBs from each cell line are shown. The left top panels display chromosomes labeled with an SST1 probe (magenta) and whole chromosome paints as indicated. The middle panels show chromosomes labeled with an SST1 probe (magenta) and centromeric satellite probes for CenSat 14/22 (orange) and CenSat 13/21 (green). DNA was counterstained with DAPI. The magnified inset (right) demonstrates SST1 localization between the two centromere arrays. Scale bar is 1 μm. The plot on the right shows averaged intensity profiles of lines drawn through the centromeres of at least 10 ROBs. Intensity profiles were aligned to the peak of the Gaussian of the SST1 signal and normalized to the maximum intensity of each channel. Error bars denote standard deviations. The lower panels show a synteny plots comparing the assembled ROB to CHM13. The structure of each fused region is shown in detail.
Figure 2.
Figure 2.. Evidence for SST1-mediated interchromosomal exchange in human genomes
A) All SST1 monomers from CHM13 and HG002 were collected and phylogenetic analysis was performed using the maximum likelihood method based on the best-fit substitution model (Kimura 2-parameter +G, parameter = 5.5047) inferred by Jmodeltest2 with 1,000 bootstrap replicates. Bootstrap values higher than 75 are indicated at the base of each node. The color indicates the source chromosome and the shape indicates the source genome. Three major subfamilies were identified: 1) subfamily 1, primarily on the acrocentrics, 2) subfamily 2, primarily on the remaining autosomes, and 3) subfamily 3, primarily on the Y chromosome. Black arrows indicate the location on the phylogenetic trees of sf2 monomers S and L from the acrocentric chromosomes (Figure 1B). B) Predicted PRDM9 DNA binding site frequency (mean sites/kb, each dot indicates 1 haplotype) in SST1 arrays in multiple haploid genomes (indicated by n), plotted by chromosome. ANOVA analysis with the Tukey-Kramer test for pairwise mean comparisons was used. **** indicates p<0.0001 and ns indicates not significant. C) Schematic representation of the three subfamilies of SST1. SST1 sf1 has a central gap and a predicted PRDM9 DNA binding site (red box). D) A segmental duplication of 27 kb or larger was identified on several autosomes in CHM13 that includes Y-like alpha-satellite DNA and Y-like SST1. Phylogenetic analysis was performed using the maximum likelihood method and GTR+Gamma substitution parameters. Bootstrap values are shown. E) Comparison of overlaps between segmental duplications (SD) and random regions (gray) or SST1 monomers (pink) across 147 genomes. Distributions show the number of overlaps (x-axis) versus density (y-axis). A permutation test with 10000 iterations per genome was used to generate random region overlaps. The significant difference between distributions (p value = 7.23e-26, Wilcoxon signed-rank test, paired) indicates non-random association between SD and SST1 regions.
Figure 3.
Figure 3.. Evidence for exchange of SST1 on NOR-bearing chromosomes in chimpanzee and bonobo genomes
A) Ideograms of all the NOR-bearing chromosomes in human, chimpanzee, and bonobo, annotated with the human numbering system. The directionality of 45S rRNA gene arrays (grey) and SST1 arrays (colored bars) are indicated with arrowheads. B) Predicted PRDM9 binding sites were identified in the chimpanzee genome, and the number of sites per kb is plotted for SST1 arrays for the subfamily indicated. Random regions of the genome (randBins, randGC which was GC matched) were used to determine background. C) All SST1 monomers from the chimpanzee genome were subjected to phylogenetic analysis using the maximum likelihood method. The color indicates the source chromosome. Notably, the SST1 monomers from chromosomes 13, 14, 18, 21, and 22 form a single branch, indicating a high degree of similarity. D) All SST1 monomers from the bonobo genome were subjected to phylogenetic analysis using the maximum likelihood method. Notably, the SST1 monomers from chromosomes 14 and 22 form a single branch, indicating a high degree of similarity. E) SST1 monomers from human, chimpanzee and bonobo were subjected to phylogenetic analysis using the maximum likelihood method. The three subfamilies are apparent.
Figure 4.
Figure 4.. Centromere activity in dicentric ROBs
ImmunoFISH, DNA methylation, and CENP-A CUT&Tag analyses were performed for (A) GM03486, (B) GM04890 and (C) GM03417. The left panels show representative structured illumination super-resolution images of ROBs labeled by immuno-FISH with centromeric satellite probes for CenSat 14/22 (orange), CenSat 13/21 (green), and anti-CENP-C antibody (red). DNA was counterstained with DAPI. Magnified insets depict single CENP-C foci on centromere 14 in GM03786 and GM04890, and double CENP-C foci on centromeres 21 and 14 in GM03417. Scale bar is 1 μm. Plots below show averaged intensity profiles of lines drawn through the centromeric regions of sister chromatids of at least 10 ROBs. Intensity profiles were aligned to the peak of the Gaussian of the CenSat 14 signal and normalized to the maximum intensity of each channel. Error bars denote standard deviations. The right panels display corresponding heatmaps of sequence similarity calculated for 5 kb bins for each centromere. Below the heatmaps, DNA methylation tracks show methylation calls from ONT (orange) or PacBio HiFi (blue) sequencing, with hypomethylated regions suggesting active centromere localization. Active centromere regions are confirmed by CENP-A peaks on CUT&Tag tracks below (black).

References

    1. Robertson. Chromosome studies. I. Taxonomic relationships shown in the chromosomes of Tettigidae and Acrididae: V-shaped chromosomes and their significant in Acridia, Locustidae, and Gryllidae: Chromosomes and variation. J Morphology 27, 179–331 (1916).
    1. Schubert I., Schriever-Schwemmer G., Werner T. & Adler I. D. Telomeric signals in robertsonian fusion and fission chromosomes: implications for the origin of pseudoaneuploidy. Cytogenetics and cell genetics 59, 6–9 (1992). - PubMed
    1. Glugoski L., Deon G. A., Nogaroto V., Moreira-Filho O. & Vicari M. R. Robertsonian fusion site in Rineloricaria pentamaculata (Siluriformes: Loricariidae): involvement of 5S rDNA and satellite sequences. Cytogenetic and genome research (2023). - PubMed
    1. Holeckova B. et al. Chromosomal Aberrations in Cattle. Genes 12 (2021). - PMC - PubMed
    1. Lukhtanov V. A. et al. Reinforcement of pre-zygotic isolation and karyotype evolution in Agrodiaetus butterflies. Nature 436, 385–389 (2005). - PubMed

Publication types

LinkOut - more resources