[Preprint]. 2024 Sep 26:2024.09.25.615004.
doi: 10.1101/2024.09.25.615004.

Genomic mosaicism reveals developmental organization of trunk neural crest-derived ganglia

Affiliations

Genomic mosaicism reveals developmental organization of trunk neural crest-derived ganglia

Keng Ioi Vong et al. bioRxiv. .

Abstract

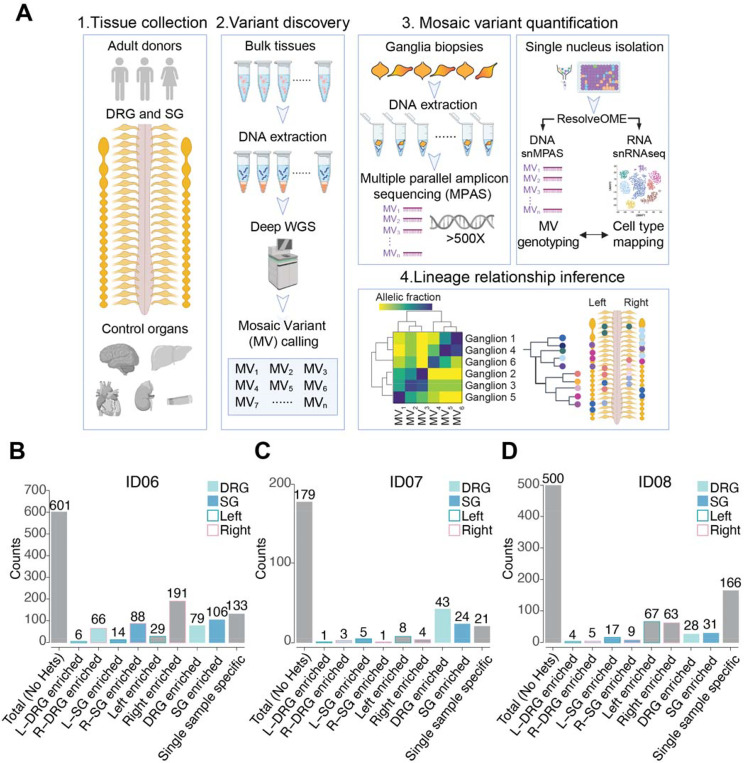
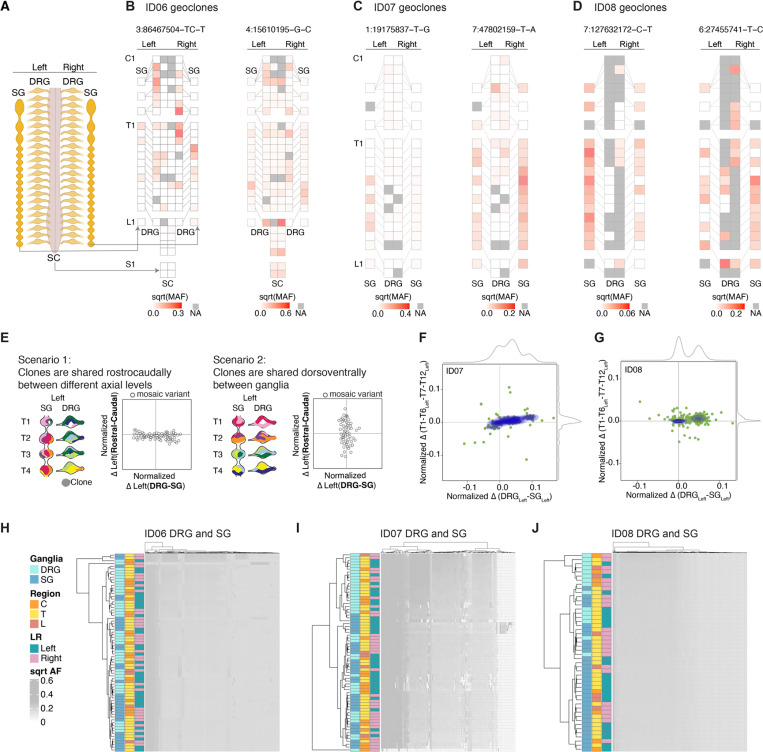
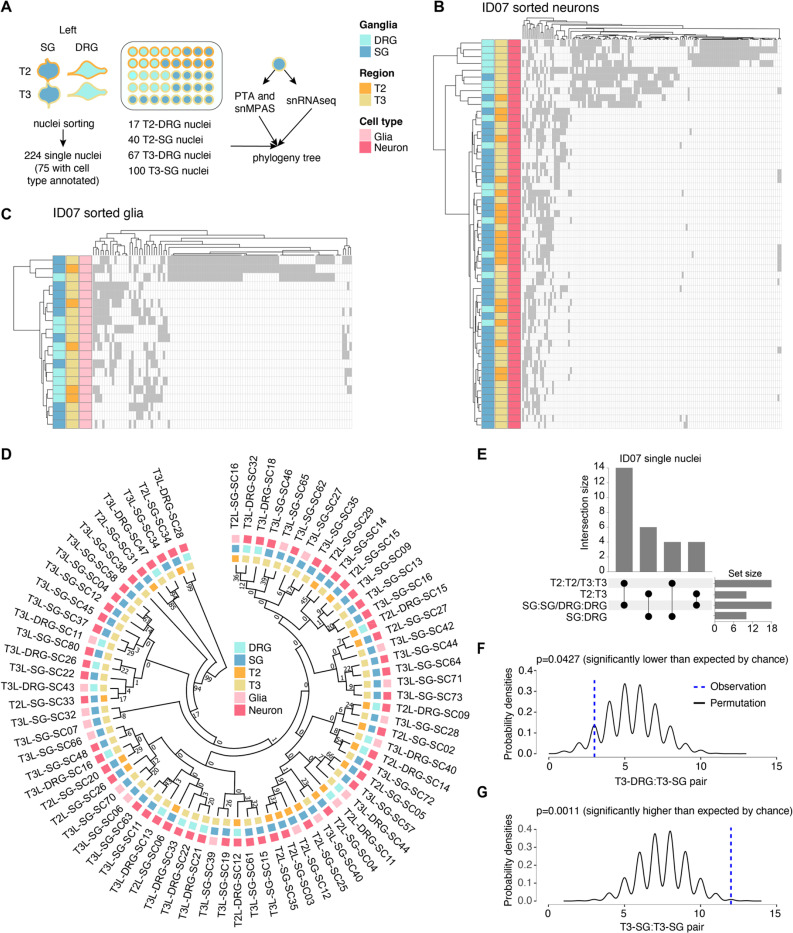
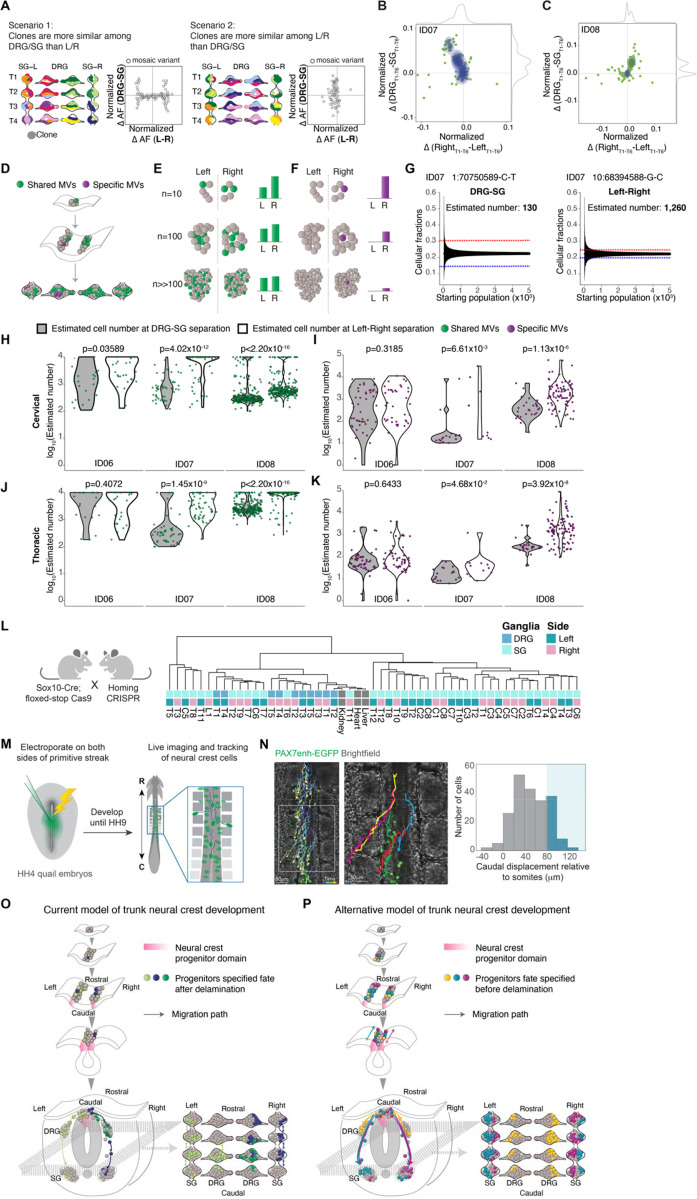
The neural crest generates numerous cell types, but conflicting results leave developmental origins unresolved. Here using somatic mosaic variants as cellular barcodes, we infer embryonic clonal dynamics of trunk neural crest, focusing on the sensory and sympathetic ganglia. From three independent adult neurotypical human donors, we identified 1,278 mosaic variants using deep whole-genome sequencing, then profiled allelic fractions in 187 anatomically dissected ganglia. We found a massive rostrocaudal spread of progenitor clones specific to sensory or sympathetic ganglia, which unlike in the brain, showed robust bilateral distributions. Computational modeling suggested neural crest progenitor fate specification preceded delamination from neural tube. Single-cell multiomic analysis suggested both neurons and glia contributed to the rostrocaudal clonal organization. CRISPR barcoding in mice and live imaging in quail embryos confirmed these clonal dynamics across multiple somite levels. Our findings reveal an evolutionarily conserved clonal spread of cells populating peripheral neural ganglia.

Keywords: cell migration; dorsal root ganglia; lineage tracing; live imaging; neural crest; somatic mosaicism; sympathetic ganglia.


Figures

Figure 1.
Figure 1.
Identification of 1280 bona fide somatic mosaic variants in human DRG and SG from 3 neurotypical control donors. (A) Strategy to deconvolve lineage of sensory (DRG) and sympathetic ganglia (SG): (1) Tissue collection: DRG and SG dissected from 2 male and 1 female donors. Other major organs were also collected to infer clonal relationship; (2) Variant discovery: 300x and 30x whole-genome sequencing (WGS) of bulk peripheral organs and ganglia biopsies respectively, followed by best-practice mosaic variant (MV) calling pipelines, identified candidate MVs. (3) Candidate MVs quantified in dissected tissues or single nuclei isolated from individual ganglia by multiple parallel amplicon sequencing (MPAS) or single-nucleus MPAS (snMPAS) respectively. (4) Lineage tree inference: Variant allelic fractions of validated MVs in individual ganglia analyzed and anatomically mapped. Lineage relationships of ganglia deconvolved by computing clonal similarities between samples and statistical modeling of clonal dynamics. DRG, dorsal root ganglia; SG, sympathetic ganglia. (B-D) Mosaic variant counts identified from donors ID06 (B), ID07 (C), and ID08 (D), classified by tissue and anatomical distribution. Variant detected 1.5x more frequent in a group is defined as enriched. See STAR methods for mathematical quantification. Heterozygous variants (Hets) were excluded. L, left; R, right.
Figure 2.
Figure 2.
DRGs or SGs share similar lineage relationships along the rostrocaudal axis but are clonally independent. (A-D) Geographical maps of individual MV allelic fractions (AFs) (i.e. ‘geoclones’). Example geoclones in ID06 (B), ID07 (C), and ID08 (D) based upon hg38 reference genomic coordinate (at top). Colors: square root transformed mutant AFs (sqrt-MAF). NA: tissue not available. (E) Models and contour plots of possible scenarios whereby MVs are shared between ganglia along the rostrocaudal axis but restricted dorsoventrally (scenario 1, left) or shared the dorsoventral axis while restricted rostrocaudally (scenario 2, right). Axes: normalized AF difference between rostral and caudal against that between DRG and SG. In scenario 1, most MVs deviate from the center along the x-axis but cluster at the center of the y-axis because of MVs are shared among rostral and caudal levels. In scenario 2, most MVs cluster around the center at the x-axis but not the y-axis since clones are more frequently shared dorsoventrally between DRG and SG, but not between different levels. Clones with genomic similarity are colored similarly. (F-G) MV contour plots observed from ID07 (F) and ID08 (G) thoracic levels with the normalized difference in AFs between rostral (defined as T1-T6 levels) and caudal (defined as T7-T12 levels) (y-axis) plotted against the normalized difference between the DRG and SG (x-axis). Green dots: individual MVs. Blue contours: kernel density estimation of MV distributions. Grey curves: kernel density estimation along the respective axes. Only data for the left-sided ganglia are included in the plots. (H-J) Hierarchical clustering heatmap with Manhattan distances using AFs of MVs from ID06 (H), ID07 (I), or ID08 (J). Note that DRGs and SGs predominantly clustered separately, whereas the left and right tend to intermix together, suggesting the lineage relationship between ganglia is not driven by their anatomical position but rather by their identity (DRG or SG). C: cervical, T: thoracic, L: lumbar.
Figure 3.
Figure 3.
Concurrent single-nucleus MV genotyping with transcriptome analysis confirms the rostrocaudal clonal organization. (A) Strategy for deconvolving the phylogenetic relationship of ganglia at single-cell resolution using ResolveOME (i.e. concurrent DNA amplification by primary template-directed amplification (PTA) and RNA profiling from the same nucleus). MVs genotyped by single-nucleus massive parallel amplicon sequencing (snMPAS) in 224 nuclei isolated from both the DRG and SG at T2 and T3 levels of donor ID07. Of these, cell type was inferred in 75 nuclei by snRNAseq. (B-C) Hierarchical clustering with Manhattan distances from a total of 55 neurons (B) and 20 glia (C) from the DRG and SG at T2 and T3 levels of ID07. Note that DRGs and SGs predominantly clustered separately at both levels, suggesting the lineage relationship between ganglia is not driven by spinal level but rather by identity (DRG or SG). (D) Phylogenic tree following 1,000 bootstrap replications based on the 184 MVs in 75 single nuclei with cell type information. Numbers at branches of the tree: bootstrap values supporting each edge. (E) Upset plot showing number of terminal branches shared between type of ganglia (SG:SG, DRG:DRG or SG:DRG) and axial levels (T2:T2, T3:T3 or T2:T3). (F-G) Number of terminal branches observed in the phylogeny tree in (D) (blue dashed line, observation) and distribution expected after 10,000 permutations (black line: permutation) for T3-DRG:T3-SG pair (p=0.0427, permutation test) (F) and T3-SG:T3-SG pair (p=0.0011, permutation test) (G).
Figure 4.
Figure 4.
Evolutionarily conserved clonal dynamics and timing of neural crest fate specification. (A) Modeling two possible scenarios whereby clones are more similar among DRG/SG than Left/Right (scenario 1, left) or the opposite case (scenario 2, right). Schematic contour plots showing normalized difference in the allelic fraction (AF) of each MV between the DRG and SG (y-axis) against that between left and right (x-axis). (B-C) Contour plots showing the normalized AF difference of each MV observed from ID07 (B) and ID08 (C) between DRG and SG (y-axis) and between left and right (x-axis). Green dots: individual MVs. Blue contour: 2D Kernel density MV estimation plots highlighted. Grey curves: kernel density estimation along the x- or y-axis. Most MVs spread along the y-axis, indicating a larger difference in AF between DRG and SG, while showing minimal left-right lateral difference. (D-F) Schematics for effect of founder population size MV AFs. Green: MVs acquired during early embryogenesis before left-right split. Green variants therefore are shared in ganglia of both left and right but with varying AFs, whereas purple MVs are acquired only after the left-right split, thus distributed on one side exclusively. (E) AFs for green variant quantified under three hypothetical founder population cell numbers: n=10, n=100, or n>>100 shown. Larger hypothetical founder population size correlated with smaller AF difference between left and right. (F) For the purple lateralized variant, smaller number of cells immediately after left-right lateralization correlated with higher AFs. (G) Estimation of the effective population size by the observed difference in AF as in (D-F). Representative variants from ID07 for calculating the cell number prior to DRG-SG split (left panel) and prior to left-right split (right panel). Blue and red dashed lines: difference in average AF for the individual variant between DRG and SG (left panel) or between left and right (right panel). Black lines: 95% bands of hypergeometric distribution from each simulated starting population size. (H-K) Violin plots comparing estimated maximum number of founder population size at DRG-SG specification and left-right lateralization in cervical regions (H) or thoracic regions (J). Green dots: MVs distributed bilaterally; Violin plots comparing the estimated minimum size of the founder population at DRG-SG specification and left-right lateralization in cervical (I) or thoracic regions (K). Purple dots: MVs restricted to one side. The predicted population size at DRG-SG specification is significantly smaller than at left-right split when estimated from either class of MV. P-values: two-tailed Mann-Whitney U tests. (L) Mouse breeding scheme for generating the neural crest-specific CRISPR barcoding mouse model. Migratory neural crest-specific Sox10-Cre driven Cas9 activity for in vivo barcode editing. Representative lineage tree dendrogram for the edited barcodes from 1-month-old mice. Bulk organs (liver, kidney, and heart) with limited NC contribution (n=2 independent mice). (M) Experimental design for real-time ex ovo imaging of NC progenitor migration in quail embryos. (N) Representative tracks showing migration paths of NC cells expressing H2B-Citrine under control of Pax7 enhancer. Histogram showing the rostrocaudal migration distance of 212 cells tracked (n=6 embryos). Blue shading indicates cells migrating caudally by more than 1 somite (mean somite length 81 ± 1 μm, n=92 somites from 6 embryos). Right panel: magnification of boxed region from left panel. Brackets: somites. Scale bar: 50μm. (O-P) Trunk NC development current model (O) and the alternative model observed from this study (P). The current model has little in the way of rostrocaudal cell movement prior to NT closure, and that individual clones populate both DRG and SG (depicted by green or purple cells in both types of ganglia, mostly restricted to one side). The alternative model includes rostrocaudal cell movement prior to NT closure, and that individual clones populate either DRG or SG bilaterally but infrequently populate both DRG and SG (depicted by yellow cells in DRGs on both left and right, and both turquoise and violet cells in SGs on both left and right).

References

    1. Achilleos A., and Trainor P.A. (2012). Neural crest stem cells: discovery, properties and potential for therapy. Cell Res 22, 288–304. 10.1038/cr.2012.11. - DOI - PMC - PubMed
    1. Le Douarin N.M., and Dupin E. (2018). The “beginnings” of the neural crest. Dev Biol 444 Suppl 1, S3–S13. 10.1016/j.ydbio.2018.07.019. - DOI - PubMed
    1. Weston J.A. (1963). A radioautographic analysis of the migration and localization of trunk neural crest cells in the chick. Dev Biol 6, 279–310. 10.1016/0012-1606(63)90016-2. - DOI - PubMed
    1. Noden D.M. (1975). An analysis of migratory behavior of avian cephalic neural crest cells. Dev Biol 42, 106–130. 10.1016/0012-1606(75)90318-8. - DOI - PubMed
    1. Serbedzija G.N., Bronner-Fraser M., and Fraser S.E. (1989). A vital dye analysis of the timing and pathways of avian trunk neural crest cell migration. Development 106, 809–816. 10.1242/dev.106.4.809. - DOI - PubMed

Publication types

LinkOut - more resources