[Preprint]. 2024 Sep 23:2024.09.23.614260.
doi: 10.1101/2024.09.23.614260.

TNFSF13 insufficiency disrupts human colonic epithelial cell-mediated B cell differentiation

Affiliations

TNFSF13 insufficiency disrupts human colonic epithelial cell-mediated B cell differentiation

Xianghui Ma et al. bioRxiv. .

Abstract

Cytokines mediating epithelial and immune cell interactions modulate mucosal healing- a process that goes awry with chronic inflammation as in inflammatory bowel disease. TNFSF13 is a cytokine important for B cell maturation and function, but roles for epithelial TNFSF13 and putative contribution to inflammatory bowel disease are poorly understood. We evaluated functional consequences of a novel monoallelic TNFSF13 variant using biopsies, tissue-derived colonoids and induced pluripotent stem cell (iPSC)-derived colon organoids. TNFSF13 variant colonoids exhibited a >50% reduction in secreted TNFSF13, increased epithelial proliferation, and reduced apoptosis, which was confirmed in iPSC-derived colon organoids. Single cell RNA-sequencing, flow cytometry, and co-immunoprecipitation identified FAS as the predominant colonic epithelial receptor for TNFSF13. Imaging mass cytometry revealed an increase in epithelial-associated B cells in TNFSF13 variant colon tissue sections. Finally, TNFSF13 variant colonoids co-cultured with memory B cells demonstrated a reduction in the production of IgA+ plasma cells compared to control colonoid co-cultures. Our findings support a role for epithelial TNFSF13 as a regulator of colonic epithelial growth and epithelial crosstalk with B cells.


Conflict of interest statement

CONFLICTS OF INTEREST The authors disclose no conflicts.

Figures
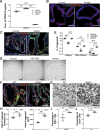
Figure 1.
Figure 1.. TNFSF13 variant colonoids/organoids exhibit enhanced colonoid formation efficiency and proliferation.
(A) ELISA for secreted TNFSF13 in colonoid culture conditioned media (n=3 lines of colonoids from 3 different patients for Control and VEO-IBD, n=3 passages/batches of colonoids for Variant). (B-C) Representative immunostaining images for TNFSF13 RNAscope probe in colonoids (B) and co-staining of TNFSF13 and FAS RNAscope probes with Ki67 antibody in colon biopsies from control and variant subjects (C). Arrowheads denote accumulated cells outside of epithelial crypts. Scale bar: 50 μm (B) and 100 μm (C). n=3 lines of colonoids from 3 different patients for Control, n=3 passages/batches of colonoids for Variant in (B); n=3 different patients for Control, n=3 slides from different blocks for Variant in (C). (D) Representative images (left) of indicated samples for colonoid formation assays on d6 post seeding. Scale bar: 300 μm. (E) Quantification of total newly formed colonoids categorized by size on d6 post seeding. n=4 lines of colonoids from 4 patients for Control and VEO-IBD, n=4 passages/batches of colonoids for Variant. Each passage/batache has more than two statistic replicates. (F) Representative immunostaining images for co-staining of TNFSF13 and FAS RNAscope probes with E-cadherin antibody in WT and variant iPSC-derived colon organoids on d7 post seeding. Scale bar: 50 μm. n=3 passages/batches of organoids. (G) Representative images for organoid formation assay on d9 post seeding in WT and variant iPSC-derived organoids. Scale bar: 400 μm. n=3 passages/batches of organoids. Each passage/batch has more than two statistic replicates. (H) Quantification of rate and area of newly formed organoids at 9d post seeding. Two-tailed Student’s t-test was used for statistical analysis. (I-J) Percentage of EdU+ cells after IgG or TNFSF13 neutralizing antibody (nTNFSF13) treatment for control tissue-derived colonoids (I) or WT iPSC-organoids (J) at d7 post seeding. Colonoid size was calculated by the maximum of vertical projection area. n=3 lines of colonoids from 3 different patients for (I). n=3 passages/batches of organoids for (J). P values are shown on bar graphs unless P>0.05. Two-way ANOVA (with multiple comparisons) was used for statistical analysis in (A) and (E). Two-tailed Student t-test was used in (H-J).
Figure 2.
Figure 2.. FAS is a receptor for TNFSF13 in colonic epithelial cells.
(A-B) Percentage of FAS+ and HVEM+ cells in colonoids (A) or iPSC-organoids (B) on d7 post seeding by FACS. (C) Western blotting for FAS with co-IP supernatant from control colonoids d7 post seeding. TNFSF13 was used as capture antibody for co-IP. (D) Representative immunostaining images for co-staining of TNFSF13 and FAS RNAscope probes in control colonoids on d7 post seeding. White arrow heads denote co-expression of TNFSF13 and FAS. Scale bar: 100 μm. (E) Representative immunostaining images for co-staining of TNFSF13 and FAS RNAscope probes with Ki67 antibody in control colonoids on d7 post seeding. White arrow heads denote co-expression of TNFSF13, FAS, and Ki67. Scale bar: 100 μm. (F) Representative immunostaining images for co-staining of TNFSF13 and FAS RNAscope probes with FABP2 antibodies in control colonoids on d7 post seeding. White arrow heads denote co-expression of TNFSF13, FAS, and FABP2. Scale bar: 100 μm. (G) Percentage of EdU+ cells in IgG or FAS neutralizing antibody (nFAS)-treated control colonoids (upper) or WT iPSC-organoids (lower) on d7 post seeding. Two-tailed Student’s t-test was used for statistical analysis. (H) UMAP plots showing the expression pattern of TNFSF13 and FAS in scRNA-seq data from human tissue-derived colonoids. n=2 lines of colonoids from 2 different patients for Control and VEO-IBD, n=2 passages/batches of colonoids for Variant. (I) Dot plot indicating the relative expression pattern of selected genes of TNFSF13 family and related receptors and enterocyte markers among annotated clusters for human colonoids scRNA-seq data. P values are shown on bar graphs unless P>0.05. Two-way ANOVA (with multiple comparisons) was used for statistical analysis in (A-B). Two-tailed Student t-test was used in (G).
Figure 3.
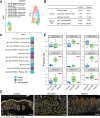
Figure 3.. Transcriptomic profiling in human colonoids.
(A) UMAP visualizations of scRNA-seq data for human colonoids. n=2 lines of colonoids from 2 different patients for Control and VEO-IBD, n=2 passages/batches of colonoids for Variant. (B) Dot plot with relative expression of top 5 changed genes for each annotated cluster for scRNAseq datasets in human colonoids. (C) Color scale indicates group with higher percentage of cells within a given cluster in each comparison. The color indicates the condition with higher percentage of a cluster in each pairwise comparison. (D) Dot plot with relative expression of selected genes of TNFSF13 family and related receptors and enterocyte markers among control, VEO-IBD and variant in human colonoids. (E) qPCR for ALDOB in colonoids on d7 post seeding. One-way ANOVA (with multiple comparisons) was used for statistical analysis. n=3 lines of colonoids from 3 different patients for Control and VEO-IBD, n=3 passages/batches of colonoids for Variant. (F) Representative IF images for FABP2 and E-cadherin in human colonoids. White arrow heads denoted FABP2+ cells. Scale bar: 50 μm. P values are shown on bar graphs unless P>0.05.
Figure 4.
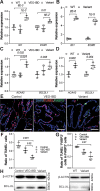
Figure 4.. TNFSF13 augments the balance of apoptosis and proliferation through FAS-apoptosis pathway.
(A-B) qPCR for ID and ECM1 in colonoids (A) and iPSC-derived colon organoids (B). (C-D) qPCR for ACAA2 and BCL2L1 in tissue-derived colonoids from control, VEO-IBD, variant (C) and iPSC organoids from WT and variant (D). (E-G) Representative immunostaining images (E) for TUNEL and FABP2 in colonoids. Scale bar: 100 μm. Quantification for ratio of TUNEL+ cells (F) per colonoid and TUNEL+FABP2+ cells in FABP2+ cells (G). One-way ANOVA (with multiple comparisons) was used for statistical analysis. (H) Western blotting for BCL-XL in colonoids (upper) and iPSC-organoids (lower). β-ACTIN was used as a loading control. P value shown in the bar graphs unless P>0.05. Two-way ANOVA (with multiple comparisons) was used for statistical analysis in (A-D). n=3 lines of colonoids from 3 different patients for Control and VEO-IBD, n=3 passages/batches of colonoids for Variant. n=3 passages/batches of iPSC-organoids.
Figure 5.
Figure 5.. Increased abundance of memory B cells and depletion of IgA+ plasma cells observed in TNFSF13 variant colon.
(A) UMAP visualizations of scRNA-seq data for B cell and plasma cell clusters among lamina propria cells from variant colon biopsies. n=1 patient for Control and Variant. (B) Table indicates abundance (%) of B cell and PC subsets in control and variant samples from scRNAseq data from Variant and Control colon biopsies. (C) Comparison of cell type abundance between samples from scRNAseq data from Variant and Control colon biopsies. Color scale indicates which group has a higher percentage of cells within a given cluster. (D) Representative IMC overlay images of epithelial, B cell and plasma cell markers in colon from control, VEO-IBD and variant patient. Scale bar: 100 μm. Marker for B cell: CD20+; Markers for plasma cell: CD20CD27+CD38+. n=3 different patients for Control and VEO-IBD, n=3 slides from different blocks for Variant. (E) Boxplot showing the rate of immune cell composition quantified by calculating the proportion of specific markers in all cells at the same region (both lamina propria and epithelial cell populations). n=3 different patients for Control and VEO-IBD, n=3 slides from different blocks for Variant.
Figure 6.
Figure 6.. Epithelial-secreted TNFSF13 modulates differentiation of memory B cells to plasmablasts and plasma cells.
(A) Schematic of co-culture model. (B) Percentage of plasmablasts differentiated from sorted human memory B cells at day 8 post-seeding via co-culturing with equal numbers of control, VEO-IBD, and variant colonoids in an IntestiCult media and B cell media mixture (ratio 1:1). (C) Percentage of plasmablasts differentiated from sorted human memory B cells at day 8 post-seeding via culturing in conditioned media consisting of B cell media and conditioned media (ratio 1:1). (D-E) Percentage of plasma cells and IgA+ plasma cells differentiated from sorted human memory B cells at day 14 post-seeding with B cell media-conditioned media (ratio 1:1). (F) ELISA for IgA in media differentiated from sorted human memory B cells at day 14 post-seeding. (G-H) Percentage of plasma cells and IgA+ plasma cells differentiated from sorted human memory B cells at day 14 post-seeding. (I) ELISA for IgA in media from sorted human memory B cells at day 14-post seeding by culturing in conditioned media mixture starting at day 6 post-seeding. P value shown in the bar graphs unless P>0.05. One-way ANOVA (with multiple comparisons) or two-tailed Student’s t-test was used for statistical analysis. n=3 lines of colonoids from 3 different patients for Control and VEO-IBD, n=3 passages/batches of colonoids for Variant. n=3 passages/batches of iPSC-organoids. n=7 independent donors to obtain human memory B cells.

References

    1. Neurath MF. Cytokines in inflammatory bowel disease. Nat Rev Immunol. 2014;14(5):329–42. - PubMed
    1. Kuenzig ME, Fung SG, Marderfeld L, Mak JWY, Kaplan GG, Ng SC, et al. Twenty-first Century Trends in the Global Epidemiology of Pediatric-Onset Inflammatory Bowel Disease: Systematic Review. Gastroenterology. 2022;162(4):1147–59 e4. - PubMed
    1. Levine A, Griffiths A, Markowitz J, Wilson DC, Turner D, Russell RK, et al. Pediatric modification of the Montreal classification for inflammatory bowel disease: the Paris classification. Inflamm Bowel Dis. 2011;17(6):1314–21. - PubMed
    1. Sullivan KE, Conrad M, and Kelsen JR. Very early-onset inflammatory bowel disease: an integrated approach. Curr Opin Allergy Clin Immunol. 2018;18(6):459–69. - PMC - PubMed
    1. Ouahed J, Spencer E, Kotlarz D, Shouval DS, Kowalik M, Peng K, et al. Very Early Onset Inflammatory Bowel Disease: A Clinical Approach With a Focus on the Role of Genetics and Underlying Immune Deficiencies. Inflamm Bowel Dis. 2020;26(6):820–42. - PMC - PubMed

Publication types