[Preprint]. 2024 Oct 1:2024.09.26.615260.
doi: 10.1101/2024.09.26.615260.

Potentiation of active locomotor state by spinal-projecting serotonergic neurons

Affiliations

Potentiation of active locomotor state by spinal-projecting serotonergic neurons

Sara J Fenstermacher et al. bioRxiv. .

Abstract

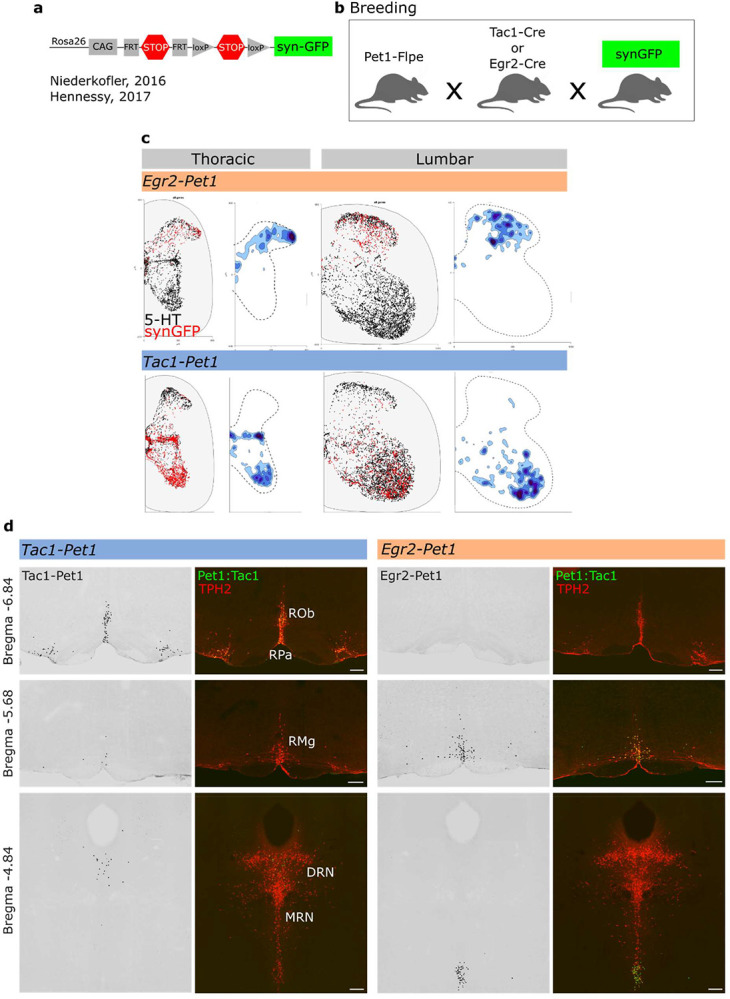
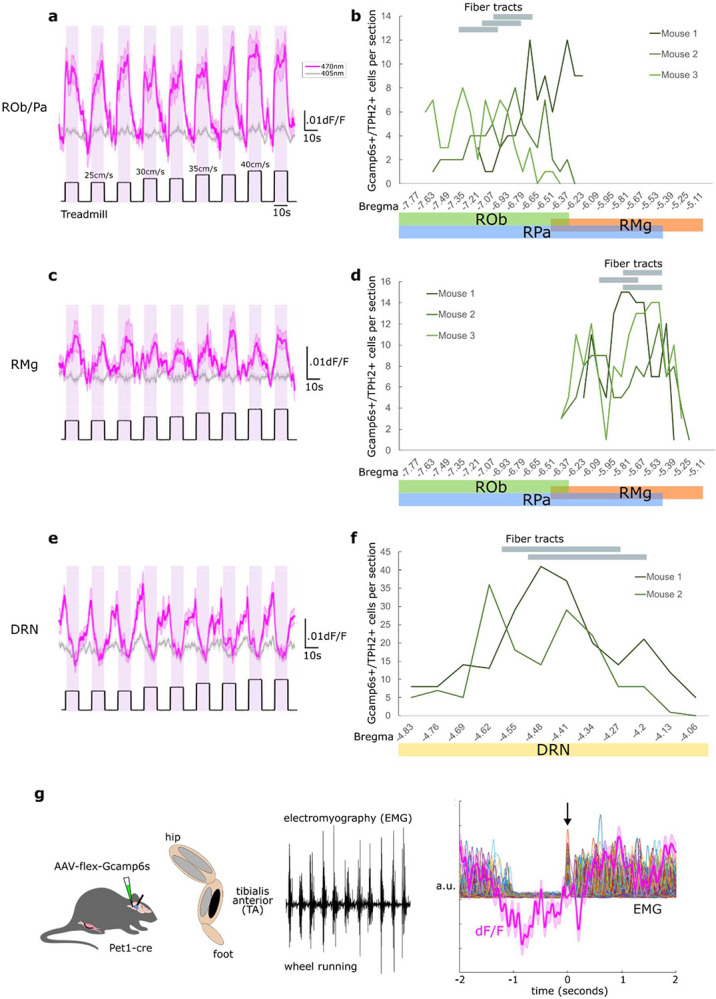
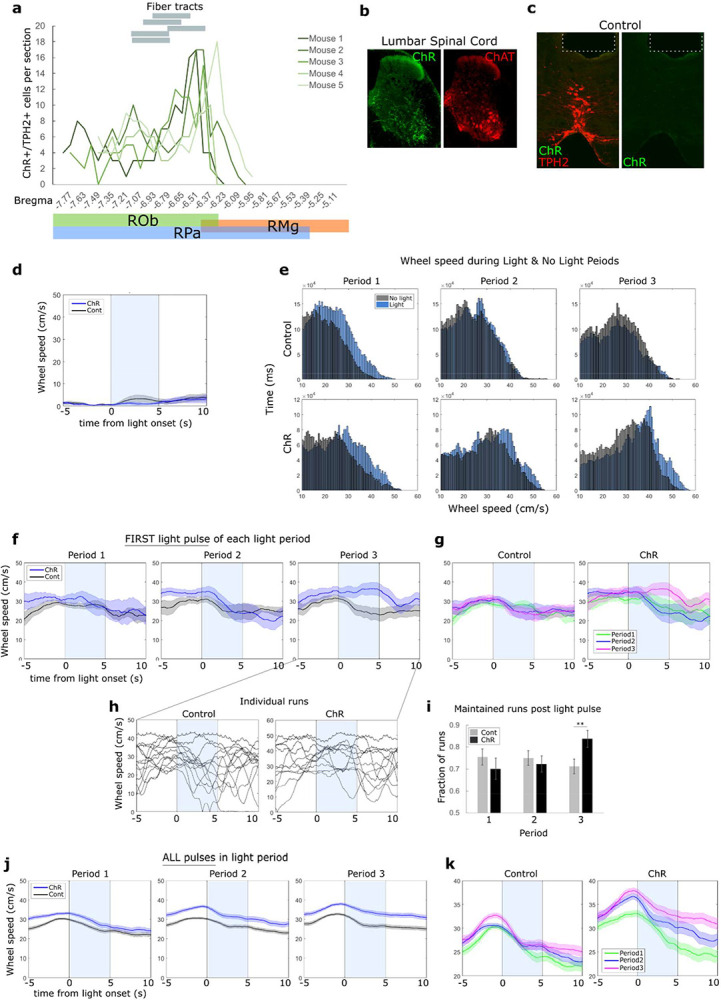
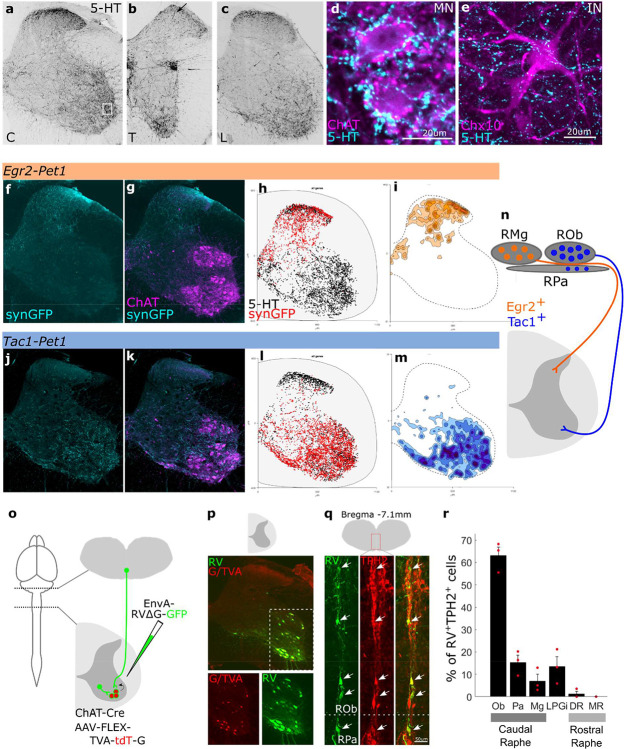
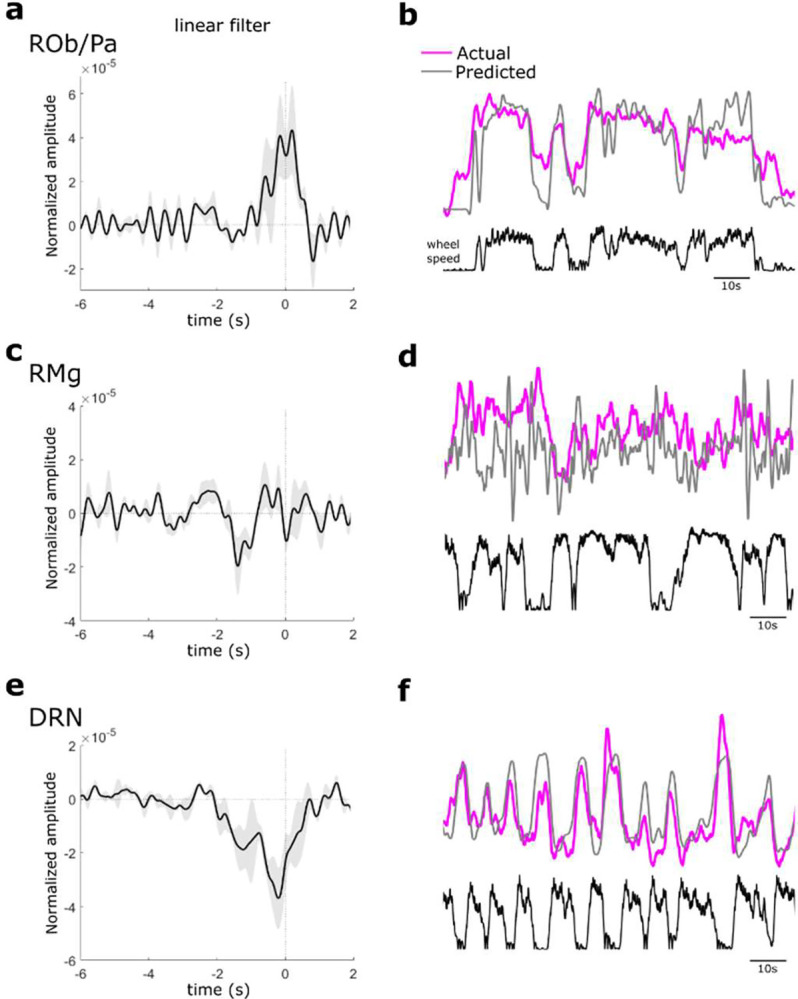
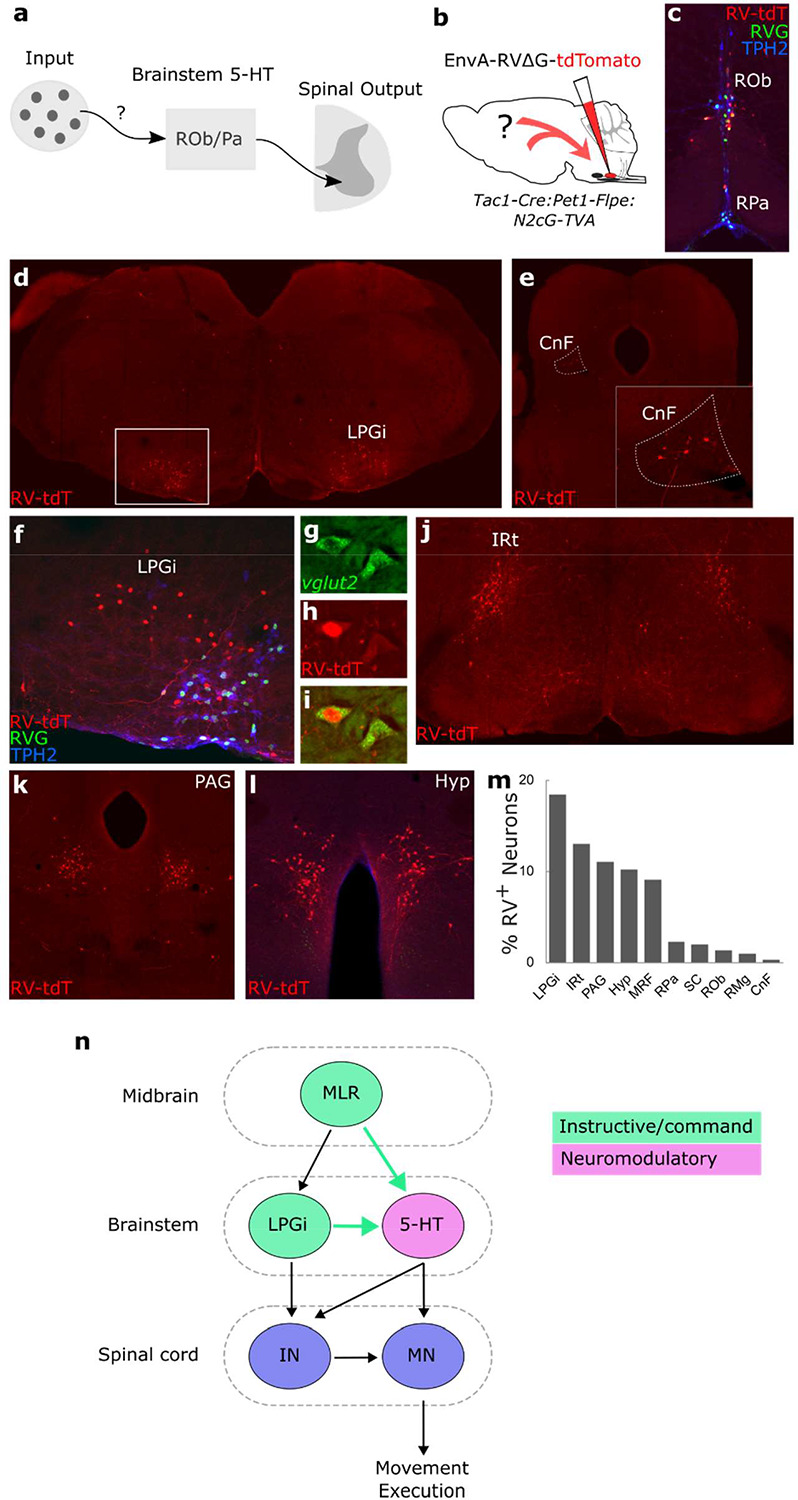
Animals produce diverse motor actions that enable expression of context-appropriate behaviors. Neuromodulators facilitate behavioral flexibility by altering the temporal dynamics and output of neural circuits. Discrete populations of serotonergic (5-HT) neurons target circuits in the brainstem and spinal cord, but their role in the control of motor behavior is unclear. Here we define the pre- and post-synaptic organization of the spinal-projecting serotonergic system and define a role in locomotor control. We show that while forebrain-targeting 5-HT neurons decrease their activity during locomotion, subpopulations of spinal projecting neurons increase their activity in a context-dependent manner. Optogenetic activation of ventrally projecting 5-HT neurons does not trigger initiation of movement, but rather enhances the speed and duration of ongoing locomotion over extended time scales. These findings indicate that the descending serotonergic system potentiates locomotor output and demonstrate a role for serotonergic neurons in modulating the temporal dynamics of motor circuits.


Figures

Extended Data Figure 1.
Extended Data Figure 1.. Genetic labeling of 5-HT sub-populations
a. Intersectional synaptophysin-GFP allele,. b. Breeding scheme to generate Egr2-Pet1-synGFP or Tac1-Pet1-synGFP mice. c. Distribution of synaptophysinGFP (red) and 5-HT immunostaining (black) puncta in thoracic and lumbar spinal segments for Egr2-Pet1 and Tac1-Pet1 neuron populations. Relative density of synGFP puncta (blue). d. Distribution of Tac1-Pet1 and Egr2-Pet1 neurons in brainstem and midbrain with TPH2 immunostaining. Raphe pallidus, RPa; raphe obscurus, ROb; raphe magnus, RMg; dorsal raphe nucleus, DRN; median raphe nucleus, MRN.
Extended Data Figure 2.
Extended Data Figure 2.. Monosynaptic rabies tracing from spinal MNs and Chx10+ INs
a. Rabies virus (RV) labeling in brainstem and midbrain with TPH2 immunostaining showing serotonergic nuclei. b. Summary of RV+TPH+ neurons in single ChAT-Cre animal with total TPH+ cells. c. Experimental strategy for tracing monosynaptic inputs to Chx10+ INs. Injection of Chx10-cre mouse cervical spinal cord with AAV-FLEX-TVA-HA-G followed by EnvA-RVΔG-GFP. d. Infection of Chx10+ neurons in cervical spinal cord. Zoom-in below showing RV-infected HA+ neurons and 5-HT puncta. e. RV labeling within brainstem reticular formation. f. Summary of RV+TPH+ neurons in single Chx10-cre animal with total TPH+ cells. (Raphe pallidus, RPa; raphe obscurus, ROb; lateral paragigantocellularis, LPGi; raphe magnus, RMg; dorsal raphe nucleus, DRN; median raphe nucleus, MRN.)
Extended Data Figure 3.
Extended Data Figure 3.. Retrograde labeling of spinal-projecting Pet1 neurons
a. Experimental procedure. Injection of AAV2r-FLEX-tdTomato into C5–C8 of Pet1-Cre mice. b. Expression of tdTomato in brainstem with TPH2 expression. tdTomato+ fibers at nucleus ambiguous (NA). c. tdTomato expression within fibers of thoracic (Th) and lumbar (L) spinal cord with ChAT immunostaining. Right most images are zoom-in of black box showing tdTomato+ fibers around MNs. d. Schematic depicting highly collateralized ROb/Pa Pet1 neurons targeting multiple spinal levels and caudal medulla.
Extended Data Figure 4.
Extended Data Figure 4.. Neural activity during individual runs on wheel
a-c. Heatmap showing dF/F (left) for all individual runs during wheel assay. Pet1 neuron activity within ROb/Pa, RMg, or DRN. Each horizontal line is a single run. Runs ordered by length from shortest to longest. Traces include 2 seconds prior to run start. Heatmap showing corresponding wheel speed (right) for all runs. a. ROb/Pa (954 runs, 3 animals). b. RMg (991 runs, 3 animals). c. DRN (916 runs, 3 animals).
Extended Data Figure 5.
Extended Data Figure 5.. Additional photometry data and histology quantification
a,c,e. Averaged 470nm (pink) and 405nm (grey) dF/F during treadmill locomotor assay with treadmill setting (black). a. ROb/Pa (20 trials from 2 animals). c. RMg (10 trials from 2 animals). e. DRN (12 trials from 2 animals). b,d,f. Post-hoc quantification of histology for animals used in fiber photometry experiments. Gcamp6s+TPH2+ cell counts and fiber position for each animal. b. ROb/Pa. d. RMg. f. DRN. g. EMG recordings from tibialis anterior (TA) with Gcamp imaging during wheel running. Raw EMG trace from TA during locomotion (black). Average dF/F (pink) from ROb/Pa overlaying rectified EMG traces aligned to first peak of muscle activity at start of run bout (multicolor). Arrow shows alignment of first muscle burst.
Extended Data Figure 6.
Extended Data Figure 6.. Retrograde rabies tracing from raphe neurons targeting ventral spinal cord.
a. Intersectional N2cG-TVA allele. b. Generation of Tac1:Pet1:N2cG-TVA mice. Expression of HA-tagged N2cG within ROb/Pa and LPGi neurons. c. HA and TPH2 immunostaining in N2cG-TVA mouse (no Cre/Flpe) injected with EnvA-RVΔG-tdTomato. d. Cre-dependent N2cG-TVA allele. e. Generation of Pet1:N2cG-TVA mice. Expression of HA-tagged N2cG within ROb/Pa, RMg, LPGi neurons. f. HA and TPH2 immunostaining in N2cG-TVA mouse (no Cre) injected with EnvA-RVΔG-tdTomato. g. Rabies infection in Pet1:N2cG-TVA caudal brainstem with labeled presynaptic cells in LPGi, cuneiform (CnF), periaqueductal grey (PAG), and hypothalamus (Hyp).
Extended Data Figure 7.
Extended Data Figure 7.. Optogenetic activation of ROb/Pa Pet1 neurons during locomotor behavior
a. ChR-infected cells and fiber position for each ChR animal. b. ChR expression in lumbar spinal cord with ChAT immunostaining. c. Representative control animal with no ChR expression. White dotted line denotes position of fiber. d. Wheel speed for trials when animal was still at time of light onset. Averaged wheel speed from the first light pulse of each light period for control and ChR animals when wheel was 0cm/s at time of light onset. e. Distribution of time (ms) across wheel speeds during each No-light (grey) or Light (blue) periods (1–3). Combined data from 5–6 animals. f. Wheel speed when animal was running at time of light onset. Averaged wheel speed during first light pulse of each period when wheel speed was greater than 20cm/s at light onset. g. Data in f displayed by control or ChR animals with light periods overlayed. h. Individual wheel traces from light period 3 in f. i. Fraction of trials when animal is running at time of light onset and where running is maintained for 10 seconds following light onset. n=113–159 runs, from 5–6 animals. Error bars are SEM. *p<0.05 unpaired t-test. j. Averaged wheel speed across all light pulses of each period when wheel speed was greater than 20cm/s at light onset. k. Data in j displayed by control or ChR animals with overlayed light periods.
Figure 1.
Figure 1.. Spinal motor circuits receive biased 5-HT input form medullary raphe nuclei
a-e. 5-HT immunostaining in adult spinal cord at cervical (C), thoracic (T), lumbar (L) levels. d. ChAT+ motor neurons (MN) with 5-HT immunostaining. Zoom-in of white box in a. e. Genetically labeled Chx10+ ventral interneuron (IN) with 5-HT immunostaining. f-i. Genetic labeling of Egr2-Pet1 neurons with synaptophysinGFP (cyan) in cervical spinal cord. g. Immunostaining for ChAT (magenta) to visualize MN. h. Distribution of Egr2-Pet1 puncta (red) and total 5-HT puncta (black). i. Relative density plot of Egr2-Pet1 puncta. j-m. Genetic labeling of Tac1-Pet1 neurons with synaptophysinGFP in cervical spinal cord. k. Immunostaining for ChAT to visualize MN. l. Distribution of Tac1-Pet1 puncta (red) and total 5-HT puncta (black). m. Relative density plot of Tac1-Pet1 puncta. n. Schematic summary of Tac1 vs. Egr2 Pet1 neuron populations and target innervation of spinal cord. o-r. Monosynaptic retrograde rabies tracing to identify 5-HT input to spinal MNs. o. Experimental procedure. EnvA-RVΔG-GFP injection into cervical spinal cord to infect spinal MN expressing TVA and G. p. Cervical spinal cord MNs infected by AAV and RV. Zoom-in of white-dotted region are below. q. Retrogradely labeled neurons expressing tryptophan hydroxylase 2 (TPH2) within ROb and RPa. r. Quantification of RV-labeled TPH2+ neurons. Percentage of total RV+/TPH2+ cells within raphe and LPGi. n=3, each red dot is average of a single animal.
Figure 2.
Figure 2.. Activity of ventrally-projecting serotonin neurons increases during locomotion
a. Behavioral assay. Mice freely running on low-profile running wheel with attached fiber for photometry recordings. b. Example photometry traces dF/F (470nm in pink, 405nm in grey) from ROb/Pa Pet1 neurons with wheel speed (black) during single session. c. Injection of AAV-FLEX-Gcamp6s into ventral medulla of Pet1-Cre mice to infect ROb/Pa Pet1 neurons. Histology showing Gcamp6s expression and TPH2 immunostaining in ROb/Pa. d,h,l. Example trace during 60sec of free running with dF/F and wheel speed for ROb/Pa Pet1 neurons (d), RMg Pet1 neurons (h), DRN Pet1 neurons (l). e,i,m. Averaged dF/F and wheel speed aligned to start and stop of running. f,j,n. Plot of the average dF/F during the rest (prior to run start) on the x-axis and during the run on the y-axis. Each dot is an individual run. Triangles show average dF/F of all runs at 470nm (yellow) and 405nm (black). o,r,u. Example photometry traces during treadmill assay showing 470nm (pink) and 405nm (grey) dF/F with treadmill setting in black. ROb/Pa Pet1 neurons (o), RMg Pet1 neurons (r), DRN Pet1 neurons (u). p,s,v, Averaged signal across all treadmill run bouts with 10sec run and 10sec rest. ROb/Pa (p), RMg (s), DRN (v). q,t,w, Average 470nm dF/F (pink) and wheel speed (black) at run start on wheel. ROb/Pa (q), RMg (t), DRN (w).
Figure 3.
Figure 3.. Locomotor state is a strong predictor of ROb/Pa activity
a,c,e. Linear filters for ROb/Pa Pet1 neurons (a), RMg Pet1 neurons (c), DRN Pet1 neurons (e). Black line is average (n=3 mice) with grey SEM. b,d,f, Actual dF/F trace (pink) overlayed with model’s predicted activity (grey) and wheel speed (black) for ROb/Pa (b), RMg (d), DRN (f).
Figure 4.
Figure 4.. Brain-wide inputs to raphe Pet1 neurons targeting ventral spinal cord
a. Identifying inputs to the ventral spinal cord-projecting 5-HT pathway. b. Experimental procedure. Injection of EnvA-RVΔG-tdTomato into ROb/Pa of Tac1-Cre:Pet1-Flpe:N2cG-TVA mice to identify monosynaptic inputs to Tac1-Pet1 neurons. c. Primary infection of Tac1-Pet1 neurons in ROb/Pa with EnvA-RVΔG-tdTomato. d-l. Representative images of EnvA-RVΔG-tdTomato (tdT) infected neurons LPGi (d, zoom-in white box in f), cuneiform (CnF, e), intermediate reticular nucleus (IRt, j), periaqueductal grey (PAG, k), hypothalamus (Hyp, l). g-i. Vglut2 mRNA expression with EnvA-RVΔG-tdTomato infection in LPGi neurons. m. Quantification of rabies-infected neurons. Percentage of total rabies-labeled cells (n=2). n. Model suggested by rabies tracing. Locomotor command neurons within MLR (CnF) and LPGi send projections (cyan arrows) to brainstem 5-HT neurons that target ventral spinal cord to facilitate modulation of spinal MNs and INs during locomotor behavior. (lateral paragigantocellularis, LPGi; intermediate reticular nucleus, IRt; periaqueductal grey, PAG; hypothalamus, Hyp; medullary reticular formation, MRF; cuneiform, CnF; superior colliculus, SC; raphe pallidus, RPa; raphe obscurus, ROb; raphe magnus, RMg, mesencephalic locomotor region, MLR)
Figure 5.
Figure 5.. Activation of ROb/Pa potentiates ongoing locomotor behavior
a-b. Experimental procedure. a. Injection of AAV2-DIO-ChR2(H134R)-EYFP into ROb/Pa of Pet1-Cre mice. ChR-expressing TPH2+ neurons in ROb/Pa with ChR+ axon terminals in lumbar spinal cord. b. Light delivery protocol during 30min of wheel running with single example wheel speed trace from one ChR animal (orange). Stimulation during 5-minute light periods: 5s 20Hz pulses 470nm light repeating every 15s. c. Total time at rest vs. locomoting in control (grey) and ChR (black) animals. n=22–30 trials from 5–6 animals. d. Total number of locomotor bouts for ChR and control mice (equal to total number of run starts and run stops) n=22–30 trials from 5–6 animals. **p<0.01 unpaired t-test. e. Number of locomotor bouts during each 5-minute light or no light period for control and ChR animals. n=22–30 trials from 5–6 animals. *p<0.05 unpaired t-test. ns=not significant. f. Average length of locomotor bouts during each 5-minute light or no light period for control and ChR animals. n=22–30 trials from 5–6 animals. **p<0.01 unpaired t-test. g. Fraction of total time control or ChR animals spend within various locomotor speed intervals. n=22–30 trials from 5–6 animals. **p<0.01, ***p<0.001 Bonferroni-corrected t-test. h. Distribution of time (ms) across wheel speed during No-light (grey) or Light (blue) periods. Combined data from 5–6 animals across all No-light or Light periods. i. Difference in average speed between Light and No-light periods. n=5–6 animals. *p<0.05 unpaired t-test. j. Average speed during each 5-minute light or no light period for control and ChR animals. n=22–30 trials from 5–6 animals. *p<0.05 unpaired t-test. k. Fraction of time mice spent locomoting greater than speed of 35cm/s during each 5-minute light or no light period for control and ChR animals. n=22–30 trials from 5–6 animals. **p<0.01 unpaired t-test. ns=not significant. l. Average maximum speed during each 5-minute light or no light period for control and ChR animals. n=22–30 trials from 5–6 animals. *p<0.05 unpaired t-test. ns=not significant. All Error bars are SEM.

References

    1. Katz P.S. (1995). Intrinsic and extrinsic neuromodulation of motor circuits. Curr Opin Neurobiol 5, 799–808. 10.1016/0959-4388(95)80109-x. - DOI - PubMed
    1. Marder E. (2012). Neuromodulation of neuronal circuits: back to the future. Neuron 76, 1–11. 10.1016/j.neuron.2012.09.010. - DOI - PMC - PubMed
    1. Marder E., and Bucher D. (2001). Central pattern generators and the control of rhythmic movements. Curr Biol 11, R986–996. 10.1016/s0960-9822(01)00581-4. - DOI - PubMed
    1. Harris-Warrick R.M. (2011). Neuromodulation and flexibility in Central Pattern Generator networks. Curr Opin Neurobiol 21, 685–692. 10.1016/j.conb.2011.05.011. - DOI - PMC - PubMed
    1. Huang Y.C., Luo J., Huang W., Baker C.M., Gomes M.A., Meng B., Byrne A.B., and Flavell S.W. (2023). A single neuron in C. elegans orchestrates multiple motor outputs through parallel modes of transmission. Curr Biol 33, 4430–4445 e4436. 10.1016/j.cub.2023.08.088. - DOI - PMC - PubMed

Publication types

LinkOut - more resources