[Preprint]. 2024 Sep 27:2024.09.25.614736.
doi: 10.1101/2024.09.25.614736.

A unique interplay of access and selection shapes peritoneal metastasis evolution in colorectal cancer

Affiliations

A unique interplay of access and selection shapes peritoneal metastasis evolution in colorectal cancer

Emma Ce Wassenaar et al. bioRxiv. .

Abstract

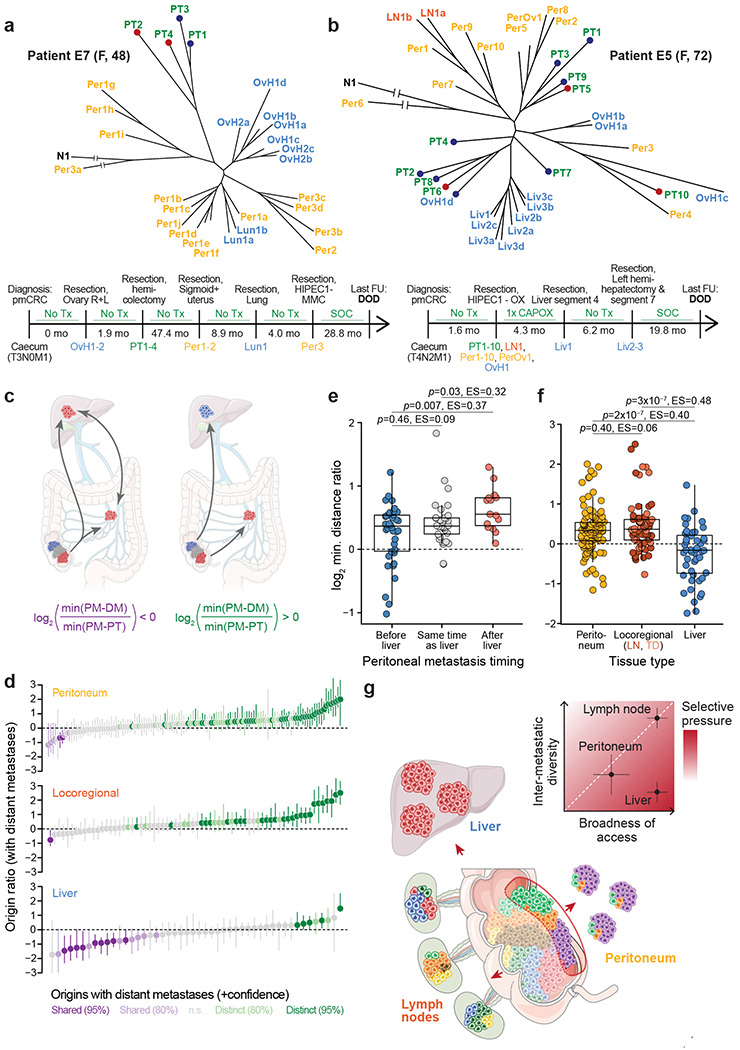
Whether metastasis in humans can be accomplished by most primary tumor cells or requires the evolution of a specialized trait remains an open question. To evaluate whether metastases are founded by non-random subsets of primary tumor lineages requires extensive, difficult-to-implement sampling. We have realized an unusually dense multi-region sampling scheme in a cohort of 26 colorectal cancer patients with peritoneal metastases, reconstructing the evolutionary history of on average 28.8 tissue samples per patient with a microsatellite-based fingerprinting assay. To assess metastatic randomness, we evaluate inter- and intra-metastatic heterogeneity relative to the primary tumor and find that peritoneal metastases are more heterogeneous than liver metastases but less diverse than locoregional metastases. Metachronous peritoneal metastases exposed to systemic chemotherapy show significantly higher inter-lesion diversity than synchronous, untreated metastases. Projection of peritoneal metastasis origins onto a spatial map of the primary tumor reveals that they often originate at the deep-invading edge, in contrast to liver and lymph node metastases which exhibit no such preference. Furthermore, peritoneal metastases typically do not share a common subclonal origin with distant metastases in more remote organs. Synthesizing these insights into an evolutionary portrait of peritoneal metastases, we conclude that the peritoneal-metastatic process imposes milder selective pressures onto disseminating cancer cells than the liver-metastatic process. Peritoneal metastases' unique evolutionary features have potential implications for staging and treatment.


Conflict of interest statement

Competing financial interests The authors declare no competing financial interests.

Figures

Figure 1.
Figure 1.. Polyguanine fingerprints reconstruct cancer evolution.
a, Patient cohort overview. Left, Types and total numbers of samples analyzed in this study. Right, Overview of samples analyzed per patient, as well as AJCC Tumor, Node, and Metastasis (TNM) staging at diagnosis, primary tumor location, number of analyzed synchronous and metachronous metastatic lesions. b, Reconstruction of tumor evolution from polyguanine fingerprints. Each tumor sample is genotyped at approximately 31 polyguanine loci (here, only three are shown for simplicity). Polyguanine fingerprints are created by subtracting the germline genotype from each tumor sample’s vector of mean polyguanine lengths. The angular distance (AD) between two unit length-normalized polyguanine fingerprints (e.g. PT1 and Per1) is defined as arccos (PT1 · Per1). Phylogenetic trees are built from angular distance matrices with the neighbor-joining algorithm. The normal tissue sample is attached post hoc to the last internal node created. c-d, Comparison of phylogenetic trees reconstructed from somatic copy number alterations (SCNAs) (c) or polyguanine fingerprints (d) for patient C161. PT, primary tumor; LN, lymph node metastasis; Per, peritoneal metastasis; Liv, liver metastasis; Lun, lung metastasis; Ld, distant lymph node metastasis; Di, diaphragm metastasis; Ov, ovarian metastasis; Pa, pancreas metastasis; Plu, pleural metastasis; SB, small bowel metastasis; Sp, splenic metastasis; St, stomach metastasis. e, Quartet similarity between polyguanine and SCNA-based phylogenetic trees for 6 patients. Green, observed similarity. Purple, similarity expected by chance based on 1,000 random permutations of tree tip labels. Permutation-based p-values corrected for multiple-hypothesis testing by Holm’s method (q-values).
Figure 2.
Figure 2.. Peritoneal metastases exhibit intermediate inter-metastatic diversity.
a-b, Schematic illustrating low (a) or high (b) inter-metastatic diversity in two hypothetical patients. Colored cells represent distinct lineages originating in the primary tumor. c-d, Phylogenetic trees for patients C157 and E15, illustrating low (c) and high (d) inter-metastatic diversity of peritoneal lesions. Td, tumor deposit; all other sample type abbreviations as in Figure 1. Spatial localization of primary tumor samples (deep-invasive or mucosal/luminal) is indicated in blue and red. In (d), clades enriched for two spatially distinct primary tumors Pta and PTb are shaded in blue and green, respectively. e, Metastasis-specific root diversity scores (RDS) for locoregional, peritoneal, and liver metastases. Each point represents a patient. Lymph node metastases and tumor deposits are evaluated separately but plotted together as locoregional metastases. Kruskal-Wallace p-value is shown, along with Dunn’s test p-values for each pairwise comparison with Holm’s correction for multiple hypothesis testing. Effect sizes are based on Wilcoxon Rank Sum tests run independently for each pairwise comparison. f, Comparison of inter-metastatic diversity by pairwise angular distances. Each point is the angular distance between a pair of distinct metastatic lesions of the indicated type within a patient. Values in the locoregional category include all pairwise distances between lymph node metastases and tumor deposits. P-values and effect sizes as in (c). g, Comparison of intra-metastatic diversity quantified by pairwise angular distances. Each point is the angular distance between a pair of spatially distinct samples taken from the same metastatic lesion. Only metastatic lesions with 2 or more sampled region are included. Wilcoxon rank sum test p-value and effect size.
Figure 3.
Figure 3.. Inter-metastatic diversity varies by timing and treatment.
a, Inter-metastatic diversity (RDS) of synchronous/untreated locoregional, peritoneal, and liver metastases. RDS calculations are based on a reduced phylogeny consisting only of the patient’s primary tumor, normal tissue, and synchronous/untreated metastases of the indicated tissue type. P-values and effect sizes as described in Fig. 2e. b-c, Inter-metastatic diversity among synchronous/untreated and metachronous/treated peritoneal metastases based on RDS (b) and pairwise inter-lesion angular distances (c). d-e, As in (b-c) but for liver metastases. f, Phylogenetic tree and clinical timeline for patient E14. pmCRC, colorectal cancer with peritoneal metastasis; OX, oxaliplatin. g, Phylogenetic tree and clinical timeline for patient E8. MMC, mitomycin C; CAPOX, capecitabine and oxaliplatin. h, Intra-metastatic diversity in synchronous/untreated peritoneal and liver metastases. Intra-metastatic diversity is quantified as in Fig. 2g. i, As in (h), but including all untreated peritoneal and liver metastases regardless of timing. P-values and effect sizes for all comparisons between two groups (b-e, h, i) are from Wilcoxon rank sum tests.
Figure 4.
Figure 4.. Peritoneal metastases associate with deep-invading primary tumor regions.
a, Schematic of a T4 stage primary tumor breaching the peritoneal lining (red highlighted region) and seeding peritoneal metastases that are enriched for lineages that are in the breach area b, Metastasis types observed in stage IV patients stratified by T-stage. Bars are labeled with the number of patients in each category. Data adapted from Lemmens et al.. c-d, Phylogenetic trees for patients E18 (c) and E20 (d) along with histological images showing the precise anatomical location of primary tumor samples. Red circles, deep-invading regions. Blue circles, luminal/mucosal regions. e, Association of peritoneal metastases (as a group) with deep-invading vs. luminal primary tumor for each patient. For each peritoneal metastasis, we calculate the ratio of its angular distances to the closest deep-invading and closest luminal/mucosal region (lesion-depth ratio). This value is then averaged across all lesions to quantify their overall proximity to deep-invading vs. luminal regions. x-axis: log2-ratio of the observed average lesion-depth ratio to the expected average lesion-depth ratio (median of 10,000 permutations of primary tumor regions’ invasion-depth labels within each patient). y-axis: −log10 p-values from two-sided permutation tests for each patient, with correction for multiple hypothesis testing (q-values). Patients with significant peritoneal metastasis similarity to either deep-invading or luminal/mucosal regions are highlighted in red. f, Pairwise angular distances between metastases and deep-invading vs. luminal/mucosal primary tumor regions. Each point is the angular distance between a metastasis and a primary tumor region of the indicated invasion depth. All unique combinations of metastases and primary tumor regions within the same patient are included. p-values and effect sizes from two-sided Wilcoxon rank sum tests. g, Pairwise angular distances between liver metastases and deep-invading vs. luminal/mucosal primary tumor regions, separated by liver metastasis timing with respect to the earliest diagnosed peritoneal metastasis (PM). Left, patients with no peritoneal metastases, only liver metastases. Center, liver metastases diagnosed at least 3 months before peritoneal metastases. Right, liver metastases diagnosed at the same time or after peritoneal metastases.
Figure 5.
Figure 5.. Peritoneal and distant metastases typically have distinct evolutionary origins.
a, Phylogenetic tree and clinical timeline for patient E7. OvH, Ovarian metastasis of suspected hematogenous origin by pathological examination (tumor growth within the parenchyma but not on the ovarian surface). b, Phylogenetic tree and clinical timeline for patient E5. c, Schematic depicting two possibilities for the lineage relationship between peritoneal (PM) and distant metastases (DM). Left, peritoneal and distant metastases have a common subclonal origin. This could mean that they are both seeded from the same primary tumor lineage, or that they gave rise to each other. In this case, the origin ratio, defined as log2(min(PMDM)min(PMPT)), is expected to be smaller than 0. Right, peritoneal and distant metastases have distinct origins in the primary tumor. In this case, the origin ratio is expected to be larger than 0. d, Origin ratios for each peritoneal, locoregional, and liver metastases. Specifically, the origin ratio for peritoneal metastases is as described above, for locoregional metastases it is log2(min(LNDM)min(LNPT)) and for liver metastases it is log2(min(LivDM)min(LivPT)). Bootstrapped 95% confidence intervals based on 1,000 iterations of randomly resampled polyguanine markers. Confidence values for origin classifications are based on the upper bound of 80% or 95% confidence intervals. e, Peritoneal-liver metastasis origin ratios (log2(min(PMLiv)min(PMPT))) for peritoneal metastases arising before, synchronously with, or after liver metastases. Left, peritoneal metastases arising at least 3 months prior to the earliest detected liver metastasis; center, within 3 months of the earliest liver metastasis; right, at least 3 months after the earliest liver metastasis. f, Direct comparison of origin ratios for peritoneal, locoregional and liver lesions metastases (same data as in (d)). Locoregional point color differentiates lymph node metastases and tumor deposits. P-values and effect sizes based on independent pairwise comparisons using two-sided Wilcoxon rank sum tests. g, Summary schematic. Genetic diversity from the primary tumor (colored cells) is transferred most efficiently to locoregional metastases, less efficiently to peritoneal metastases, and least efficiently to liver metastases, resulting in decreasing inter-metastatic diversity across these host sites (inset). The broadness of tumor cell access to the relevant migration routes is high for cells undergoing lymphatic or hematogenous metastasis, and more restricted for cells undergoing peritoneal metastasis. By jointly evaluating broadness of access and inter-metastatic diversity, we deduce that selective pressures are highest during liver metastasis (see discussion for details).

References

    1. Al Bakir M. et al. The evolution of non-small cell lung cancer metastases in TRACERx. Nature 616, 534–542 (2023). - PMC - PubMed
    1. Turajlic S. et al. Tracking Cancer Evolution Reveals Constrained Routes to Metastases: TRACERx Renal. Cell 173, 581–594.e12 (2018). - PMC - PubMed
    1. McPherson A. et al. Divergent modes of clonal spread and intraperitoneal mixing in high-grade serous ovarian cancer. Nat. Genet. 48, 758–767 (2016). - PubMed
    1. Gundem G. et al. The evolutionary history of lethal metastatic prostate cancer. Nature 520, 353–357 (2015). - PMC - PubMed
    1. Hu Z. et al. Quantitative evidence for early metastatic seeding in colorectal cancer. Nat. Genet. 51, 1113–1122 (2019). - PMC - PubMed

Publication types

LinkOut - more resources