[Preprint]. 2025 Jan 31:2024.09.26.615226.
doi: 10.1101/2024.09.26.615226.

Tumor Cell Spatial Organization Directs EGFR/RAS/RAF Pathway Primary Therapy Resistance through YAP Signaling

Affiliations

Tumor Cell Spatial Organization Directs EGFR/RAS/RAF Pathway Primary Therapy Resistance through YAP Signaling

Rachel Nakagawa et al. bioRxiv. .

Abstract

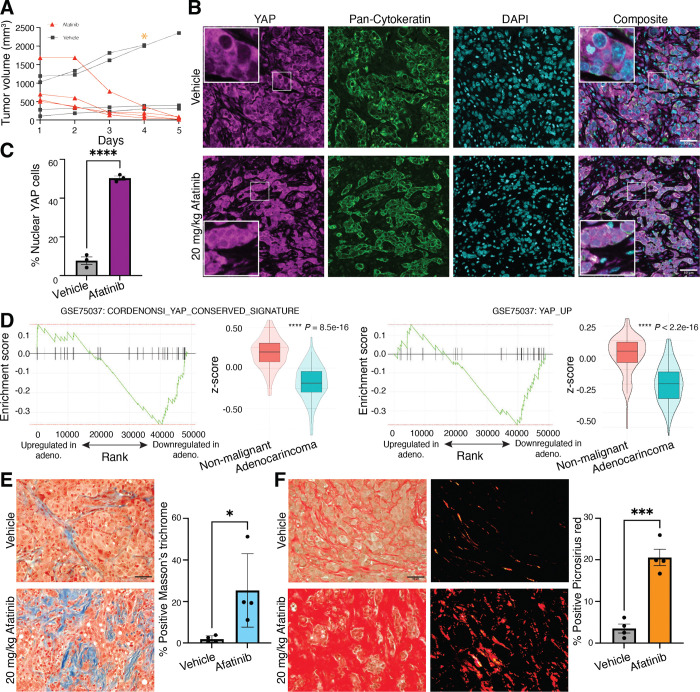
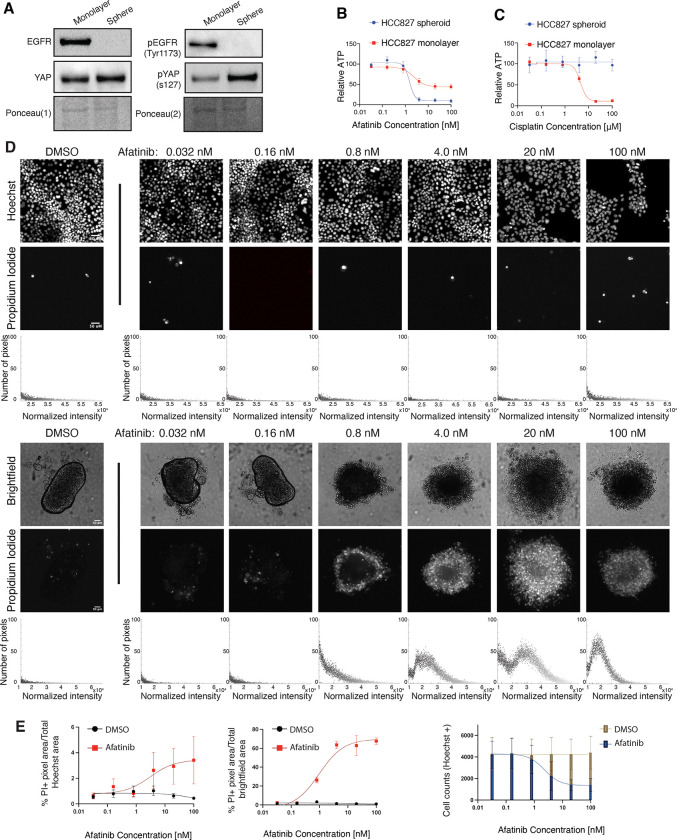
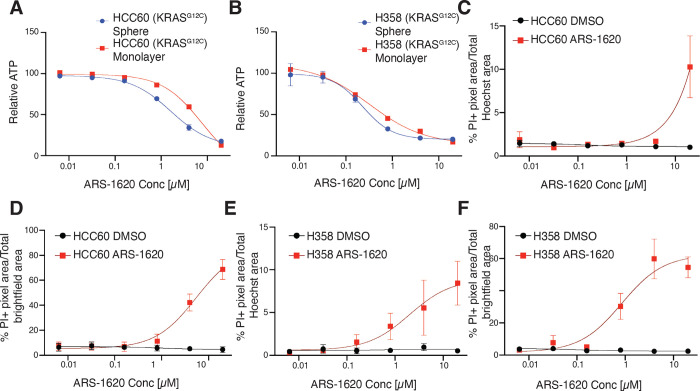
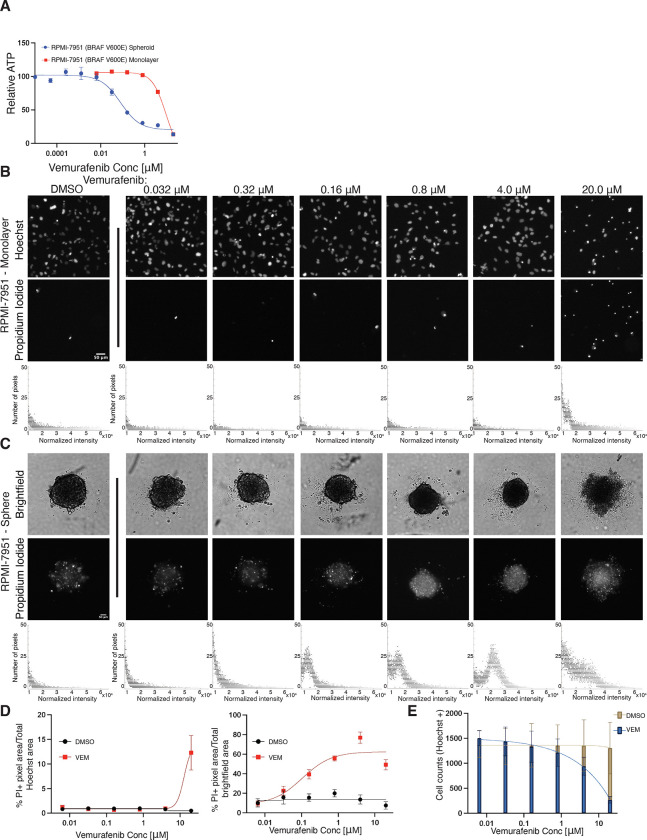
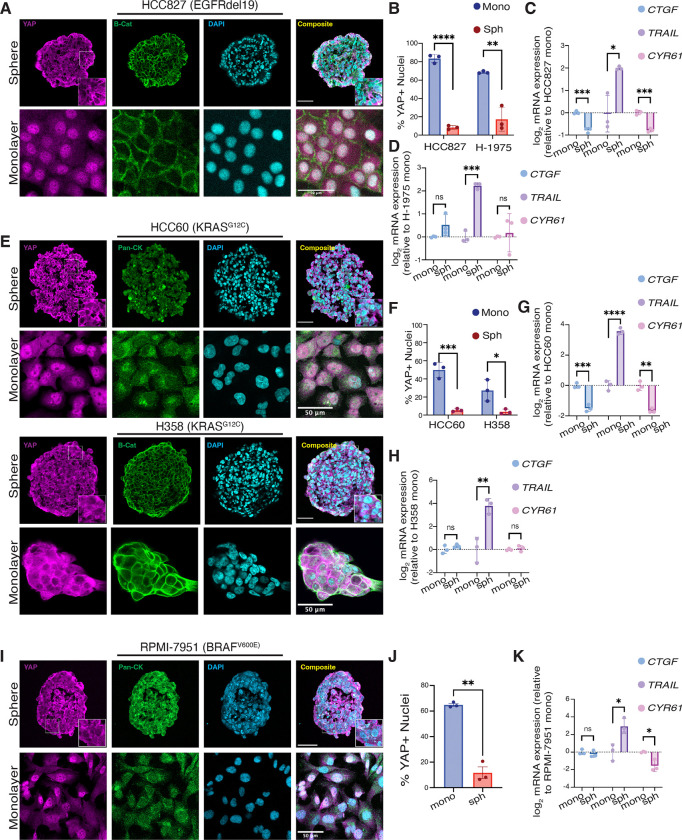
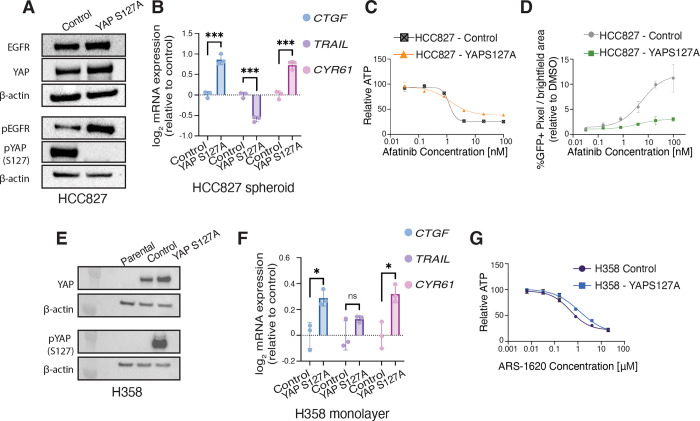
Non-small cell lung cancers (NSCLC) harboring common mutations in EGFR and KRAS characteristically respond transiently to targeted therapies against those mutations, but invariably, tumors recur and progress. Resistance often emerges through mutations in the therapeutic target or activation of alternative signaling pathways. Mechanisms of acute tumor cell resistance to initial EGFR (EGFRi) or KRASG12C (G12Ci) pathway inhibition remain poorly understood. Our study reveals that acute response to EGFR/RAS/RAF-pathway inhibition is spatial and culture context specific. In vivo, EGFR mutant tumor xenografts shrink by > 90% following acute EGFRi therapy, and residual tumor cells are associated with dense stroma and have increased nuclear YAP. Interestingly, in vitro EGFRi induced cell cycle arrest in NSCLC cells grown in monolayer, while 3D spheroids preferentially die upon inhibitor treatment. We find differential YAP nuclear localization and activity, driven by the distinct culture conditions, as a common resistance mechanism for selective EGFR/KRAS/BRAF pathway therapies. Forced expression of the YAPS127A mutant partially protects cells from EGFR-mediated cell death in spheroid culture. These studies identify YAP activation in monolayer culture as a non-genetic mechanism of acute EGFR/KRAS/BRAF therapy resistance, highlighting that monolayer vs spheroid cell culture systems can model distinct stages of patient cancer progression.

Keywords: ARS-1620; BRAFV600E; EGFR; KRASG12C; Non-small cell lung cancer (NSCLC); afatinib; monolayer; osimertinib; spheroid; vemurafenib.


Conflict of interest statement

Conflict of interest The authors have declared that no conflict of interest exists.

Figures

Figure 1.
Figure 1.. A persister phenotype in afatinib-treated tumor xenografts is driven by YAP activation.
(A) Mice harboring HCC827 tumor xenografts were treated with 20mg/kg afatinib for 5d (n = 4) or vehicle (n = 4). (B) Immunofluorescence images of YAP, pan-cytokeratin, and DAPI in afatinib-treated remnant and vehicle tumors (magnification, 20x). (C) Quantification of nuclear YAP in vehicle- or afatinib-treated HCC827 xenografts. (D) Gene-set enrichment (GSEA) of YAP signatures from differential expression of 83 matched sets of patient adenocarcinoma or non-malignant tissue using YAP_conserved_signature [Normalized Enrichment Score = −1.76, p = 0.0039] (left) or YAP_up [Normalized Enrichment Score = −1.69, p = 0.0068] (right) gene signature in the ranked genes. Average Z-scores for each gene set were compared between conditions using a t-test [P = 8.5e-16 and P < 2.2e-16, respectively]. (E) Representative images of Masson’s trichrome and quantification of percentage area coverage of collagen for vehicle-treated tumors and afatinib-treated remnant tumors are shown (magnification, 10x). (F) Representative images of Picrosirius red staining and quantification of percentage area coverage per field of view (magnification, 10x). All scale bars, 50 μm. Data are shown as means ± s.e.m. (n = 3 biological replicates). * P < 0.05, *** P < 0.001, **** P < 0.0001 as determined by a two-tailed t-test.
Figure 2.
Figure 2.. EGFR-mutated NSCLC spheroids, but not monolayers, acutely undergo massive apoptosis in response to EGFRi.
(A) HCC827 spheroids (96 hr) and monolayers (48 hr) were harvested for western blot analysis against indicated proteins. Ponceau S was used as a total protein loading control. (B) Dose response curves for HCC827 cells cultured as spheroids or monolayers and treated with afatinib. Curves normalized to DMSO. LogEC50 (ns) P value = 0.4 between monolayer (EC50 = 2.36 nM) and spheroid (EC50 = 1.52 nM). * P value = 0.0199 between monolayer (Bottom value = 44.16 relative ATP) and spheroid (Bottom value = 10.06 relative ATP). (C) Dose-response curves for HCC827 cells cultured as spheroids or monolayers and treated with cisplatin. Curves normalized to 0.9% NaCl vehicle. (D) Representative Hoechst (monolayer) or brightfield (spheres) and corresponding Propidium Iodide fluorescence of DMSO- or afatinib-treated HCC827 monolayers and spheroids at indicated doses (magnification, 4x). All scale bars, 50 μm. Total, normalized RFP+ fluorescence pixels across each representative image shown. (E) Dose-response curves of % Propidium Iodide pixels / total Hoechst (monolayer) or (F) brightfield (spheroid) pixel area in DMSO- or afatinib-treated HCC827 monolayers and spheroids. (n = 3 biological replicates). (G) Quantification of total cell numbers across indicated DMSO- or afatinib-treated HCC827 monolayer cultures. Relative ATP was measured by a Cell Titer Glo assay. Data are shown as means ± s.e.m. (n = 3 biological replicates). * P < 0.05, ** P < 0.01, **** P < 0.0001 as determined by Extra sum-of-squares F Test; n.s., not significant.
Figure 3.
Figure 3.. Distinct KRASG12C-mutant cell lines exhibit varying EC50 values in response to KRASG12C inhibition.
(A) Dose response curves of HCC60 spheroids or monolayers treated with ARS-1620 for 72h. Relative ATP was measured by a Cell Titer Glo assay. Curves normalized to DMSO. LogEC50 **** P value = < 0.0001 between monolayer (EC50 = 7.70 μM) and spheroid (EC50 = 1.62 μM). (B) Dose response curves of H358 spheroids or monolayers treated with ARS-1620 for 72h. Relative ATP was measured by a Cell Titer Glo assay. Curves normalized to DMSO. LogEC50 (ns) P value = 0.415 between monolayer (EC50 = 0.32 μM) and spheroid (EC50 = 0.23 μM). (C-D) Dose-response curves of % Propidium Iodide pixels / total Hoechst (monolayer) or brightfield (spheroid) pixel area in DMSO- or ARS-1620-treated HCC60 monolayers and spheroids. (E-F) Dose-response curves of % Propidium Iodide pixels / total Hoechst (monolayer) or brightfield (spheroid) pixel area in DMSO- or ARS-1620-treated H358 monolayers and spheroids. Data are shown as means ± s.e.m. (n = 3 biological replicates). **** P < 0.0001 as determined by Extra sum-of-squares F Test; n.s., not significant.
Figure 4.
Figure 4.. Vemurafenib resistant BRAFV600E mutant line, RPMI-7951, is sensitive to vemurafenib treatment in spheroid culture.
(A) Dose response curves of RPMI-7951 spheroids or monolayers treated with vemurafenib for 72h. Relative ATP was measured by a Cell Titer Glo assay. Curves normalized to DMSO. LogEC50 **** P value = < 0.0001 between monolayer (EC50 = 9.46 μM) and spheroid (EC50 = 0.08 μM). (B-C) Representative Hoechst (monolayer) or brightfield (spheres) and corresponding Propidium Iodide fluorescence of DMSO- or vemurafenib treated RPMI-7651 monolayers and spheroids at indicated doses (magnification, 4x). Total, normalized RFP+ fluorescence pixels across each image shown. (D) Dose-response curves of % Propidium Iodide pixels / total Hoechst (monolayer) or brightfield (spheroid) pixel area in DMSO- or vemurafenib-treated RPMI-7951 monolayers and spheroids. (E) Quantification of total cell numbers across indicated DMSO- or vemurafenib-treated RPMI-7951 monolayer cultures. Data are shown as means ± s.e.m. (n = 3 biological replicates). **** P < 0.0001 as determined by Extra sum-of-squares F Test.
Figure 5.
Figure 5.. YAP nuclear translocation mediates resistance to EGFR/RAS/RAF pathway inhibitors.
(A) Immunofluorescence images of YAP, β-catenin, and DAPI in EGFR mutant sphere (magnification, 20x) and monolayer (magnification, 10x) cultures. All scale bars 50μm. (B) Quantification of nuclear YAP to DAPI ratios in HCC827 and H1975 adherent monolayers and spheroids. Data are shown as means ± s.d. (C-D) qPCR analysis (CTGF, TRAIL,CYR61) in EGFR mutant spheroids normalized to monolayers. (E) Immunofluorescence images of YAP, pan-Cytokeratin (HCC60) or β-catenin (H358), and DAPI in KRASG12C mutant sphere and monolayer cultures (magnification, 20x). All scale bars 50μm. (F) Quantification of nuclear YAP to DAPI ratios in HCC60 and H358 adherent monolayers and spheroids. Data are shown as means ± s.d. (G-H) qPCR analysis (CTGF, TRAIL, CYR61) in KRAS mutant spheroids normalized to monolayers. (I) Immunofluorescence images of YAP, pan-cytokeratin, and DAPI in RPMI-7951 (BRAFV600E mutant) sphere and monolayer cultures (magnification, 20x). All scale bars 50μm. (J) Quantification of nuclear YAP to DAPI ratios in RPMI-7951 adherent monolayers and spheroids. Data are shown as means ± s.d. (K) qPCR analysis (CTGF, TRAIL, CYR61) in BRAF mutant spheroids normalized to monolayers. Data are shown as means ± s.d. (n = 3 biological replicates). * P < 0.05, ** P < 0.01, *** P < 0.001, **** P < 0.0001 as determined by a two-tailed t-test; n.s., not significant.
Figure 6.
Figure 6.. Increased YAP activity is sufficient to protect HCC827 spheroids from afatinib-mediated cell death.
(A) HCC827-control and HCC827-YAPS127A monolayers (48 hr) were harvested for western blot analysis against indicated proteins. (B) qPCR analysis (CTGF, TRAIL, CYR61) in HCC827-YAPS127A spheroids normalized to HCC827-control. Data are shown as means ± s.e.m. (n = 3 biological replicates). (C) Dose response curves for HCC827-control compared to HCC827-YAPS127A cells cultured as spheroids and treated with afatinib for 72 hr. Relative ATP was measured by a Cell Titer Glo assay. Curves normalized to DMSO. LogEC50 (ns) P value = 0.91 between control (EC50 = 1.21 nM) and YAPS127A (EC50 = 1.27 nM). * P value = 0.021 between HCC827-control (Bottom value = 25.98 relative ATP) and HCC827-YAPS127A (Bottom value = 38.21 relative ATP). (D) Dose-response curves of % GFP pixels / total brightfield pixel area in HCC827-control and HCC827-YAPS127A normalized to DMSO % GFP pixels / total brightfield pixel area. Data are shown as means ± s.e.m. (n = 3 biological replicates). (E) H358-parental, H358-control, and H358-YAPS127A monolayers (48 hr) were harvested for western blot analysis against indicated proteins. (F) qPCR analysis (CTGF, TRAIL, CYR61) in H358-YAPS127A monolayers normalized to H358-control. Data are shown as means ± s.e.m. (n = 3 biological replicates). (G) Dose response curves for H358-control compared to H358-YAPS127A cells cultured as spheroids and treated with ARS-1620 for 72 hr. Relative ATP was measured by a Cell Titer Glo assay. Curves normalized to DMSO. LogEC50 ** P value = 0.005 between H358-control (EC50 = 0.47 μM) and YAPS127A (EC50 = 1.18 μM). * P < 0.05, ** P < 0.01 as determined by Extra sum-of-squares F Test; n.s., not significant.

References

    1. Chevallier M., Borgeaud M., Addeo A. & Friedlaender A. Oncogenic driver mutations in non-small cell lung cancer: Past, present and future. World J. Clin. Oncol. 12, 217–237 (2021). - PMC - PubMed
    1. Molina J. R., Yang P., Cassivi S. D., Schild S. E. & Adjei A. A. Non-small cell lung cancer: epidemiology, risk factors, treatment, and survivorship. Mayo Clin. Proc. 83, 584–594 (2008). - PMC - PubMed
    1. Lynch T. J. et al. Activating mutations in the epidermal growth factor receptor underlying responsiveness of non-small-cell lung cancer to gefitinib. N. Engl. J. Med. 350, 2129–2139 (2004). - PubMed
    1. Huang M.-Y. et al. Comparing survival and subsequent treatment of first-line tyrosine kinase inhibitors in patients of advanced lung adenocarcinoma with epidermal growth factor receptor mutation. J. Formos. Med. Assoc. Taiwan Yi Zhi 121, 170–180 (2022). - PubMed
    1. Jänne P. A. et al. AZD9291 in EGFR inhibitor-resistant non-small-cell lung cancer. N. Engl. J. Med. 372, 1689–1699 (2015). - PubMed

Publication types

LinkOut - more resources