[Preprint]. 2025 Apr 30:2024.09.20.613996.
doi: 10.1101/2024.09.20.613996.

Expanding Automated Multiconformer Ligand Modeling to Macrocycles and Fragments

Affiliations

Expanding Automated Multiconformer Ligand Modeling to Macrocycles and Fragments

Jessica Flowers et al. bioRxiv. .

Update in

Abstract

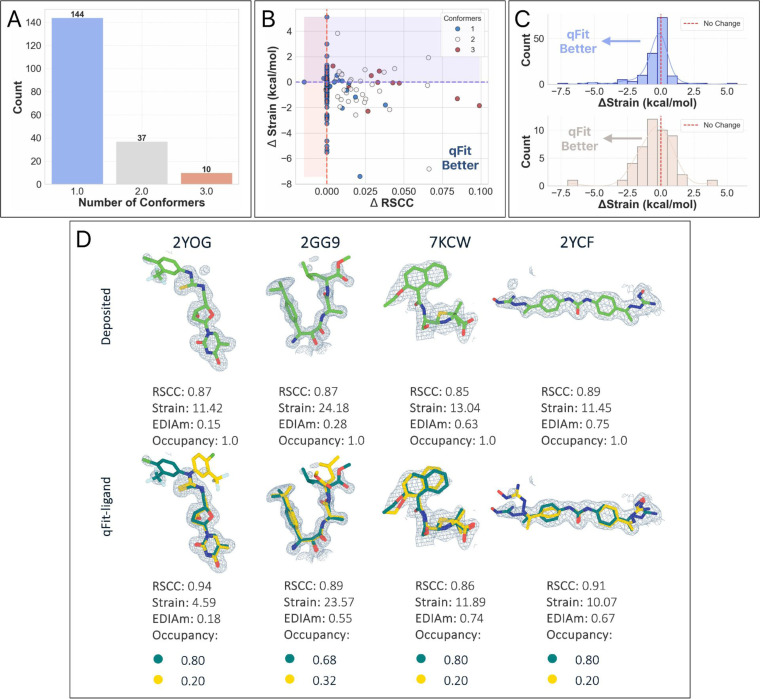
Small molecule ligands exhibit a diverse range of conformations in solution. Upon binding to a target protein, this conformational diversity is reduced. However, ligands can retain some degree of conformational flexibility even when bound to a receptor. In the Protein Data Bank (PDB), a small number of ligands have been modeled with distinct alternative conformations that are supported by macromolecular X-ray crystallography density maps. However, the vast majority of structural models are fit to a single ligand conformation, potentially ignoring the underlying conformational heterogeneity present in the sample. We previously developed qFit-ligand to sample diverse ligand conformations and to select a parsimonious ensemble consistent with the density. While this approach indicated that many ligands populate alternative conformations, limitations in our sampling procedures often resulted in non-physical conformations and could not model complex ligands like macrocycles. Here, we introduce several improvements to qFit-ligand, including integrating RDKit for stochastic conformational sampling. This new sampling method greatly enriches low energy conformations of small molecules and macrocycles. We further extended qFit-ligand to identify alternative conformations in PanDDA-modified density maps from high throughput X-ray fragment screening experiments, as well as single-particle cryo-electron microscopy (cryo-EM) density maps. The new version of qFit-ligand improves fit to electron density and reduces torsional strain relative to deposited single conformer models and our prior version of qFit-ligand. These advances enhance the analysis of residual conformational heterogeneity present in ligand-bound structures, which can provide important insights for the rational design of therapeutic agents.


Conflict of interest statement

Conflicts of Interest J.S.F. is a consultant to, shareholder of, and receives sponsored research support from Relay Therapeutics and a consultant to and shareholder of Vilya Therapeutics. H.v.d.B. is an employee of Atomwise Inc, but the work in this publication does not overlap with his role there. A.R.R. is a co-founder of TheRas, Elgia Therapeutics, and Tatara Therapeutics, and receives sponsored research support from Merck, Sharp and Dohme.

Figures

Figure 1.
Figure 1.
qFit-ligand algorithm workflow. All ligands undergo three preliminary searches: unconstrained, fixed terminal atoms, and blob search, allowing varying degrees of freedom (A-C). If the ligand has short or long side chains, the algorithm progresses to more specialized searches: branch search for ligands with side chains of at least four atoms (D), and long chain search for those exceeding 30 atoms (E). The algorithm then determines the best fit of generated conformers to electron density through quadratic programming, followed by additional sampling with rotations and translations (F). The remaining conformers then undergo quadratic and mixed-integer quadratic programming to ensure that only the most well-supported conformers are included in the final model.
Figure 2.
Figure 2.
Analysis of ligand conformations generated by qFit-ligand. (A) Differences in RSCC (x-axis) and torsion strain (y-axis) between qFit-ligand predicted structures and modified true positives. The lower right quadrant shows structures for which we improve both RSCC and strain. (B) Gallery of examples for which the new qFit-ligand models have improved RSCC, strain, and EDIAm compared to the modified true positives. The composite omit density map is contoured at 1σ for every structure. (C) Differences in EDIAm between qFit-ligand models and modified true positives. Positive delta values indicate structures where the qFit-ligand model is better fit to the experimental density. (D) Differences in RSCC and torsion strain between the new qFit-ligand and the prior qFit-ligand. The lower right quadrant shows structures for which we improve both RSCC and strain.
Figure 3.
Figure 3.
(A) RSCC of the synthetic true benchmark structures plotted against map resolution (in Ångstroms) for different conformer occupancy ratios, showing a decrease in RSCC with deteriorating map resolution. (B) RSCC of qFit-ligand generated multiconformer models, plotted against map resolution and grouped by conformer occupancy split. (C) RMSD between the closest qFit-ligand conformer and the true ‘B’ conformer. (D, left) True structure and qFit-ligand predicted structure of 3SC multiconformer ligand with a map resolution of 0.8 Å and conformer occupancy split of 0.50/0.50. (D, right) True structure and qFit-ligand predicted structure of 3SC multiconformer ligand with a map resolution of 0.8 Å and conformer occupancy split of 0.80/0.20.
Figure 4.
Figure 4.
Analysis of ligand conformations generated by qFit-ligand on the un-biased modified true positive dataset. (A) Distribution of the number of conformers output by qFit-ligand. (B) Differences in RSCC and torsion strain between the qFit-ligand models and the modified true positives. The lower right quadrant shows structures for which we improve both RSCC and strain. (C) Differences in EDIAm values between the qFit-ligand models and the modified true positives. Bars to the right of the vertical axis represent structures where the qFit-ligand model fits better to the electron density map.
Figure 5.
Figure 5.
(A) Distribution of the number of conformers modeled by qFit-ligand across 191 deposited structures with ligand torsional strain >10 kcal/mol. (B) RSCC and strain differences in the refined deposited models and the qFit-ligand predicted models. The lower right quadrant shows structures for which we improve both RSCC and strain. (C, top) Differences in torsion strain between the qFit-ligand models and the refined deposited models for structures where qFit-ligand predicted a single conformer model. Negative delta values, all bars to the left of the vertical axis, represent structures for which the qFit-ligand model has a lower strain. (C, bottom) Differences in torsion strain between the qFit-ligand models and the refined deposited models for structures where qFit-ligand predicted a multiconformer model. Negative delta values, all bars to the left of the vertical axis, represent structures for which the qFit-ligand model has a lower strain. (D) Gallery of examples for which qFit-ligand successfully recovers well-fitting alternate conformers, and therefore reduces strain. The composite omit density map is contoured at 1σ for every structure.
Figure 6.
Figure 6.
Evaluation of qFit-ligand predicted macrocycle conformations. (A) Differences in RSCC and torsion strain between qFit-ligand predicted structures and refined deposited single conformer macrocycles. The lower right quadrant shows structures for which we improve both RSCC and strain. (B) Differences in EDIAm values between the qFit-ligand and deposited models. Bars to the right of the vertical axis represent structures where the qFit-ligand model fits better to the electron density map. (C) Gallery of examples for which the qFit-ligand models have improved RSCC and strain compared to the deposited single conformer macrocycle ligand. The composite omit density map is contoured at 1σ for every structure.
Figure 7.
Figure 7.
(A) RMSD between the deposited ‘B’ conformer and the closest qFit-ligand conformer. Lower values correlate with a closer recapitulation of the deposited heterogeneity. (B) RSCC and torsion strain differences in the deposited models and the qFit-ligand predicted models. The lower right quadrant shows structures for which we improve both RSCC and strain. (C) Differences in EDIAm values between the qFit-ligand and modified true positive models. Bars to the right of the vertical axis represent structures where the qFit-ligand model fits better to the event map. (D) Gallery of examples for which qFit-ligand successfully recovers well-fitting alternate conformers. The composite omit density map is contoured at 1σ for every fragment.
Figure 8.
Figure 8.
Gallery of the four cryo-EM structures with deposited model, modified true positive, and qFit-ligand structure. In each case, the qFit-ligand model outperforms the modified true positive model in all validation metrics. The EDM density map is contoured at 1σ for every structure.

References

    1. Chang C.-E. A., Chen W. & Gilson M. K. Ligand configurational entropy and protein binding. Proceedings of the National Academy of Sciences 104, 1534–1539 (2007). - PMC - PubMed
    1. Wankowicz S. A. & Fraser J. S. Comprehensive encoding of conformational and compositional protein structural ensembles through the mmCIF data structure. IUCrJ 11, 494–501 (2024). - PMC - PubMed
    1. Wankowicz S. A., de Oliveira S. H., Hogan D. W., van den Bedem H. & Fraser J. S. Ligand binding remodels protein side-chain conformational heterogeneity. Elife 11, (2022). - PMC - PubMed
    1. Nicholls R. A. Ligand fitting with CCP4. Acta Crystallogr D Struct Biol 73, 158–170 (2017). - PMC - PubMed
    1. van Zundert G. C. P. et al. qFit-ligand Reveals Widespread Conformational Heterogeneity of Drug-Like Molecules in X-Ray Electron Density Maps. J. Med. Chem. (2018) doi: 10.1021/acs.jmedchem.8b01292. - DOI - PMC - PubMed

Publication types