[Preprint]. 2024 Sep 26:2024.09.25.614981.
doi: 10.1101/2024.09.25.614981.

An atlas of RNA-dependent proteins in cell division reveals the riboregulation of mitotic protein-protein interactions

Affiliations

An atlas of RNA-dependent proteins in cell division reveals the riboregulation of mitotic protein-protein interactions

Varshni Rajagopal et al. bioRxiv. .

Update in

Abstract

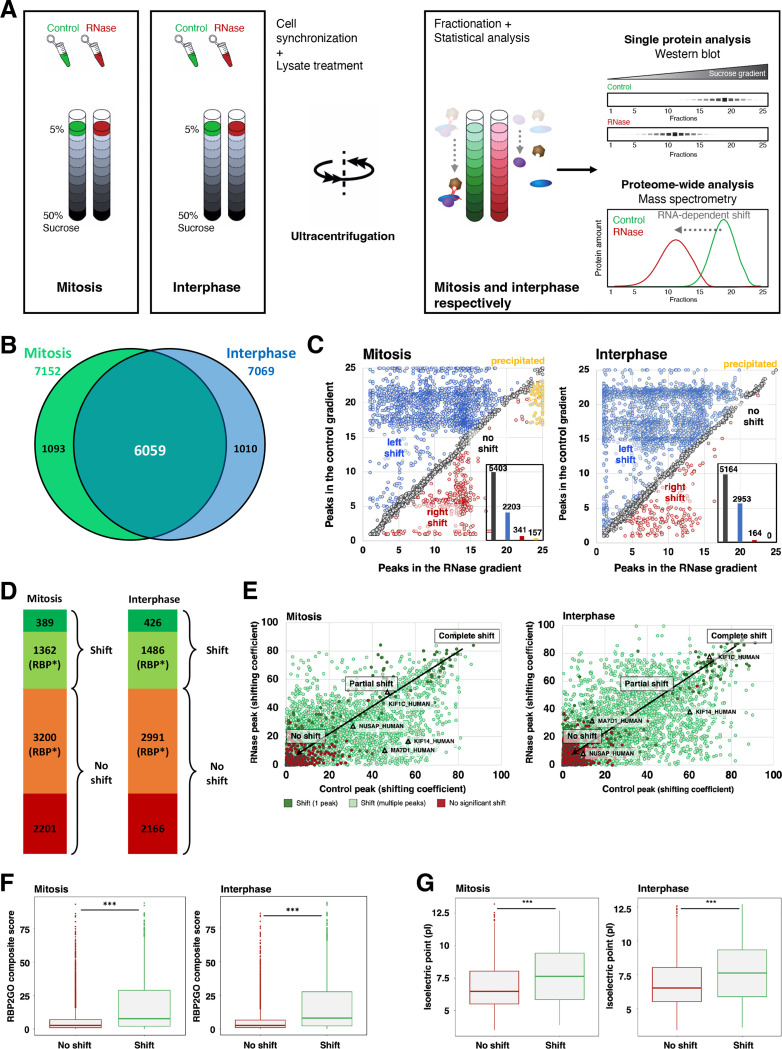
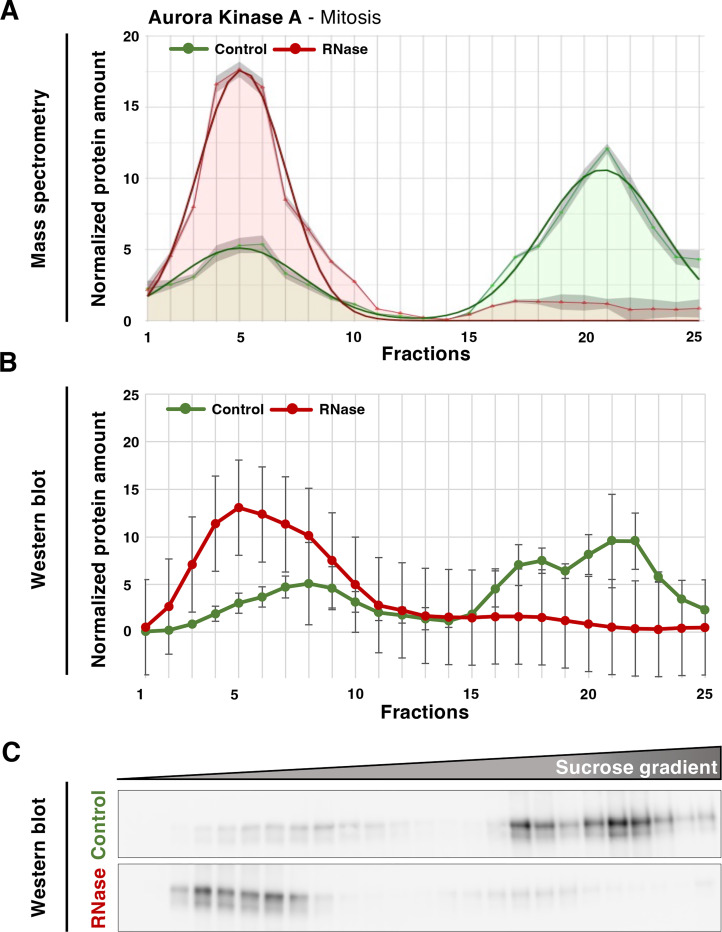
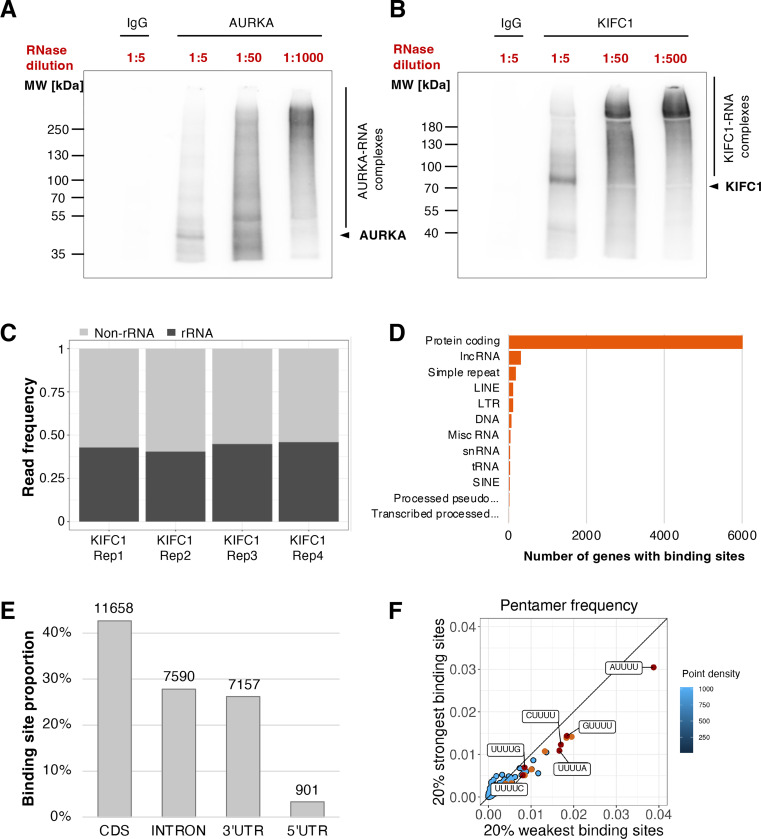
Ribonucleoprotein complexes are dynamic assemblies of RNA with RNA-binding proteins (RBPs), which can modulate the fate of the RNA molecules from transcription to degradation. Vice versa, RNA can regulate the interactions and functions of the associated proteins. Dysregulation of RBPs is linked to diseases such as cancer and neurological disorders. RNA and RBPs are present in mitotic structures like the centrosomes and spindle microtubules, but their influence on mitotic spindle integrity remains unknown. Thus, we applied the R-DeeP strategy for the proteome-wide identification of RNA-dependent proteins and complexes to cells synchronized in mitosis versus interphase. The resulting atlas of RNA-dependent proteins in cell division can be accessed through the R-DeeP 3.0 database (R-DeeP3.dkfz.de). It revealed key mitotic factors as RNA-dependent such as AURKA, KIFC1 and TPX2 that were linked to RNA despite their lack of canonical RNA-binding domains. KIFC1 was identified as a new interaction partner and phosphorylation substrate of AURKA at S349 and T359. In addition, KIFC1 interacted with both, AURKA and TPX2, in an RNA-dependent manner. Our data suggest a riboregulation of mitotic protein-protein interactions during spindle assembly, offering new perspectives on the control of cell division processes by RNA-protein complexes.

Keywords: RNA-binding proteins; mitotic factors; protein-protein interactions; riboregulation.


Conflict of interest statement

Declaration of interests S.D. is co-owner of siTOOLs Biotech, Martinsried, Germany, without relation to this work. The other authors disclose no conflicts of interest. This study is part of the PhD thesis of V.R.

Figures

Figure 1.
Figure 1.. R-DeeP in HeLa mitotic and interphasic cells
A: HeLa mitotic or interphasic untreated (control) or RNase-treated cell lysates were prepared and loaded onto sucrose density gradients (5%–50%). Following ultracentrifugation, the gradients were fractionated into 25 fractions and subjected to either mass spectrometry (proteome-wide screen) or western blot analysis (individual protein analysis) for validation of the screens (N=3 in total). Adapted from (26). B: Venn diagram indicating the total number of proteins identified in each R-DeeP screen (mitosis: 7152 and interphase: 7069). 6059 proteins were commonly identified. C: Each graph (mitosis and interphase, respectively) indicates the position of maxima for each shift in the control and RNase-treated gradients according to the mean of three replicates. The inset bar graph shows the number of proteins in each sub-category (left shift: blue, right shift: red, no shift: gray and precipitated proteins: orange). D: Classification of the proteins analyzed in the R-DeeP mitotic and interphasic screens according to their shifting behavior and their prior classification in 43 proteome-wide human studies. RNA-dependent proteins not linked to RNA before - in mitosis screen: 389 and interphase screen: 426. RBP*: validated RBPs or RBP candidates. E: Graph depicting the shifting co-efficient of the proteins for each pair of control and RNase peaks. Red: No significant shift, dark green: significant shift from one control peak to one RNase peak, light green: shifts between multiple peaks. For shifts between multiple peaks, they are further categorized as complete shifts: total amount of protein shifting between control and RNase gradients (top right of the graph), partial shift: a of protein shifting between control and RNase gradients (middle) and no shift: no change in shifting pattern (bottom left of the graph). Representative microtubule-related proteins are highlighted on the graph. F: Boxplots representing the distribution of the RBP2GO composite score of the proteins classified as non-shifting (No shift) or shifting (Shift). The bar and the box indicate the lower, the median and the upper quartiles. The whiskers represent the range between the bottom of the first quartile and the top of the third quartile, excluding the outliers. The outliers are represented by dots and the p-value was calculated using a Wilcoxon test (*** P-value < 0.001). G: Boxplots representing the isoelectric point (pI) of the proteins classified as non-shifting (No shift) or shifting (Shift). The bar and the box indicate the lower, the median and the upper quartiles. The whiskers represent the range between the bottom of the first quartile and the top of the third quartile, excluding the outliers. The outliers are represented by dots and the p-value was calculated using a Wilcoxon test (*** P-value < 0.001).
Figure 2.
Figure 2.. An atlas of RNA-dependent proteins in cell division
A: Schematic representation of a mitotic spindle showing the localization of 826 RNA-dependent proteins (out of 1472 proteins in total) to mitotic structures, based on their association with the respective GO terms. Data from the 43 proteome-wide human RBP screens as compiled in the RBP2GO database were used. The numbers indicate the number of proteins in each group. Only a random subset of the proteins are listed in this figure. The complete dataset can be found in Supplementary Table S2. B: Same as in A for mitotic proteins involved in different cell cycle transitions. Proteins indicated in bold represent the shifting proteins as identified in our present R-DeeP screen in mitosis. Their complete mitotic profile is available within the R-DeeP3 database (R-DeeP3.dkfz.de).
Figure 3.
Figure 3.. AURKA is an RNA-dependent protein in mitosis
A: Graphical representation of the protein amount in 25 different fractions of control (green) and RNase-treated (red) sucrose density gradients analyzed by mass spectrometry. Raw data (mean of three replicates) are depicted by line with markers. Smooth lines represent the respective Gaussian fit. The overall protein amount of the raw data was normalized to 100. B: Graph showing the quantitative analysis of western blot (WB) replicates depicted by the mean of three replicates with standard error of the mean (SEM, N=3). C: Western blot representing the distribution of AURKA in 25 different fractions in control and RNase-treated mitotic gradients.
Figure 4.
Figure 4.. RNA-dependent protein interactors of AURKA
A: Pie chart showing the percentage of AURKA protein interactors that are RNA-dependent (orange) or - independent (blue), according to RBP2GO and our new mitotic R-DeeP screen (12), and identified by AURKA pulldown and mass spectrometry analysis in HeLa cells synchronized in mitosis (N=3). A complete list is available in Supplementary Table S3. B: Selected examples of AURKA RNase-sensitive mitotic factors (orange) and RNase-insensitive protein interactors (blue), as detected from the AURKA pulldown in presence or absence of RNase treatment. A complete list is available in Supplementary Table S3. C: R-DeeP profile of KIFC1 in mitosis and WB validation as for AURKA (see Figure 3). D: Western blot (WB) analysis showing the immunoprecipitation of AURKA in mitotic HeLa cells. AURKA pulldown was performed in the mitotic lysate treated with or without RNase I. Rabbit IgG was used as a negative control. KIFC1 (74 kDa) and TPX2 (86 kDa) were pulled down with AURKA (46 kDa) in control samples whereas their interaction was significantly reduced upon RNase treatment (reduction of the band intensity for KIFC1 and TPX2 in the last lane). E: Graph representing the amount of KIFC1 and TPX2 present in IgG and AURKA pulldown samples treated with or without RNase I. The intensity of the WB bands were quantified using Image J and represented in the bar graph with SEM (N=3). P-values were evaluated using a two-tailed, paired t-test (** P-value < 0.01, *** P-value < 0.001). F: Representative proximity ligation assay (PLA) images indicating the close proximity of AURKA and KIFC1 in HeLa cells across the cell cycle (interphase to telophase as indicated). The interaction is represented by dots (PLA channel, red dots in the merge channel), AURKA was stained per immunofluorescence (green) and DNA was stained using DAPI (blue). Controls of the PLA assay and quantifications are seen in Supplementary Figure S4 (part 1). Scale bar, 10 μm. G and H: PLA representative images showing the proximity of AURKA and KIFC1 in HeLa cells at prometaphase and metaphase, respectively, (PLA channel, red dots in the merge channel). AURKA is seen in green (immunostaining) and DNA was stained using DAPI (blue). The top images depict representative images in control cells. Bottom images depict representative images in RNase-treated cells. Scale bar, 10 μm.
Figure 5.
Figure 5.. RNA mediating the interaction of AURKA, KIFC1 and TPX2
A and B: Autoradiography indicating the direct binding of AURKA and KIFC1, respectively, to RNA by iCLIP2 indicated by shifting of the radioactive RNA signal towards higher molecular weights with decreasing RNase I concentrations in HeLa prometaphase cells (representative images out of N=3 replicates are shown). C: Bar plot depicting the ribosomal RNA (rRNA) and non-ribosomal RNA (non-rRNA) read frequencies in individual KIFC1 iCLIP2-Seq replicates in HeLa prometaphase cells. D: Horizontal bar plot showing the KIFC1 target non-rRNA gene spectrum with number of genes identified in iCLIP2 in HeLa prometaphase cells in decreasing order. The genes are classified as protein coding, lncRNA, simple repeat, LINE, LTR, DNA, Misc RNA, snRNA, tRNA, SINE, processed pseudogene and transcribed processed pseudogene. E: Bar plot representing the proportion of binding sites in the respective transcript regions of protein coding genes. F: Scatter plot comparing the pentamer frequency within the 7-nt binding sites in the 20% strong binding sites vs. 20% weakest binding sites as defined by the PureCLIP score. The pentamers with the most extreme frequencies are colored in orange and red and contain U-stretches.
Figure 6.
Figure 6.. AURKA phosphorylates KIFC1 at S349 and T359 amino acid residues
A: Schematic representation of KIFC1 indicating the location of the kinase domain and the position of disordered regions across the KIFC1 structure. B: Schematic representation of KIFC1 indicating the position of eight potential phosphorylation sites (highlighted in green) that were identified based on the consensus sequence of AURKA (27). The schematic was generated using AlphaFold (alphafold.ebi.ac.uk). C: Autoradiography indicating the phosphorylation intensity of KIFC1 in wild-type (WT) and non-phosphorylatable KIFC1 mutants in the presence of purified AURKA WT or AURKA kinase-dead mutant (D274A). The in vitro kinase assay was performed using KIFC1 pulled down from HeLa prometaphase lysates overexpressing the WT or mutant KIFC1 proteins with an N-terminal Flag-HA tag. An empty vector was used as a negative control. D: Quantification of the autoradiography image (as in C), representing the KIFC1 phosphorylation signal in the from of a bar graph with SEM (N=3). P-values were calculated using two-tailed, paired t-test (** P-value < 0.01).

References

    1. Dreyfuss G., Kim V.N. and Kataoka N. (2002) Messenger-RNA-binding proteins and the messages they carry. Nat Rev Mol Cell Biol, 3, 195–205. - PubMed
    1. Mitchell S.F. and Parker R. (2014) Principles and properties of eukaryotic mRNPs. Mol Cell, 54, 547–558. - PubMed
    1. Gebauer F., Schwarzl T., Valcarcel J. and Hentze M.W. (2021) RNA-binding proteins in human genetic disease. Nat Rev Genet, 22, 185–198. - PubMed
    1. Mayr C. (2017) Regulation by 3’-Untranslated Regions. Annu Rev Genet, 51, 171–194. - PubMed
    1. Hentze M.W., Castello A., Schwarzl T. and Preiss T. (2018) A brave new world of RNA-binding proteins. Nat Rev Mol Cell Biol, 19, 327–341. - PubMed

Publication types

LinkOut - more resources