[Preprint]. 2024 Nov 13:2024.09.27.615294.
doi: 10.1101/2024.09.27.615294.

Charting cortical-layer specific area boundaries using Gibbs' ringing attenuated T1w/T2w-FLAIR myelin MRI

Affiliations

Charting cortical-layer specific area boundaries using Gibbs' ringing attenuated T1w/T2w-FLAIR myelin MRI

Joonas A Autio et al. bioRxiv. .

Abstract

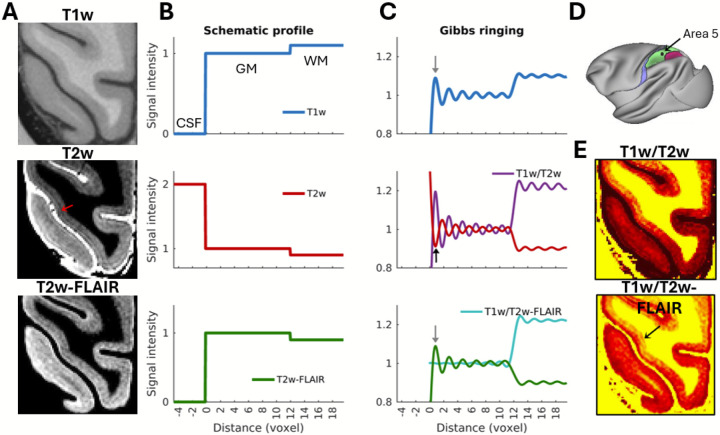
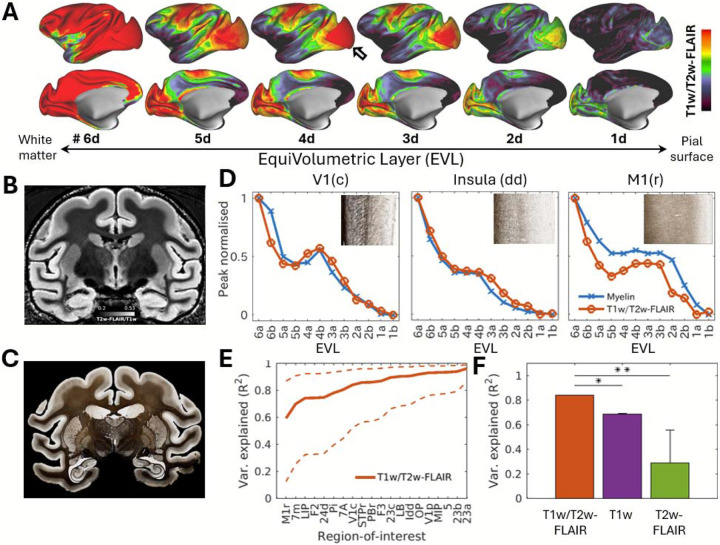
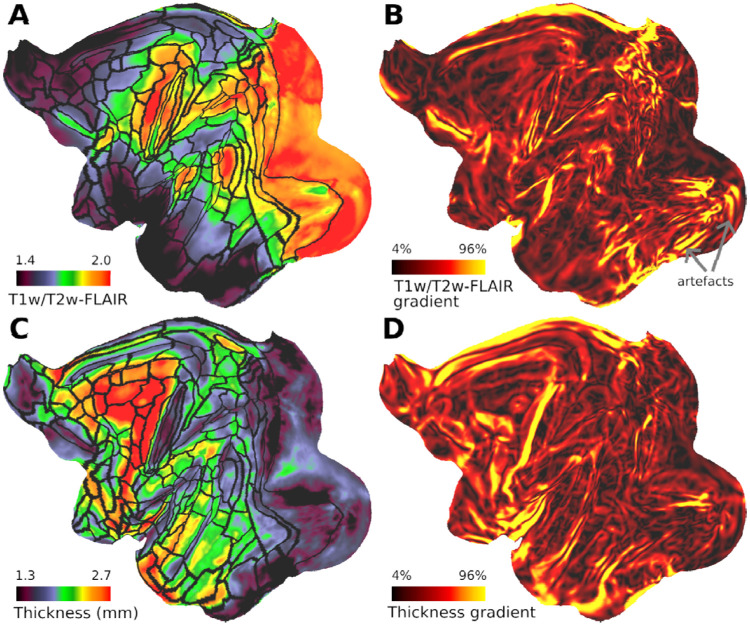
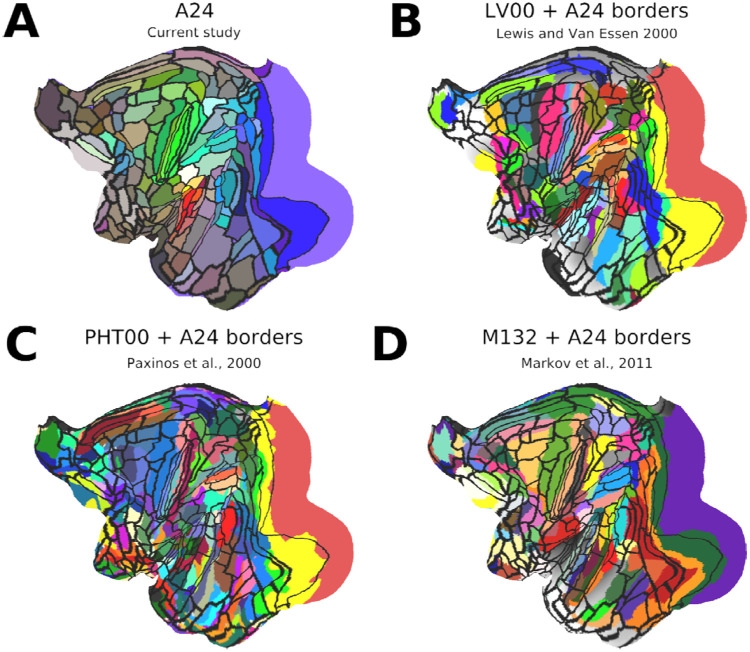
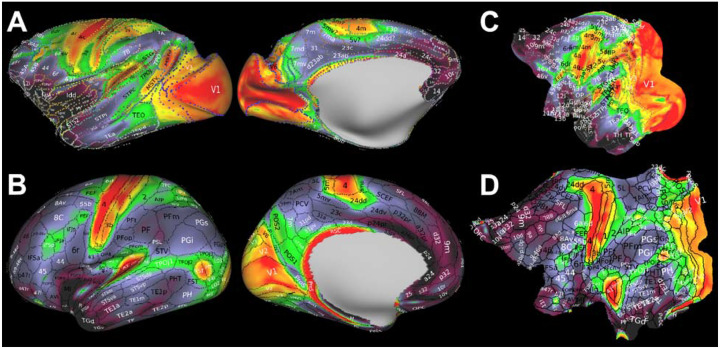
Cortical areas have traditionally been defined by their distinctive layer cyto- and/or myelo- architecture using postmortem histology. Recent studies have delineated many areas by measuring overall cortical myelin content and its spatial gradients using the T1w/T2w ratio MRI in living primates, including humans. While T1w/T2w studies of areal transitions might benefit from using the layer profile of this myelin-related contrast, a significant confound is Gibbs' ringing artefact, which produces signal fluctuations resembling cortical layers. Here, we address these issues with a novel approach using cortical layer thickness-adjusted T1w/T2w-FLAIR imaging, which effectively cancels out Gibbs' ringing artefacts while enhancing intra-cortical myelin contrast. Whole-brain MRI measures were mapped onto twelve equivolumetric layers, and layer-specific sharp myeloarchitectonic transitions were identified using spatial gradients resulting in a putative 182 area/subarea partition of the macaque cerebral cortex. The myelin maps exhibit notably high homology with those in humans, suggesting cortical myelin shares a similar developmental program across species. Comparison with histological Gallyas myelin stains explains over 80% of the variance in the laminar T1w/T2w-FLAIR profiles, substantiating the validity of the method. Altogether, our approach provides a novel, noninvasive means for precision mapping layer myeloarchitecture in the primate cerebral cortex, advancing the pioneering work of classical neuroanatomists.

Keywords: Gibbs’ artefact; Layer; Macaque; Myelin; Primate.


Figures

Figure 1.
Figure 1.. Attenuating Gibbs’ Ringing Artefact using T1w and T2w-FLAIR ratio.
(A) Representative magnified view of cortex displaying T1w, T2w and T2w-FLAIR contrasts. Images are a combination of true anatomical contrast and Gibbs ringing artefacts. In the T2w image, the red arrow denotes a distinct Gibbs’ ringing artefact which resembles cortical layers. (B, C) Simulation of Gibbs’ ringing artefact. Sharp positive signal intensity transitions cause an initial overshoot followed by sinc-pattern decay (grey arrows), while negative signal-intensity transitions cause an undershoot (black arrow) in the outermost voxel in grey matter (GM). Note that the phase of Gibbs’ ringing artefact is reversed by fluid-attenuated inversion-recovery (FLAIR; bottom panel, grey arrow). The magnitude of truncation artefact varies based on signal intensity difference between tissues (e.g. contrast between CSF, GM and WM). (C) The in-phase ringing artefacts can be effectively attenuated by dividing T1w by T2w-FLAIR (cyan line; bottom panel). In contrast, T1w divided by T2w amplifies the ringing artefact due to the opposing phase of the Gibbs’ overshoot (purple line; middle panel). (D) Location of magnified view. Area 5, known for the relatively wide inner and narrow external band of Baillarger, is highlighted in green. (E) T1w/T2w (upper panel) and T1w/T2w-FLAIR (bottom panel) exhibit notable image contrast differences across cortical layers.
Figure 2.
Figure 2.. Validating Laminar Myelin Mapping.
(A) Average T1w/T2w-FLAIR representative equivolumetric layers (EVLs) show that deep layers (left) exhibit relatively higher myelination in comparison to superficial layers (right) throughout the macaque cerebral cortex (N=7). The grey arrow indicates the outer band of Baillarger in V1. Representative sections from (B) T1w/T2w-FLAIR ratio and (C) Gallyas myelin histology. For visualisation purposes, the T1w/T2w-FLAIR ratio is inverted (e.g., T2w-FLAIR/T1w). (D) Exemplar peak normalised layer profiles of Gallyas myelin stain (blue line) and T1w/T2w-FLAIR ratio (orange line). Snippets show myelin histology from respective cortical areas. (E) T1w/T2w-FLAIR is highly correlated with myeloarchitecture (n=20). (F) Compared to T1w and T2w-FLAIR, T1w/T2w-FLAIR provided significantly improved correlations with layer myeloarchitecture (*p < 10−4, **p < 10−15, paired t-test).
Figure 3.
Figure 3.. Charting cortical area boundaries using cortical layer-specific myeloarchitectonic transitions.
(A) Zoomed view of sensorimotor cortex in representative equivolumetric layers (EVL) 3d and 5d displayed on a flat-map. (B) T1w/T2w-FLAIR gradients are prominent in EVL3d but less so in EVL5d. (C) Gallya’s myelin stain from somatomotor cortices. Yellow dashed lines indicate area boundaries. (D) Cortical thickness normalised laminar profiles of representative myelin stains. Notably, large myelin density differences are observed in superficial layers (e.g., EVL3s), whereas deeper layers exhibit more modest differences (e.g. EVL5s). Abbreviations: M1c: caudal Primary Motor Cortex caudal (Rathelot et al., 2009); M1t: transitory primary motor cortex (current study).
Figure 4.
Figure 4.. Equivolumetric Layer-specific Myelin Transitions provide Improved Sensitivity to Cortical Area Boundaries Compared to Midthickness-weighted Gradients.
(A) Midthickness-weighted T1w/T2w-FLAIR overlaid with parcel boundaries determined using layer-specific T1w/T2w-FLAIR gradients (black contours). (B) Midthickness-weighted T1w/T2w-FLAIR gradients exhibit notably lower number of areal gradient-ridges due to reduced specificity to layer-specific myeloarchitectonic transitions. Grey arrows indicate artefacts. (C) Cortical thickness and its (D) gradients.
Figure 5.
Figure 5.. Comparison of Cortical Area Atlases from Four Studies.
(A) Cortical area boundaries estimated in the current study using layer-specific myeloarchitectonic transitions. (B) Lewis and Van Essen (LV00) multi-modal histology atlas (Lewis and Van Essen 2000). (C) Paxinos, Huang, and Toga (PHT00) multi-modal histology atlas (Paxinos et al., 2000). (D) M132 cytoarchitecture atlas (Markov et al., 2011). Each atlas is overlaid with borders (black contours) estimated in the current study. The LV00, PHT00 and M132 atlases were compiled by Van Essen and colleagues (Van Essen et al., 2012) and obtained from the BALSA repository (Van Essen et al., 2017). Note that different macaque species were used in the studies: A24 macaque mulatta (rhesus); LV00 macaque fascicularis (cynomolgus); PHT00: macaque mulatta and M132: macaque fascicularis. Data at https://balsa.wustl.edu/TBA.
Figure 6.
Figure 6.. Laminar Myeloarchitecture Intricately Links with Cortical Hierarchy.
(A) Midthickness-weighted and (B) equivolumetric layer (EVL) T1w/T2w-FLAIR myelin ordered according to (C) dendrogram. (D) Euclidean distance similarity matrix. (E) Clusters distribution displayed on a flat-map and (F) their average laminar profiles. Error-bar indicates standard deviation across cluster parcels. (G) T1w/T2w-FLAIR equivolumetric layers were highly correlated with the hierarchy levels of the ventral and dorsal visual streams. Hierarchy levels were determined using feedforward and feedback connections and obtained from the literature (Van Essen et al., 1991). (H) Integrated model of dual counter-stream architecture and bands of Baillarger (Markov et al., 2013). Feedforward (FF; red lines) and feedback (FB; blue lines) projections. FF and FB pathways, as well as the inner and outer bands of Baillarger, receive substantial contributions from distinct thalamic nuclei (Rockland et al.,1989, Jones 2001, Hubel et al., 1972). Abbreviations: CM: Centromedial Nucleus; LGN: Lateral Geniculate Nucleus; MDN: MedioDorsal Nucleus; MGN: Medial Geniculate Nucleus; RTN: Reticular Nucleus; VL/VA: Ventral Lateral/Ventral Anterior Nucleus; VPN: Ventral Posterior Nucleus.
Figure 7.
Figure 7.. Comparison of macaque and human parcellation of cerebral cortex.
(A) Macaque 182-area boundaries delineated using T1w/T2w-FLAIR laminar myelin MRI. (B) The human connectome project 180-area parcellation delineated using multi-modal MRI (Glasser et al., 2016). (C, D) Parcellations displayed on cortical flat-maps. Parcellations are overlaid on midthickness-weighted myelin maps. Putative homologies beyond primary sensory areas can be identified by myelin and topographic organisation between cortical areas. Data at https://balsa.wustl.edu/TBA.

Similar articles

References

    1. Akbarian S., Grüsser O.J., Guldin W.O., 1994. Corticofugal connections between the cerebral cortex and brainstem vestibular nuclei in the macaque monkey. J. Comp. Neurol. 339, 421–437. 10.1002/cne.903390309 - DOI - PubMed
    1. Assaf Y., 2019. Imaging laminar structures in the gray matter with diffusion MRI. NeuroImage 197, 677–688. 10.1016/j.neuroimage.2017.12.096 - DOI - PubMed
    1. Autio J.A., Glasser M.F., Ose T., Donahue C.J., Bastiani M., Ohno M., Kawabata Y., Urushibata Y., Murata K., Nishigori K., Yamaguchi M., Hori Y., Yoshida A., Go Y., Coalson T.S., Jbabdi S., Sotiropoulos S.N., Kennedy H., Smith S., Van Essen D.C., Hayashi T., 2020. Towards HCP-Style macaque connectomes: 24-Channel 3T multi-array coil, MRI sequences and preprocessing. NeuroImage 215, 116800. 10.1016/j.neuroimage.2020.116800 - DOI - PMC - PubMed
    1. Autio J.A., Kimura I., Ose T., Matsumoto Y., Ohno M., Urushibata Y., Ikeda T., Glasser M.F., Van Essen D.C., Hayashi T., 2024. Mapping vascular network architecture in primate brain using ferumoxytol-weighted laminar MRI. bioRxiv 2024.05.16.594068. 10.1101/2024.05.16.594068 - DOI - PMC - PubMed
    1. Autio J.A., Zhu Q., Li X., Glasser M.F., Schwiedrzik C.M., Fair D.A., Zimmermann J., Yacoub E., Menon R.S., Van Essen D.C., Hayashi T., Russ B., Vanduffel W., 2021. Minimal specifications for non-human primate MRI: Challenges in standardizing and harmonizing data collection. NeuroImage 236, 118082. 10.1016/j.neuroimage.2021.118082 - DOI - PMC - PubMed

Publication types

LinkOut - more resources