[Preprint]. 2024 Sep 27:2024.09.25.615007.
doi: 10.1101/2024.09.25.615007.

Multimodal Spatial Profiling Reveals Immune Suppression and Microenvironment Remodeling in Fallopian Tube Precursors to High-Grade Serous Ovarian Carcinoma

Affiliations

Multimodal Spatial Profiling Reveals Immune Suppression and Microenvironment Remodeling in Fallopian Tube Precursors to High-Grade Serous Ovarian Carcinoma

Tanjina Kader et al. bioRxiv. .

Update in

Abstract

High-Grade Serous Ovarian Cancer (HGSOC) originates from fallopian tube (FT) precursors. However, the molecular changes that occur as precancerous lesions progress to HGSOC are not well understood. To address this, we integrated high-plex imaging and spatial transcriptomics to analyze human tissue samples at different stages of HGSOC development, including p53 signatures, serous tubal intraepithelial carcinomas (STIC), and invasive HGSOC. Our findings reveal immune modulating mechanisms within precursor epithelium, characterized by chromosomal instability, persistent interferon (IFN) signaling, and dysregulated innate and adaptive immunity. FT precursors display elevated expression of MHC-class I, including HLA-E, and IFN-stimulated genes, typically linked to later-stage tumorigenesis. These molecular alterations coincide with progressive shifts in the tumor microenvironment, transitioning from immune surveillance in early STICs to immune suppression in advanced STICs and cancer. These insights identify potential biomarkers and therapeutic targets for HGSOC interception and clarify the molecular transitions from precancer to cancer.

Keywords: HLA-A; HLA-E; High Grade Serous Ovarian Carcinoma; Natural Killer cells; Ovarian cancer; Serous Tubal Intraepithelial Carcinoma; antigen presentation; cancer progression; fallopian tube; homologous recombinant deficient tumor; innate immune system; multi-plex imaging; p53 signatures; preneoplasia; single cell; spatial transcriptomics; tumor immune interaction; tumor microenvironment.


Conflict of interest statement

DECLARATION OF INTERESTS PKS is a co-founder and member of the BOD of Glencoe Software and member of the SAB for RareCyte, NanoString, and Montai Health; he holds equity in Glencoe and RareCyte. PKS is a consultant for Merck. RD is a member of the SAB for Repare Therapeutics and is a consultant for Light Horse Therapeutics and Abbvie. The other authors declare no outside interests.

Figures
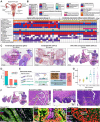
Figure- 1:
Figure- 1:. Overview of the cohort and experimental design
A. Anatomy of female reproductive tract showing Fallopian Tube (FT), distal end of the FT, Fimbriae and ovary. It is now generally accepted that the majority of High Grade Serous Ovarian carcinomas (HGSOC) arise from the secretory cells in the distal fimbriated end of FT. B. Detailed clinical annotation of the entire cohort of 43 patients, indicating 44 specimens run on tissue Cyclic Immunofluorescence (CyCIF) and 35 specimens on spatial whole transcriptomics (GeoMx) platform (NanoString). Clinical annotations are provided (HGSOC stage, BRCA mutation status, ovarian involvement, metastasis presence, and neoadjuvant chemotherapy), as are basic clinical details (race, ethnicity). For all samples, the type of lesion (i.e., histology) was recorded and the disappearance of lesions on subsequent sections from H&E was also noted. See Supplementary File S1 for the complete table. C. Example of H&E from each subgroup of the cohort: Incidental p53 signatures (p53.I), incidental STIC (STIC.I) and STIC with concurrent cancer (STIC.C). D. Stacked bar plot comparing number of cases of BRCA mutant (Mut) and wild-type (WT) between incidental and cancer-associated precancer lesions, **p<0.01, Fisher exact test. E. Experimental design and spatial integration of histology-guided multiplex tissue imaging, CyCIF, and GeoMx. The adjacent sections (5 μM) were chosen for CyCIF and GeoMx. Region of Interests (ROIs) of GeoMx were then integrated into CyCIF images based on the X/Y coordinates of both sections (see Supplementary Figure S2 and Methods). The antibody panel shows 31 antibodies used for analysis in this study; asterisks indicate antibodies that were run only on a subset of the specimens (n=26 out of 44). High-resolution 3D CyCIF was performed for one STIC.C case, shown in Figure 1F (patient ID 9, case RD-23–002). F. Example STIC with concurrent HGSOC (Case RD-23–002, patient ID 9, BRCA2 mutant, Stage IC HGSOC). H&E images (top row) show different histologies within the specimen: FT.C, STIC.C, and invasive cancer. The CyCIF images (bottom row) show increased p53 mutant epithelial cells with disease progression, as well as the epithelial compartment (PanCK+) and the adjacent stromal compartment (PanCK-). G. Box plot comparing p53 intensity level in epithelial cells across disease stages, as quantified from tissue imaging. Y axis is presented in log10 scale. Number of specimens per group as follows: FT.I (n=13), Fim.I (n=15), p53.I (n=10), STIC.I (n=9), STIC.C (n=23), and Cancer (n=20). The solid line indicates the median within the interquartile range, with whiskers extending to a maximum of 1.5 times the interquartile range beyond the box. Outliers shown. Black asterisks indicate significant differences in stages compared to the FT.I (**p<0.01, ****p<0.0001), as calculated with Linear Mixed Models (LMMs) with patient ID as random effect. LMMs were implemented in the lme4 R package (v 4.3.3). A, E. Created with BioRender.
Figure- 2:
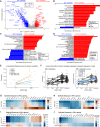
Figure- 2:. Molecular transitions during HGSOC development using spatial transcriptomics
A. Differential gene expression between epithelial segments of p53.I (n=39) and STIC.I (n=27). Linear Mixed Model (LMM) was applied for differential gene expression. LMM was performed with Benjamini-Hochberg (BH) correction using GeoMx DSP software (NanoString, v 3.1.0.221). Model formula: Lesions Type + (1| Scan_ID) whereby Scan_ID refers to the patient/slide ID. Only a subset of differentially expressed genes are shown. B-D. Gene Set Enrichment Analysis (GSEA) was performed based on the differential gene expression of the epithelia (as analyzed by GeoMx DSP software). MsigDB Cancer Hallmark gene sets associated with disease progression were compared between (B) p53.I (n=39) and STIC.I (n=27), (C) STIC.I (n=27) and STIC.C (n=96), and (D) STIC.C (n=96) and invasive carcinoma (n=105). Progression of STIC.I (B) was predominantly associated with interferon (IFN) and proliferative gene sets; STIC.C (C) was predominantly associated with EMT, TGF-β and hypoxia gene sets, and invasive carcinoma only events (D) were most likely to be associated with angiogenesis and Hedgehog signaling pathway. B-D. Pathway rankings were based on an adjusted p-value <0.05. E-J. Since LMMs and GSEA only allow us to look into pairwise comparison, we employed Bayesian regression modeling to model the progression from FT to cancer. Notably, Bayesian models differ from other methods since they take repeated sampling from the same patient into consideration. E. LMMs account for patient variability, demonstrated using a synthetic gene expression dataset across two disease stages. Repeated sampling from a single patient (Patient 1) introduces bias in estimating the mean effect. This bias is eliminated when patient variability is incorporated using LMMs. F. Bayesian ordinal regression models for gene expression across disease progression, exemplified using MCL1. While LMMs in the GeoMx DSP software allow only pairwise comparisons and a single random effect, Bayesian ordinal regression enables analysis across multiple disease stages. We implemented this approach using the “brms” R package, incorporating an ordinal monotonic constraint to model the stepwise sequence of lesions during disease progression. GeoMx expression counts were Q3 normalized to account for sequencing depth (see Methods) and log transformed to stabilize variances. To account for differences in expression levels across different genes, the log-transformed values were further normalized by scaling to a mean of zero and variance of one (z-transform). We fitted one model per gene using the model specification gene_expression ~ mo(stage) + (1 + mo(stage) | patient_id). A monotonic constraint was applied to enforce the assumption of an orderly sequence of these stages. Repeat measurements from the same patients were accounted for by including patient-specific random intercepts and stage coefficients. In order to model the expression of gene sets, another random effect and its interaction with patient_id was included in the model (gene_expression ~ mo(stage) + (1 + mo(stage) | patient_id * gene) (details are in Methods). G-J. In order to look into more details of IFN pathway and how it changes from normal FT to STIC.I or STIC.C to carcinoma, Bayesian ordinal regression model was applied to selected IFN-hallmark genes to compare expression changes in the epithelial and stromal compartments at different disease stages. Bayesian modeling allows to see the relative gene expression changes in the incidental or cancer group compared to the matched FT. Heatmaps show normalized expression of genes in the epithelia related to response in (G) IFN-α, (H) IFN-ɣ, from incidental group compared to their matched FT.I. Relative to the matched FT.I, upregulation of key genes induced by both IFN-α and IFN-ɣ activation, such as STAT1, ISG15, IFITM1, IRF7, IRF9, HLA-A at p53.I, indicating IFN activation at the very early stages of HGSOC progression. Heatmap showing normalized expression of genes in the epithelia related to response in (I) IFN-α, (J) IFN-ɣ, from cancer group compared to their matched FT.C. G-J. Columns correspond to individual genes, and rows correspond to types of lesions. Median of the posterior distribution was shown in heatmaps. Significance testing used the proportion of the 95% highest density interval (HDI) within the Region of Practical Equivalence (ROPE, 0.05 times the standard deviation). Comparisons with >95% of the HDI outside the ROPE were significant (*); >99% were very significant (**).
Figure- 3:
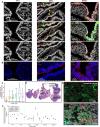
Figure- 3:. Multiplexed tissue imaging revealed spatially coordinated IFN signaling in HGSOC progression
A. CyCIF images showing markers related to downstream of IFN signaling pathway activation, such as overexpression of MHC-Class I (HLA-A and HLA-E) and p-STAT3 in both p53..I The representative STIC.I case is shown with matched FT.I (case CD302.04(939), patient ID 40, BRCA WT). The p53.I sample is from a different patient (case C21–22 patient ID 28, BRCA1 Mut). Yellow arrows on p53.I indicate the layer of epithelial cells representing “p53signatures”. B. CyCIF images showing p-TBK1 (cytosolic/ punctate) expression in regions that express HLA-A, HLA-E and p-STAT3 (FT.I identical ROI to A, p53.I and STIC.I ROIs outlined with yellow box in A), suggestive of one of the potential upstream mechanisms of IFN pathway activation. C. Box plot showing the percentage of epithelial cells with an IFN activation marker (p-TBK1+/p-STAT1+/HLA-E+/p-STAT3+). Quantification is based on single-cell quantification from tissue imaging data and suggests an increased number of cells with IFN activation marker with disease progression. The number of specimens for each lesion as follows: FT.I (n=13), Fim.I (n=15), p53.I (n=10), STIC.I (n=9), STIC.C (n=23), and Cancer (n=20). The solid line indicates the median within the interquartile range, with whiskers extending to a maximum of 1.5 times the interquartile range beyond the box. Black asterisks indicate significant differences in stages compared to the FT.I; **p<0.001, ****p<0.0001. Binomial Generalized Linear Mixed Models (GLMMs) taking patient ID as random effect. GLMMs was implemented in the lme4 R package (v 4.3.3). For each ROI the number of cells with the given phenotype (“successes”) and of all other phenotypes (“failures”) was modelled using the binomial distribution with a logit link function using the lme4 model formula cbind(n_success, n_failure) ~ stage + (1 + stage | patient_id). See Supplementary File S5, S6 for summary statistics. D. H&E image of WSI (Case RD-23–002, patient ID 9, BRCA2 mutant, Stage IC HGSOC) with ROIs for E indicated. E. 3D reconstruction using 3D CyCIF imaging of a case of STIC with concurrent HGSOC (patient ID 9, ROIs from D). MX-1, a well-known IFN-induced gene, shows punctate expression and is co-expressed with PanCK+ HLA-A+, suggesting IFN activation in both tumor and STIC.C epithelium. F. Plot of odds ratio (OR) for protein pairs (p-STAT1+ HLA-E+ or p-STAT1+ p-TBK1+ or p-STAT1+ p-STAT3+ or p-TBK1+ HLA-E+), showing the likelihood of co-expression of these marker pairs in epithelial cells across disease stages. Odds ratio (OR) with confidence interval (CI) (Y-axis) is >1, where OR<1 indicates a lower likelihood of co-expression. Y axis is presented in log(10) scale. After gating single cells (+ or – for a marker), a contingency table was generated with the total number of positive or negative cells for two markers of interest (such as p-STAT1 and HLA-E) (using R v 4.3.3). Next, GLMMs were performed to calculate the OR with CI and significance testing. All lesion types showed significance of having double positive cells (p<0.001). Fisher exact test was also performed, suggesting a similar OR to GLMMs. Summary statistics are in Supplementary Files S5 and S6.
Figure-4:
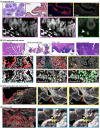
Figure-4:. Tissue imaging revealed Micronuclear Rupture and cGAS Recruitment in HGSOC Progression
A. Top row: H&E of a representative case of STIC.I (case CD302.03(706), patient ID 38, BRCA1 Mut), with ROIs indicated. CyCIF imaging confirms TP53+ epithelial cells on STIC containing BAF positive staining, outlined with a purple box. Bottom: Co-localization of BAF+ staining with DNA (DAPI) indicates ruptured micronuclei (MN) ( white arrowhead). Higher magnification panel (outlined with a green box) confirms cGAS colocalization with BAF+ MN and indicates cGAS binding to the ruptured micronuclear DNA. B. Top: H&E of a representative case of STIC with concurrent HGSOC, with ROIs for different histologies shown (also shown in Figure 1; Case RD-23–002, patient ID 9, BRCA2 mutant, Stage IC HGSOC). Cyan box on STIC.C H&E and brown box on invasive tumor H&E indicated ROI for panels in lower rows. Lower rows: CyCIF images of STIC.C (left column) showing BAF+ MN (red arrow heads). Additional CyCIF images of invasive cancer (right columns), showing a sharp increase of BAF+cGAS+ or BAF+ ɣ-H2Ax+ MN in the invasive component (yellow arrow heads). C-D. The same specimen as shown in panel B was imaged using 3D confocal microscopy to confirm the intact nuclei and MN rupture event(s). 3D reconstruction and surface rendering of the 20 μm thick specimen confirm the colocalization of BAF+ and cGAS+ MN as well as co-expression of BAF+ ɣ-H2Ax+ MN rupture events in STIC.C (C; red arrowheads outlined with a yellow box) and in the invasive cancer component (D; yellow arrowheads outlined with a green box). Co-localization of cGAS and BAF+ MN potentially indicates the sensing of MN-ruptured DNA by cGAS and activating the cGAS-STING pathway.
Figure- 5:
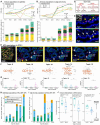
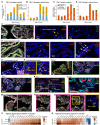
Figure- 5:. Immune composition suggests an active immune surveillance by the presence of activated antigen presenting cells (APC) at the early HGSOC progression
A-B. Top: Line plots depicting changes in the proportions of major immune cell types across disease stages. Data are derived from single-cell CyCIF analysis of (A) epithelial tissue and (B) adjacent stroma. The y-axis shows odds ratios relative to the proportions in FT.I on a log scale. Odds ratios and p-values were derived from binomial GLMMs, with patient ID and observation-level random effects. p-values were adjusted for multiple testing using the Benjamini–Hochberg (BH) procedure. Bottom: Stacked bar plots showing the average proportion of major immune cell types derived from single cell-CyCIF analysis across disease stages in epithelium (A) and in adjacent stroma (B). Asterisks on bars indicate significant differences compared to the FT.I stage; asterisks between bars (with dashed lines) indicate significant comparisons between stages. *p<0.05, **p<0.01. Binomial GLMMs, with patient ID and observational level random effect. Average proportions were rounded up to the next whole number when applicable and shown for each cell type across lesion types. Number of specimens per group as follows: FT.I (n=13), Fim.I (n=15), p53.I (n=10), STIC.I (n=9), STIC.C (n=23), and Cancer (n=20). C. A schematic showing different subsets of CD11c+ population identified by tissue imaging and their definition within this manuscript. cDC1: conventional dendritic cells, APC: antigen-presenting cells. HLA-DR+ populations represent an activated APC state; the first step of activation of any antigen-presenting cells is expressing MHC-class II (HLA-DR). D. CyCIF image showing from a representative case of a p53.I, also shown in Figure 3 (case C21–22 patient ID 28, BRCA1 Mut). The green ROI on the inset indicates the layer of epithelial cells representing “p53signatures”. The epithelium of the “signatures” showed the presence of activated APCs, such as activated cDC1 and other CD11c+ dendritic cells. CD40+ CD11c+ indicates the presence of a co-stimulatory molecule, meaning activated dendritic cells, both cDC1 (shown with yellow arrows) and other dendritic cells (shown with white arrows). E. CyCIF image showing a representative case of a STIC.I, also shown in Figure 4 (STIC.I, case CD302.03(706), patient ID 38, BRCA1 Mut). An area outlined with a yellow box shows the presence of the overall APC population, including cDC1. Furthermore, these APCs are “activated” (i.e. presenting antigens (HLA-DR+)) or CD40+). The yellow arrow indicates cDC1, and the white arrows indicate other dendritic cells, excluding cDC1, in the adjacent stroma, close to the STIC.I epithelium. Overall, the presence of activated APCs, either dendritic cells (CD11c+ CD68-) or macrophage derived (CD11c+ CD68+) might be indicative of active immune surveillance at the early precursor lesions. F. Latent Dirichlet Allocation (LDA) neighborhood analysis for spatial topic analysis was performed from multiplex tissue imaging. Some topics indicating of cellular neighborhoods related to immune cell populations and states. The pooled frequencies of all samples, both incidental and cancer group were used to train the final LDA model. G. Box plots depicting the percentage of cells in each topic (described in F)across lesion stages (STIC.I, STIC.C, and Cancer). The number of specimens for each lesion as follows: STIC.I (n=9), STIC.C (n=23), and Cancer (n=20). The solid line indicates the median within the interquartile range, with whiskers extending to a maximum of 1.5 times the interquartile range beyond the box. Black asterisks indicate significant differences between groups; ****p<0.0001, ** p<0.01, using GLMMs and taking patient ID as random effect. H. Average proportion for each HLA-DR+ APC subset (as a fraction of the total CD11c+ population ) across lesion types shown as a stacked bar plot, in the epithelia. I. Average proportion for each HLA-DR+ APC subset (as a fraction of the total CD11c+ population ) across lesion types shown as a stacked bar plot, in the adjacent stroma. H-I. Average proportions for each subset across lesion types were shown, rounded to the nearest whole number when applicable. Number of specimens per group as follows: FT.I (n=13), Fim.I (n=15), p53.I (n=10), STIC.I (n=9), STIC.C (n=23), and Cancer (n=20). Asterisks on bars indicate significant differences in cell proportions compared to the FT.I stage; asterisks between bars (dashed lines) indicate significant differences between groups. *p<0.05, **p<0.01, ****p<0.0001, binomial GLMMs, taking patient ID as random effect. Average proportions were rounded up to the next whole number when applicable and shown for each cell type across lesion types. J. Box plots comparing normalized interaction strength between different cell types at STIC.I and STIC.C stages: cDC1and CD4+ PD1+ T cells (left), HLADR+ CD68+ APCs and CD4+ CD8+ PD1+ T cells (middle), and HLADR+ APCs and CD8+ PD1+ T cells (right). Scores >1 indicate more and <1 indicates fewer interactions between the two cell types in STIC.C compared to STIC.I than expected by chance. The interaction score was normalized against the distance of random sampling. Since at least five cells of both populations will have to be present for random sampling, the number of specimens analyzed from tissue imaging was STIC.I (n=7), STIC.C (n=16) (p=0.03) (cDC1 & activated CD4+); STIC.I (n=7), STIC.C (n=12) (p=0.02) (HLA-DR+ CD68+ APCs & activated CD4+) and STIC.I (n=7), STIC.C (n=14) (p=0.04) (HLA-DR+CD68+ & activated CD8+). Y axis is presented in log(10) scale. The solid line indicates the median within the interquartile range, with whiskers extending to a maximum of 1.5 times the interquartile range beyond the box. Black asterisks indicate significant differences between groups; *<0.05, Wilcoxon rank sum test.
Figure-6:
Figure-6:. Immune editing and T cell dysfunction at early stage of HGSOC development
A-B. Stacked bar plots showing summary of major T cell subtypes from single cell-CyCIF analysis in the epithelia (A) and in the adjacent stroma (B) across disease stages. A-B. The average proportion of T cell subtypes shown is CD8+ CD103+ T cells, indicating tissue-resident memory T cells (also express CD45RO) (TRM) as well as CD8+ CD103- T (Cytotoxic T: CTL) cells. Number of specimens per group as follows: FT.I (n=13), Fim.I (n=15), p53.I (n=10), STIC.I (n=9), STIC.C (n=23), and Cancer (n=20). Black asterisks indicate significant differences in stages compared to the FT.I; *p<0.05, **p<0.01. Binomial GLMMs, with patient ID and observational level random effect. Colored asterisks with dashed lines were also shown based on GLMM output, only when significant comparing between groups (for eg. STIC.I vs STIC.C). C-D. Stacked bar plot showing the proportion of CD8+ T cell states in total CD8+ T cells from CyCIF analysis in the epithelia (C) or the adjacent stroma (D). T cell states are defined as follows: activated CD8+ T cells: Ki67/PD1+ and LAG3- and exhausted CD8+ T cells: PD1+LAG3+/LAG3+. Number of specimens per group as follows: FT.I (n=13), Fim.I (n=15), p53.I (n=10), STIC.I (n=9), STIC.C (n=23), and Cancer (n=20). Black asterisks indicate significant differences in stages compared to the FT.I; *p<0.05, ***p<0.001, ****p<0.0001, binomial GLMMs. Colored asterisks with dashed lines were also shown based on GLMM output, only when significant comparing between groups (for eg. STIC.I vs STIC.C or p53.I vs STIC.I). E. CyCIF image showing from a representative FT.I from a matched STIC.I, also shown in Figure 3 (case CD302.04(939), patient ID 40, BRCA WT). The Yellow arrows indicate a TRM (CD103+ CD45RO+ CD8+). F. CyCIF image showing from a representative p53.I, also shown in Figure 3 (case C21–22 patient ID 28, BRCA1 Mut). Red box indicates the layer of epithelial cells representing a “p53 signatures”, which show the presence of TRM (yellow arrows) and CD8+ 103- T (CTL) (orange arrows) in higher magnification (left). G-H. CyCIF image of another representative p53.I (case C21–80, patient ID 35, BRCA2 Mut) with the presence of TRM (white arrows), expressing the activation marker, PD1 (yellow arrows). I-J. CyCIF image showing a representative STIC.I, also shown in Figure 5 (STIC.I, case CD302.03(706), patient ID 38, BRCA1 Mut). Both CTL (magenta arrows) and TRM (yellow arrows) are present, namely in the adjacent stroma. K. CyCIF image of the same ROI as J, showing the presence of these T cells with PD1 (orange arrows) or LAG3 (punctate expression) (white arrows for cytotoxic T, grey arrows for TRM) co-expression, indicating potentially CD8+ T cell exhaustion in STIC.I. Inset shows higher magnification of gray ROI. L. CyCIF image showing proliferative CD8+ T cell on the same STIC.I (orange arrow), ROI indicated in I and J. M-N. CyCIF image showing from another representative STIC.I, also shown in Figure 3 (case CD302.04(939), patient ID 40, BRCA WT). TP53 positive epithelium and ROI shown in (M) with the presence of TRM (yellow arrows) in the epithelium of STIC.I (N). O. CyCIF image of same ROI as N, showing exhausted intra-epithelial TRM in STIC.I, co-expressing both PD1+ LAG3+ (yellow arrows). P-Q. Heat maps showing normalized expression upregulation of selected genes related to T cell state, including naïve, dysfunction, and memory T cell. They include HAVCR2 (encodes for TIM3), CTLA4 observed in the STIC.I stroma or tumor stroma. Here, PDCD1 (encodes for PD1), ITGAE (encodes for CD103), TCF7 (encodes for TCF1), CD274 (encodes for PDL1). Columns correspond to genes, and rows correspond to lesion stages. The heatmaps display the median of the posterior distribution derived from our Ordinal Bayesian model, relating log- and z-transformed gene expression to disease stage. Asterisks show significant changes in gene expression compared to the baseline stage (p53.C in (P) and FT.I in (Q)) Significance was determined using the proportion of the 95% highest density interval (HDI) within the Region of Practical Equivalence (ROPE, defined as 0.05 times the standard deviation). Comparisons with >95% of the HDI outside the ROPE were significant (*); >99% were very significant (**). Overall, exhausted CD8+ T cells, were observed even in incidental STIC.
Figure 7:
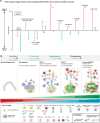
Figure 7:. Evolution of the precancer ecosystem during HGSOC progression
A. Lollipop plot shows the relative difference (fold difference) of major immune cells and state between STIC.I and STIC.C. Epithelial and stroma regions are both shown. The fold difference is calculated from the average proportion of each cell state (proportion of STIC.C/STIC.I). Fold difference of 1 indicates no change, >1 indicates that cell type is higher in STIC.C and <1 indicates higher in STIC.I. B. This schematic illustrates the stages of HGSOC progression, highlighting the temporal evolution of cancer hallmarks and immune-precancer/cancer interactions. Cancer arises from genetic alterations, where mutations and aneuploidy, and other cancer hallmarks, under positive selection, lead to tumor development. However, cells with oncogenic mutations can remain latent for decades, and most never progress to malignancy. Evidence suggests that cancer originates from these “phenotypically normal” clones with driver mutations, followed by a clonal expansion. Along the progression axis, these clonally expanded cells accumulate additional mutations and encounter a gradual decline in anti-tumor responses, with an increase in immune-suppressive and dysfunctional immune cell subtypes. Our multimodal precancer atlas profiling shows how the TME evolves over time. Early in precursor development, cytotoxic immune responses emerge despite lower genomic instability compared to advanced tumors. Innate immune mechanisms (NK-cDC1-CTL axis) and tissue-resident memory T cells (TRM) play a key role in controlling p53 signature outgrowth. Aneuploidy or extrinsic factors enhance immune surveillance, removing precancer cells before disease outgrowth. During early STIC clonal expansion, we observe an initial immune response characterized by IFN activation, an increase in activated cDC1 and activated APCs, and the presence of NK cell secreted chemokines (which further attracts cDC1), indicating active immune surveillance. Interactions between APCs and activated CD4+ and CD8+ T cells provide further evidence of immune engagement. However, suppressive immune populations, such as M2-like macrophages and Tregs, emerge during this stage; STIC in this equilibrium phase simultaneously experience a cytotoxic and immunosuppressive environment with activation of tumor-promoting pathways. Late-stage clonal expansion has fewer CD8+ T cells with less interaction with APC and CD4+ and CD8+ T cells, more exhausted CD8+CTL and CD4+ (LAG3+), almost no NK and cDC1 cells, and increased suppressive APC. Overall, the transition from STIC to tumor is driven by hallmark mechanisms, such as TGF-β, which exclude CTLs, altered cytokines and fibroblast profiles, and induction of EMT and migration programs. The dotted arrows represent hypothetical timing, with the transition from p53 signature to early STIC taking longer than the progression from early to late STIC.

References

    1. Bray F. et al. Global cancer statistics 2022: GLOBOCAN estimates of incidence and mortality worldwide for 36 cancers in 185 countries. CA. Cancer J. Clin. 74, 229–263 (2024). - PubMed
    1. Kroeger P. T. & Drapkin R. Pathogenesis and heterogeneity of ovarian cancer. Curr. Opin. Obstet. Gynecol. 29, 26–34 (2017). - PMC - PubMed
    1. Bowtell D. D. et al. Rethinking ovarian cancer II: reducing mortality from high-grade serous ovarian cancer. Nat. Rev. Cancer 15, 668–679 (2015). - PMC - PubMed
    1. Lee Y. et al. A candidate precursor to serous carcinoma that originates in the distal fallopian tube. J. Pathol. 211, 26–35 (2007). - PubMed
    1. Medeiros F. et al. The tubal fimbria is a preferred site for early adenocarcinoma in women with familial ovarian cancer syndrome. Am. J. Surg. Pathol. 30, 230–236 (2006). - PubMed

Publication types