. 2024 Sep 20;10(19):e38221.
doi: 10.1016/j.heliyon.2024.e38221. eCollection 2024 Oct 15.

Survival prediction and analysis of drug-resistance genes in HER2-positive breast cancer

Affiliations

Survival prediction and analysis of drug-resistance genes in HER2-positive breast cancer

Lin Yang et al. Heliyon. .

Abstract

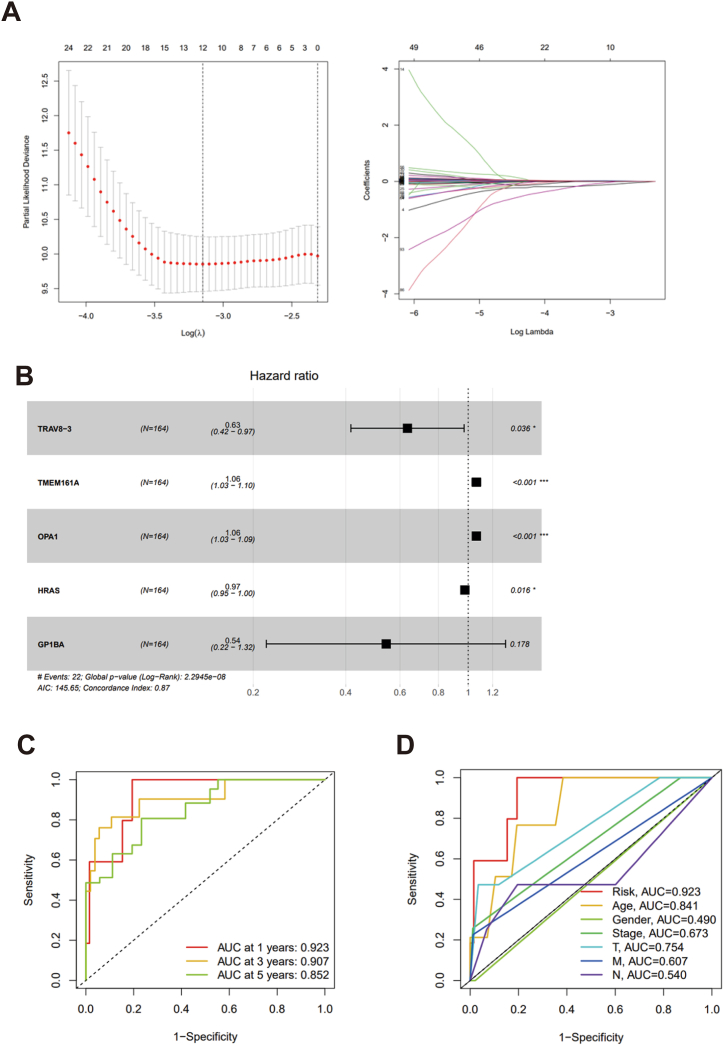
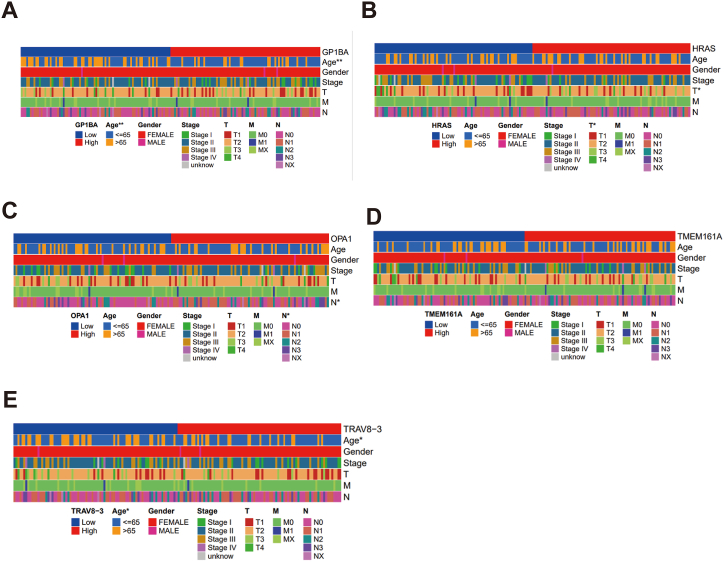
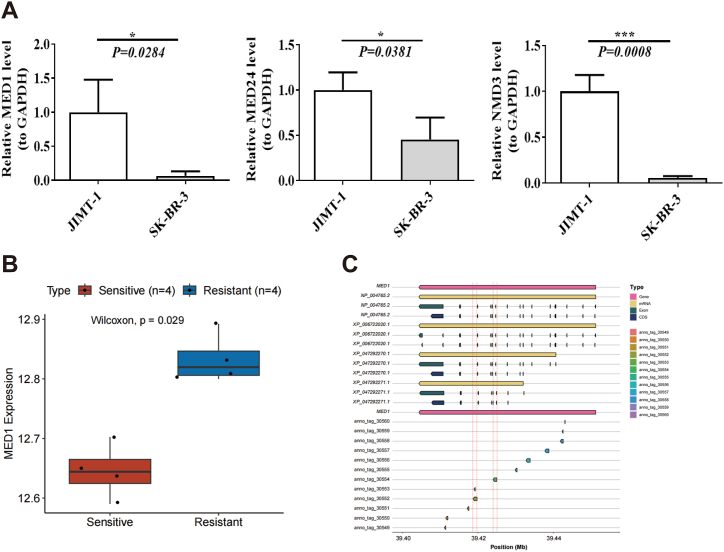
Despite the approval of several therapeutic agents for HER2-positive breast cancer, drug resistance remains a significant challenge, hindering the patient's prognosis. Thus, our study aimed to establish a risk model to predict the prognosis of patients and identify key genes regulating drug resistance in HER2-positive breast cancer. Utilizing data from The Cancer Genome Atlas (TCGA) and Gene Expression Omnibus (GEO), a predictive model was constructed based on 5 drug resistance-related genes, which demonstrated a notable capacity to indicate the survival rates of patients. Besides, through eccDNA and transcriptome sequencing of drug-sensitive and resistant cancer cells, 3 significant DEGs were identified: MED1, MED24, and NMD3. Among them, MED1 showed the most significant elevation in drug-resistance cells, highlighting its crucial role in mediating drug resistance. MED1 may serve as a valuable target for alleviating drug resistance in HER2-positive breast cancer.

Keywords: Drug resistance; HER2-Positive breast cancer; MED1; Non-coding RNA; Risk signature; eccDNA.


Conflict of interest statement

The authors declare that they have no known competing financial interests or personal relationships that could have appeared to influence the work reported in this paper.

Figures

Image 1
Graphical abstract
Fig. 1
Fig. 1
Functional analysis of ErbB pathway-associated genes. (A) The co-expression analysis of ErbB pathway-related genes with RNAs of HER2-positive breast cancer patients. (B) The circular plot of GO analysis. (C) The bar chart of the GO analysis. (D) The circular plot of KEGG analysis. (E) The bar chart of the KEGG analysis.
Fig. 2
Fig. 2
Establishment of a predictive model for prognosis. (A) The LASSO regression analysis on 261 HER2-regulating prognostic genes. (B) Forest plot of the multifactor regression model. (C) The ROC curve for 1-year, 3-year, and 5-year survival rates of the 5-gene-based risk model. (D) The ROC curve comparing the 5-gene prognostic model with clinical factors.
Fig. 3
Fig. 3
Kaplan-Meier survival analysis based on predictive model. (A) The survival curve based on the 5-gene prognostic model. (B) The single gene survival curves for the constructed risk model. (C) Single-factor analysis of factors influencing the survival rates of HER2-positive patients. (D) Multi-factor Cox analysis of factors influencing the survival rates of HER2-positive patients.
Fig. 4
Fig. 4
Correlation analysis of the predictive model with clinical factors. (A–E) The bar chart of the correlation between every single gene and different clinical factors, as indicated in different colors, respectively.
Fig. 5
Fig. 5
Functional analysis of DEGs related to drug resistance. (A) The volcano plot of differentially expressed genes (DEGs) analyzed from the GEO dataset, where red represents upregulated genes in the Resistant samples compared to the Sensitive samples and blue represents downregulated genes. The gray dots indicate that these genes do not show significant differences. (B) The heatmap of DEGs, where red represents upregulated genes in the Resistant samples compared to the Sensitive samples and blue represents downregulated genes. The gray dots indicate that these genes do not show significant differences. (C) The heatmap of the common DEGs, with the color of each box representing the relative expression levels of the gene in the corresponding sample, green indicating low expression, and orange indicating high expression. (D) The volcano plot of the DEGs between two groups. Each point on the plot represents a gene. Yellow and purple points represent significant DEGs, with purple indicating upregulated differential expression and yellow indicating downregulated differential expression. Gray points represent genes without significant differences. (E) The Venn diagram of the common DEGs. (F) The chord diagram of the enrichment analysis results of GO terms, where the genes participating in the same GO terms are connected by colored links, and the magnitude of the variation is indicated by a color gradient mapping. (G) The KEGG pathway enrichment analysis. (H) The image of the PPI network. (I) The Venn diagram of selective key genes. (J) The bar chart of the classical signaling pathways associated with DEGs. The size of each circle corresponds to the number of genes involved in that pathway. Orange circles indicate predicted activated pathways, blue circles represent predicted inhibited pathways, gray circles indicate pathways for which automatic scoring prediction is currently not available, and white circles represent pathways where there is currently insufficient evidence to predict activation or inhibition.
Fig. 6
Fig. 6
Analysis of drug resistance-related non-coding RNA network. (A–C) The heatmap of differently expressed non-coding RNAs, including miRNA (A), lncRNAs (B), and circRNAs (C). (D and E) The Venn diagram showing the crucial miRNA (D) and lncRNA (E). (F) The regulatory network of mRNA-miRNA-lncRNA. (G) The Venn diagram showing the crucial circRNA. (H) The regulatory network of mRNA-miRNA-circRNA.
Fig. 7
Fig. 7
Validation of the crucial DEGs. (A) qPCR analysis of the expression levels of MED1 (left), MED24 (middle), and NMD3 (right). (B) The expression level of MED1 in the Resistance and Sensitive groups from the GEO database. (C) The distribution region of the MED1 gene in the GH38 genome and eccDNA. ∗, p < 0.05; ∗∗∗, p < 0.001.
Fig. 8
Fig. 8
Validation of MED1 in drug resistance mechanism. (A) qPCR and Western Blot analysis of MED1 mRNA and protein levels in JIMT-1 KD cells. (B) qPCR and Western Blot analysis of MED1 mRNA and protein levels in SKBR3-OE cells. (C) Cell viability assay (CCK-8) of different cell groups treated with trastuzumab. (D) Tumor weight measurement in nude mice implanted with MED1-deficient JIMT-1 KD cells and control cells. (E) Tumor weight measurement in nude mice implanted with MED1-overexpressing SKBR3-OE cells and control cells.∗P < 0.05,∗∗P < 0.01.
figs1
figs1

References

    1. Loibl S., et al. Breast cancer. Lancet. 2021;397(10286):1750–1769. - PubMed
    1. Uribe M.L., Marrocco I., Yarden Y. EGFR in cancer: signaling mechanisms, drugs, and acquired resistance. Cancers. 2021;13(11) - PMC - PubMed
    1. Loibl S., Gianni L. HER2-positive breast cancer. Lancet. 2017;389(10087):2415–2429. - PubMed
    1. Choong G.M., Cullen G.D., O'Sullivan C.C. Evolving standards of care and new challenges in the management of HER2-positive breast cancer. CA Cancer J Clin. 2020;70(5):355–374. - PubMed
    1. Sirhan Z., Thyagarajan A., Sahu R.P. The efficacy of tucatinib-based therapeutic approaches for HER2-positive breast cancer. Mil Med Res. 2022;9(1):39. - PMC - PubMed

LinkOut - more resources