. 2024 Dec;11(45):e2402703.
doi: 10.1002/advs.202402703. Epub 2024 Oct 10.

Loss of Carbamoyl Phosphate Synthetase 1 Potentiates Hepatocellular Carcinoma Metastasis by Reducing Aspartate Level

Affiliations

Loss of Carbamoyl Phosphate Synthetase 1 Potentiates Hepatocellular Carcinoma Metastasis by Reducing Aspartate Level

Siyuan Chen et al. Adv Sci (Weinh). 2024 Dec.

Abstract

Hepatocellular carcinoma (HCC) is one of the most lethal cancers worldwide. Numerous studies have shown that metabolic reprogramming is crucial for the development of HCC. Carbamoyl phosphate synthase 1 (CPS1), a rate-limiting enzyme in urea cycle, is an abundant protein in normal hepatocytes, however, lacking systemic research in HCC. It is found that CPS1 is low-expressed in HCC tissues and circulating tumor cells, negatively correlated with HCC stage and prognosis. Further study reveals that CPS1 is a double-edged sword. On the one hand, it inhibits the activity of phosphatidylcholine-specific phospholipase C to block the biosynthesis of diacylglycerol (DAG), leading to the downregulation of the DAG/protein kinase C pathway to inhibit invasion and metastasis of cancer cells. On the other hand, CPS1 promotes cell proliferation by increasing intracellular S-adenosylmethionin to enhance the m6A modification of solute carrier family 1 member 3 mRNA, a key transporter for aspartate intake. Finally, CPS1 overexpressing adeno-associated virus can dampen HCC progression. Collectively, this results uncovered that CPS1 is a switch between HCC proliferation and metastasis by increasing intracellular aspartate level.

Keywords: CPS1; PC‐PLC; aspartate; m6A; metastasis.


Conflict of interest statement

The authors declare no conflict of interest.

Figures

Figure 1
Figure 1
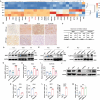
Reduced expression of CPS1 in HCC. A) Proteomics detection of differentially expressed proteins between HCC and adjacent tissues, n = 8. B) Proteomics KEGG analysis of changes in cellular pathways. C) immunohistochemical (IHC) detection of CPS1 expression in HCC and adjacent tissues, n = 152. The red five‐pointed star indicates tumor area. D) The expression of CPS1 in cancer thrombi. E) qPCR detection of mRNA levels of CPS1 in HCC and adjacent tissues, n = 10 in each group. F, G) Overall survival analysis and disease‐free survival analysis of patients with negative and positive expression of CPS1 expression. H) Number of circulating tumor cells (CTC) in patients with negative and positive CPS1 expression. CPS1: n = 22, CPS1+: n = 12. I) The expression level of CPS1 in CTC of HCC patients with different Barcelona (BCLC) stages. BCLC 0‐II: n = 12, BCLC III: n = 15. J) Correlation analysis between CPS1 expression and EpCAM expression. Scale bar: 50 × magnification, 400 µm, 200 × magnification, 100 µm. Values represent the means±SDs. *: p < 0.05, **: p < 0.01.
Figure 2
Figure 2
Knocking down the expression of CPS1 promotes HCC progression. A) 3D migration experiments on cell invasion in PLC‐NC and PLC‐shCPS1 cells. B–G) Statistical results of cell migration and invasion detected by wound healing and transwell experiment, respectively. H) In vivo fluorescence imaging shows the tumorigenesis status of the PLC‐NC group and PLC‐shCPS1 group in an in situ tumor model, n = 10. I) Statistics of the number in situ tumor cells. J, K) Hematoxylin‐eosin staining (HE) staining detection of liver and lung metastases in PLC‐NC and PLC‐shCPS1 groups, n = 10. The red five‐pointed star indicates tumor area. L) CCK8 assays showed cell proliferation in PLC‐NC/shCPS1, Huh7‐NC/shCPS1 and SK‐NC/CPS1‐OE cells. M) Colony formation experiment shows the effect of CPS1 on the tumorigenic ability of HCC cells. The left panel shows the colony image, and the right panel shows the summary data of colony number. N) Flow cytometry detection of CPS1 regulation on cell cycle. O) Cell apoptosis analysis by flow cytometry in shCPS1, CPS1‐OE cells and control cells. P) In vivo tumor formation in PLC‐NC and PLC‐shCPS1 groups demonstrated by orthotopic tumor transplantation in nude mice, n = 3–4. Scale bar: 50 × magnification, 400 µm, 200 × magnification, 100 µm. Values represent the means±SDs. *: p < 0.05, **: p < 0.01, ***: p < 0.001. The above in vitro experiments have all been biologically replicated (n = 3).
Figure 3
Figure 3
CPS1 increases the expression of SLC1A3 and regulates tumor cell proliferation, invasion, and metastasis through Asp. A) Transcriptome sequencing reveals genes affected by CPS1 (n = 3). B, C) qPCR and WB detection of the regulatory effect of CPS1 on SLC1A3 expression. D) Effect of SLC1A3 on HCC cell migration detected by wound healing experiment. The upper panel displays the wound healing images, and the lower panel is the statistical results. E) Amino acid targeting metabolomics shows the effect of CPS1 on amino acids content in HCC cells. F) Detection of Asp content in shCPS1, CPS1‐OE and NC HCC cells. G) CCK8 assay on the effect of Asp on HCC proliferation. H, I) Transwell detection of Asp regulates HCC invasion. J, K) Wound healing experiments exbibit regulation of HCC cell migration by treated of different concentrations of Asp (0, 200 mM, 1 mM, 5 mM) for 24 h. Scale bar: 200 µm. Values represent the means±SDs. *: p < 0.05, **: p < 0.01, ***: p < 0.001. The above in vitro experiments have all been biologically replicated (n = 3).
Figure 4
Figure 4
CPS1 increases m6A modification to stabilize SLC1A3 mRNA. A) KEGG analysis of the effect of CPS1 on cellular pathways. B) Detection of S‐adenosylmethionine (SAM) levels in PLC‐NC and PLC‐shCPS1 cells. C, D) Modification of RNA m6A and DNA m6A by CPS1 in PLC, Huh7 and SK cells. E–G) m6A sequencing reveals m6A modification in SLC1A3 mRNA. H) qPCR tests the expression regulation of METTL14 on mRNA levels of SLC1A3. I) Changes in the stability of SLC1A3 mRNA after reduced expression of METTL14 detected by qPCR (actinomycin D 5 µg mL−1, separately treated for 0, 2, 4, and 6 h). Values represent the means±SDs. *: p < 0.05, **: p < 0.01, ns: no significant difference. The above in vitro experiments have all been biologically replicated (n = 3).
Figure 5
Figure 5
Loss of CPS1 decreases Aspartate to activate PC‐PLC/DAG/PKC pathway in HCC cells. A) Metabolomics detection of changes in metabolites of PLC‐NC and PLC‐shCPS1 cells (n = 8). B–D) Changes in DAG content (B), PKC activity (C), PC‐PLC activity (D) after knocking down or overexpressing CPS1 compared to the control group. E, F) Changes in DAG content and PKC activity in PLC‐NC/shCPS1 cells treated with PC‐PLC inhibitor D609 (10 µM, treated for 24 h). G, H) Effects of PC‐PLC inhibitor D609 and PKC inhibitor GO6983 on migration and invasion of HCC cells (GO6983 5 µM, treated for 24 h). I) Molecular docking analysis of the binding between PC‐PLC and Asp. J) Effects of Asp (200 µM), Arg (200 µM), and Orn (500 µM) on the PC‐PLC activity in HCC cells. All the above amino acids were treated for 24 h. K, L) The regulatory effect of Asp on DAG levels and PKC activity in HCC cells. Values represent the means±SDs. *versus NC, # versus shCPS1, */#: p < 0.05, **/##: p < 0.01, ***/###: p < 0.001. The above in vitro experiments have all been biologically replicated (n = 3).
Figure 6
Figure 6
Upstream and downstream regulation of CPS1. A) Transcriptome heatmap analysis of the top 30 genes upregulated in shCPS1. B) IHC analysis of the correlation between CPS1 and MMP1, CCL5, ALDH1A3 in HCC patients (n = 50). C) Correlation analysis statistical chart. D–F) WB detection of the regulatory effect of CPS1 on MMP1 (D), CCL5 (E) and ALDH1A3 (F) expression. G–I) Change in MMP1 (G), CCL5 (H) and ALDH1A3 (I) expression after PKC inhibitor treatment detected by qPCR (GO6983 5 µM, treated for 24 h). J) WB detection of expression of CPS1 after treatment with pH 6.5, hypoxia (1% O2), and AMPK inhibitor Dorsomorphin dihydrochloride (Dor, 2 µM), treated for 24 h. K, L) qPCR detection of CPS1 and XBP1expression after treatment with pH 6.5, hypoxia (1% O2), and Dor (2 µM), treated for 24 h. M) qPCR detection of CPS1 expression in XBP1‐knockdown PLC cells. Scale bar: 200 µm. Values represent the means±SDs. *: p < 0.05, **: p < 0.01, ***: p < 0.001. The above in vitro experiments have all been biologically replicated (n = 3).
Figure 7
Figure 7
Exploration of the therapeutic prospects of CPS1 for HCC. A) Comparison of liver and lung tumor status between CPS1‐AAV treatment group and untreated group in mice with spontaneous liver cancer, n = 5. B–D) Statistics of body weight (B), liver weight ratio (C), and lung weight ratio (D), of CPS1‐AAV treatment group and untreated group. E, F) HE staining shows liver and lung tumor nodules. The red five‐pointed star indicates tumor area. G) Wound healing experiment tests the effect of CPS1 on the efficacy of Lenvatinib (Len, 10 µM, treated for 0 and 24 h). The left panels are wound healing images, the right panel is a statistical chart of wound healing rate. H) Mortality statistics of NC cells and CPS1‐OE cells in response to Len effect (Len, 10 µM, treated for 0 and 48 h). I) Schematic diagram of the mechanism by which CPS1 regulates HCC. Scale bar: 200 × magnification, 100 µm, 100 × magnification, 200 µm. Values represent the means±SDs. *: p < 0.05, **: p < 0.01, ***: p <0.001. The above in vitro experiments have all been biologically replicated (n = 3).

References

    1. Villanueva A., New Engl. J. Med. 2019, 380, 1450. - PubMed
    1. Lu Y., Chan Y.‐T., Wu J., Feng Z., Yuan H., Li Q., Xing T., Xu L., Zhang C., Tan H.‐Y., Lee T. K.‐W., Feng Y., Wang N., Drug Resist. Update 2023, 71, 101015. - PubMed
    1. Wang S., Zhou L., Ji N., Sun C., Sun L., Sun J., Du Y., Zhang N., Li Y., Liu W., Lu W., Drug Resist. Update 2023, 69, 100976. - PubMed
    1. Li Q., Zhang L., Yang Q., Li M., Pan X., Xu J., Zhong C., Yao F., Zhang R., Zhou S., Dai X., Shi X., Dai Y., Xu J., Cheng X., Xiao W., She Z., Wang K., Qian X., Pu L., Zhang P., Wang X., Cell Metab. 2023, 35, 912. - PubMed
    1. Sun J., Ding J., Shen Q., Wang X., Wang M., Huang Y., Zhang X., Zhu H., Zhang F., Wu D., Peng M., Zhang Z., Yuan Y., Li W., She Z.‐G., Zhang X.‐J., Li H., Zhang P., Huang Z., J. Hepatol. 2023, 78, 627. - PubMed

MeSH terms

Substances

LinkOut - more resources