. 2024 Dec;291(24):5420-5434.
doi: 10.1111/febs.17294. Epub 2024 Oct 10.

Hemin-induced platelet activation is regulated by the ACKR3 chemokine surface receptor and has implications for passivation of vulnerable atherosclerotic plaques

Affiliations

Hemin-induced platelet activation is regulated by the ACKR3 chemokine surface receptor and has implications for passivation of vulnerable atherosclerotic plaques

Zoi Laspa et al. FEBS J. 2024 Dec.

Abstract

In vulnerable atherosclerotic plaques, intraplaque hemorrhages (IPH) result in hemolysis of red blood cells and release of hemoglobin and free hemin. Hemin activates platelets and leads to thrombosis. Agonism of the inhibitory platelet receptor ACKR3 inhibits hemin-dependent platelet activation and thrombus formation. To characterize the effect of hemin and ACKR3 agonism on isolated human platelets, multi-color flow cytometry and classical experimental setup such as light transmission aggregometry and a flow chamber assay were used. Hemin induces platelet aggregation and ex vivo platelet-dependent thrombus formation on immobilized collagen under a low shear rate of 500 s-1, indicating that free hemin is a strong activator of platelet-dependent thrombosis. Recently, we described that ACKR3 is a prominent inhibitory receptor of platelet activation. Specific ACKR3 agonists but not conventional antiplatelet compounds such as COX-1 inhibitor (indometacin), ADP-receptor blocker (cangrelor), or PAR1 inhibitor (ML161) inhibit both hemin-dependent aggregation and thrombus formation. To further characterize the effect of hemin on platelet subpopulations, we established a multi-color flow cytometry assay. We found that hemin induces procoagulant (CD42bpos/PAC-1neg/AnnexinVpos), aggregatory (CD42bpos/PAC-1pos/AnnexinVneg), and inflammatory (CD42bpos/CXCR4pos/ACKR3pos/AnnexinVpos) platelet subpopulations. Treatment with ACKR3 agonists significantly decreased the formation of procoagulant and ACKR3pos platelets in response to hemin. We conclude that hemin is a strong activator for the formation of procoagulant platelets and thrombus formation which is dependent on the function of ACKR3. Activation of ACKR3 using specific agonists may offer a therapeutic strategy to regulate the vulnerability of atherosclerotic plaques in areas of IPH.

Keywords: ACKR3; hemin; intraplaque hemorrhage (IPH); multi‐color flow cytometry; platelets.


Conflict of interest statement

The authors declare no conflict of interest.

Figures

Fig. 1
Fig. 1
Hemin induces surface expression of ACKR3 on platelets. (A) Flow cytometry measurement of ACKR3 induced by 10 μg·mL−1 CRP‐XL, 6.25 and 25 μm hemin for 1 h. Representative histogram (left) and statistical analysis (right); plotted: Mean ± SD; n ≥ 8; statistics: Mixed‐effects analysis, **P < 0.01, ***P < 0.001, ****P < 0.0001. (B) Representative blot and statistical analysis of densitometric measurements of total ACKR3 normalized to Actin under 6.25 and 25 μm hemin stimulation compared to control conditions; plotted: Mean ± SD; n = 5; statistics: Rm one‐way ANOVA; ns, not significant. (C) Flow cytometry measurement of ACKR3 induced by 6.25 μm hemin, 50 μg·mL−1 fucoidan or 30 μm katacine after 1 h of incubation at room temperature (RT); plotted: Mean ± SD; n = 6; statistics: Rm one‐way ANOVA against black arrow (formula image), **P < 0.01; ns, not significant. (D) Sample images of dynamic surface expression of CD42b, ACKR3 and CD62P captured by image stream analysis performed with isolated platelets at RT; scale bar = 2 μm; n = 1.
Fig. 2
Fig. 2
Hemin‐induced ACKR3 surface expression is modulated via furin and ACKR3 agonism. Flow cytometry measurements of ACKR3 surface expression upon 6.25 μm hemin stimulation. (A) Pre‐incubation for 15 min with 20 μm PRT‐060318 (Syk inhibitor) and 20 μm PP2 (Src inhibitor); plotted: Mean ± SD, n = 5, Mixed‐effects analysis against black arrow (formula image), *P < 0.05; ns, not significant. (B) Pre‐incubation with 0.5 μm DEA/NO and 220 nm riociguat; plotted: Mean ± SD, n = 5, RM one‐way ANOVA against black arrow (formula image), ***P < 0.001; ns, not significant. (C) Pre‐incubation for 15 min with 25 μm furin inhibitor SSM3; plotted: Mean ± SD, n ≥ 6, Mixed‐effects analysis against black arrow (formula image), *P < 0.05; **P < 0.01; ns, not significant. (D) Pre‐incubation for 15 min with 100 μm VUF11207 (ACKR3 agonist); plotted: Mean ± SD, n = 6, Mixed‐effects analysis against black arrow (formula image), *P < 0.05. (E) Pre‐incubation for 15 min with 100 μm C1 (ACKR3 agonist); plotted: Mean ± SD, n = 7, RM one‐way ANOVA against black arrow (formula image), *P < 0.05, **P < 0.01.
Fig. 3
Fig. 3
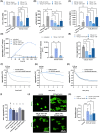
Effect of ACKR3 agonism on hemin‐induced platelet activation, degranulation and thrombus formation. (A–C) Flow cytometry measurements of (A) PAC‐1 (B) CD62P and (C) CD63 induced by 1 μg·mL−1 CRP‐XL and 6.25 μm hemin for 30 min with pre‐treatment of ACKR3 agonists (100 μm VUF11207, 100 μm C1, 100 μm C46) for 15 min at RT; plotted: Mean ± SD; n ≥ 3; statistics: RM one‐way ANOVA (PAC1, CD62P), Mixed‐effects analysis (CD63), *P < 0.05; **P < 0.01, ***P < 0.001, ns, not significant. (D) Representative intracellular Ca2+‐release measurement for 5 min using Fluo‐4‐AM and statistical analysis of the area under the curve (AUC) of the Fluo‐4‐AM fluorescence; plotted: Mean ± SD; n = 6; statistics: Mixed‐effects analysis, **P < 0.01 (E, F) Light transmission aggregometry measurements. (E) Hemin‐induced maximal aggregation after 5 min at 37 °C and pre‐treatment with ACKR3 agonists (100 μm VUF11207, 100 μm C1, 100 μm C46) for 15 min at 37 °C and a 6.25 μm hemin control, plotted: Mean ± SD; n ≥ 3; statistics: Mixed‐effects analysis, *P < 0.05, ns, not significant. (F–H) Representative traces of hemin‐induced aggregation with (F) 100 μm VUF11207 (G) 100 μm C1 and (H) 100 μm C46. (I) Hemin‐induced maximal aggregation after 5 min at 37 °C and pre‐treatment with either 10 μm indometacin (COX‐1 inhibitor), 10 μm cangrelor (P2Y12‐inhibitor), 10 μm ML161(PAR1 inhibitor) or dual inhibition with 10 μm indometacin +10 μm cangrelor for 15 min at 37 °C and a 6.25 μm hemin control, plotted: Mean ± SD; n ≥ 3; statistics: Mixed‐effects analysis, ns, not significant. (J) Isolated human platelets were activated with 6.25 μm hemin and pre‐treated with 100 μm VUF11207 or 100 μm C46 (ACKR3 agonists) for 15 min at RT and perfused over a collagen‐coated surface (100 μg·mL−1) at a shear rate of 500 s−1. Representative fluorescence microscopy images of thrombi stained with DiOC6; scale bar = 100 μm. (K) Diagram depicts thrombus area in the presence and absence of ACKR3 agonists with 6.25 μm hemin stimulation; plotted: Mean ± SD; n ≥ 3; statistics: Mixed‐effects analysis, *P < 0.05, ****P < 0.0001, ns, not significant.
Fig. 4
Fig. 4
Effect of ACKR3 agonism on hemin‐induced plasma fragmentation. (A) Sample images of spread platelets on 100 μg·mL−1 fibrinogen coated coverslips with 6.25 and 25 μm hemin activation and pre‐treatment with ACKR3 agonist (100 μm VUF11207) for 15 min at RT; bar scale = 5 μm. (B) Flow cytometry measurement of microvesicles (< 1 μm) with beads measured by BD FACSLyric™; plotted: Mean ± SD; n = 5; statistics: RM one‐way ANOVA; *P < 0.05, ns, not significant. (C/D) Flow cytometry measurement of phosphatidylserine (PS) exposure on platelets (C) and platelet‐derived microvesicles (D) with an Annexin V conjugate (Annexin V PE‐Cyanin7); plotted: Mean ± SD; n = 6; statistics: RM one‐way ANOVA; *P < 0.05, **P < 0.01.
Fig. 5
Fig. 5
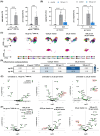
Platelet phenotype and formation of hemin‐induced subpopulations. (A) Induction of aggregatory and procoagulant platelet subpopulation by 10 μg·mL−1 CRP‐XL for 1 h measured by flow cytometry; plotted: Mean ± SD; n = 10; statistics: paired t‐test, ***P < 0.001, ****P < 0.0001. (B) 6.25 μm hemin‐induced aggregatory and procoagulant platelet subpopulations after 1 h with 15 min pre‐treatment of ACKR3 agonist (100 μm C1) measured with flow cytometry; plotted: Mean ± SD; n ≥ 4; statistics: Mixed‐effects analysis, *P < 0.05, ****P < 0.0001. (C) Platelet subpopulations determined by PhenoGraph algorithm for unsupervised clustering (pg‐01 to pg‐32) of human platelets; n = 10. Plots represent an overlay of all platelets per treatment (untreated, 10 μg·mL−1 CRP‐XL, 6.25 μm hemin, 25 μm hemin, 100 μm C1 + 25 μm hemin). (D) Inflammatory subpopulations (CXCR4pos/ACKR3pos/AnnexinVpos). Abundancy of platelets in each inflammatory cluster induced by 10 μg·mL−1 CRP‐XL, 6.25 and 25 μm hemin with pre‐treatment of ACKR3 agonist (100 μm BY). (E) Volcano plot presentation of platelet subpopulations in untreated versus treatment samples, the inflammatory subpopulations pg‐08 and pg‐16 are highlighted by a red circle (10 μg·mL−1 CRP‐XL, 6.25 μm hemin, 25 μm hemin); P < 0.05. (F) Volcano plot diagram subpopulations generated by treatment versus treatment with pre‐incubation of ACKR3 agonist (100 μm C1), the inflammatory subpopulations pg‐08 and pg‐16 are highlighted by a red circle; threshold: P < 0.05.

References

    1. Imparato AM, Riles TS & Gorstein F (1979) The carotid bifurcation plaque: pathologic findings associated with cerebral ischemia. Stroke 10, 238–245. - PubMed
    1. Davies MJ & Thomas AC (1985) Plaque fissuring—the cause of acute myocardial infarction, sudden ischaemic death, and crescendo angina. Br Heart J 53, 363–373. - PMC - PubMed
    1. Stary HC, Chandler AB, Dinsmore RE, Fuster V, Glagov S, Insull W Jr, Rosenfeld ME, Schwartz CJ, Wagner WD & Wissler RW (1995) A definition of advanced types of atherosclerotic lesions and a histological classification of atherosclerosis. A report from the committee on vascular lesions of the council on arteriosclerosis, American Heart Association. Circulation 92, 1355–1374. - PubMed
    1. Ross R (1999) Atherosclerosis—an inflammatory disease. N Engl J Med 340, 115–126. - PubMed
    1. Naghavi M, Libby P, Falk E, Casscells SW, Litovsky S, Rumberger J, Badimon JJ, Stefanadis C, Moreno P, Pasterkamp G et al. (2003) From vulnerable plaque to vulnerable patient: a call for new definitions and risk assessment strategies: part I. Circulation 108, 1664–1672. - PubMed

MeSH terms

LinkOut - more resources