. 2025 Jan;52(1):346-361.
doi: 10.1002/mp.17453. Epub 2024 Oct 10.

Assessing tumor microstructure with time-dependent diffusion imaging: Considerations and feasibility on clinical MRI and MRI-Linac

Affiliations

Assessing tumor microstructure with time-dependent diffusion imaging: Considerations and feasibility on clinical MRI and MRI-Linac

Minea Jokivuolle et al. Med Phys. 2025 Jan.

Abstract

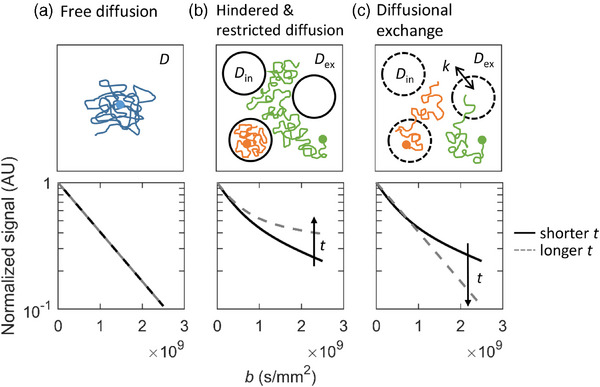
Background: Quantitative imaging biomarkers (QIBs) can characterize tumor heterogeneity and provide information for biological guidance in radiotherapy (RT). Time-dependent diffusion MRI (TDD-MRI) derived parameters are promising QIBs, as they describe tissue microstructure with more specificity than traditional diffusion-weighted MRI (DW-MRI). Specifically, TDD-MRI can provide information about both restricted diffusion and diffusional exchange, which are the two time-dependent effects affecting diffusion in tissue, and relevant in tumors. However, exhaustive modeling of both effects can require long acquisitions and complex model fitting. Furthermore, several introduced TDD-MRI measurements can require high gradient strengths and/or complex gradient waveforms that are possibly not available in RT settings.

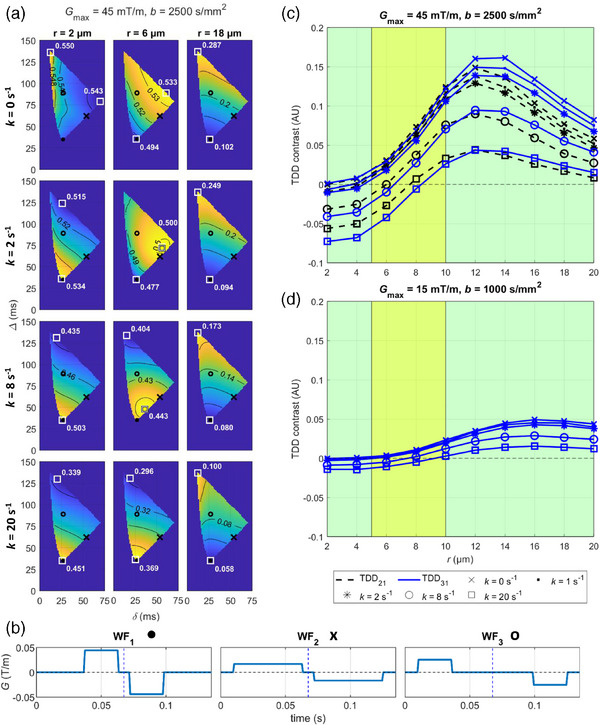
Purpose: In this study, we investigated the feasibility of a simple analysis framework for the detection of restricted diffusion and diffusional exchange effects in the TDD-MRI signal. To promote the clinical applicability, we use standard gradient waveforms on a conventional 1.5 T MRI system with moderate gradient strength (Gmax = 45 mT/m), and on a hybrid 1.5 T MRI-Linac system with low gradient strength (Gmax = 15 mT/m).

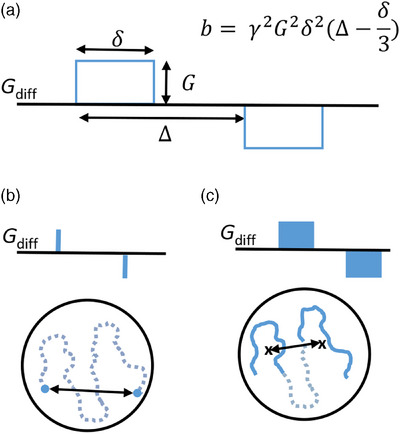
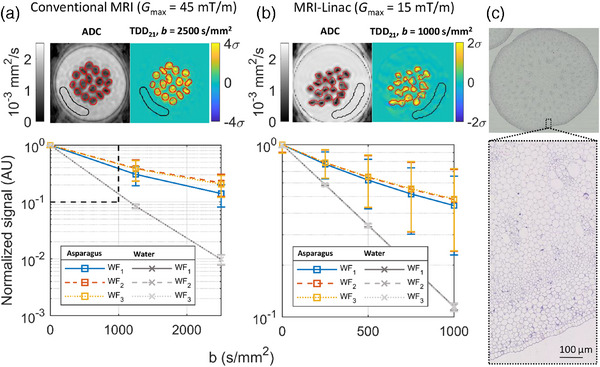
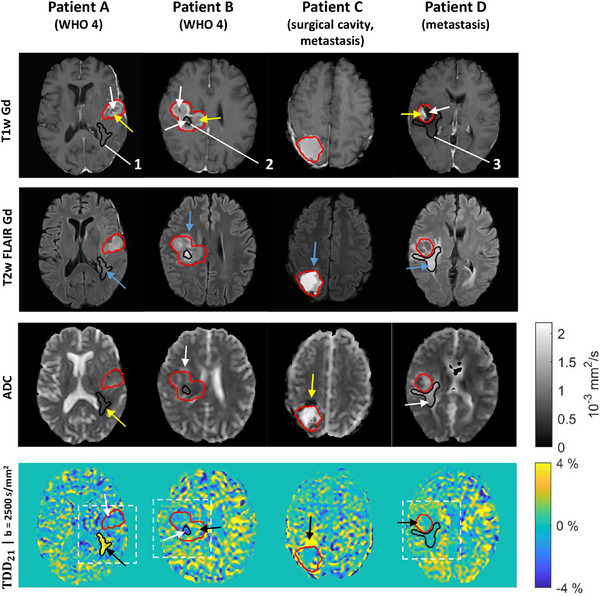
Methods: Restricted diffusion and diffusional exchange were simulated in geometries mimicking tumor microstructure to investigate the DW-MRI signal behavior and to determine optimal experimental parameters. TDD-MRI was implemented using pulsed field gradient spin echo with the optimized parameters on a conventional MRI system and a MRI-Linac. Experiments in green asparagus and 10 patients with brain lesions were performed to evaluate the time-dependent diffusion (TDD) contrast in the source DW-images.

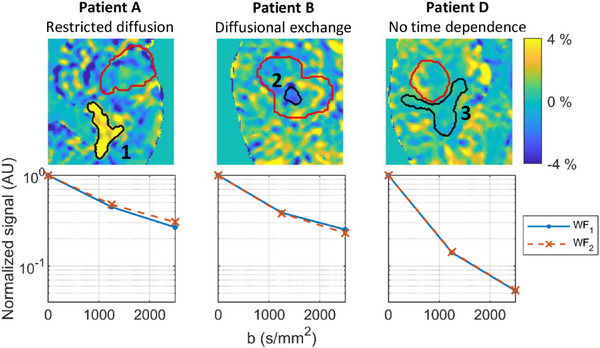
Results: Simulations demonstrated how the TDD contrast was able to differentiate only dominating diffusional exchange in smaller cells from dominating restricted diffusion in larger cells. The maximal TDD contrast in simulations with typical cancer cell sizes and in asparagus measurements exceeded 5% on the conventional MRI but remained below 5% on the MRI-Linac. In particular, the simulated TDD contrast in typical cancer cell sizes (r = 5-10 µm) remained below or around 2% with the MRI-Linac gradient strength. In patients measured with the conventional MRI, we found sub-regions reflecting either dominating restricted diffusion or dominating diffusional exchange in and around brain lesions compared to the noisy appearing white matter.

Conclusions: On the conventional MRI system, the TDD contrast maps showed consistent tumor sub-regions indicating different dominating TDD effects, potentially providing information on the spatial tumor heterogeneity. On the MRI-Linac, the available TDD contrast measured in asparagus showed the same trends as with the conventional MRI but remained close to typical measurement noise levels when simulated in common cancer cell sizes. On conventional MRI systems with moderate gradient strengths, the TDD contrast could potentially be used as a tool to identify which time-dependent effects to include when choosing a biophysical model for more specific tumor characterization.

Keywords: biologically guided radiotherapy; biophysical modeling; diffusion MRI; imaging biomarkers; time‐dependent diffusion.


Conflict of interest statement

H.L. is an inventor and has an interest in patents owned by RWI AB, Lund, Sweden, related to DW‐MRI methodologies not applied in this work. All other authors declare no conflicts of interest.

Figures

FIGURE 1
FIGURE 1
Illustrations of free diffusion (a), hindered and restricted diffusion (b), and diffusional exchange (c). Top row: Schematic representations of diffusion trajectories. Colored dots show the initial positions of example water molecules (blue: free diffusion; green: hindered diffusion; orange: restricted diffusion). Colored lines indicate the diffusion trajectories. Black circles indicate cell membranes (middle and right panel). D = diffusivity in free diffusion, D in = intracellular diffusivity, D ex = extracellular diffusivity, k = exchange rate. Bottom row: Representative DW‐MRI signal decay curves (AU) as a function of diffusion weighting (b‐value). Solid curve = DW‐MRI signal obtained with a shorter diffusion time (t). Dashed curve = signal obtained with a longer t. AU, arbitrary units; DW‐MRI, diffusion‐weighted magnetic resonance imaging.
FIGURE 2
FIGURE 2
Measuring diffusion. (a) A schematic of the PGSE diffusion encoding gradients (G diff). The measurement parameters δ (gradient duration), (gradient separation), and G (gradient strength) together with the gyromagnetic ratio (γ) define the amount of diffusion weighting (b) for square wave gradients. (b) Measurable diffusion length (black arrow) within a closed compartment (black circle) with infinitely short gradient pulses, which fulfill the SGP condition. Blue dots indicate the diffusional motion during the gradient pulses, whereas the dashed line indicates the diffusional motion between the gradients. (c) Measurable diffusion length (black arrow) with realistic, long gradient pulses. The solid parts of the diffusion trajectory indicate motion during the diffusion gradients, and the center‐of‐masses of these two trajectories are marked with crosses. PGSE, pulsed field gradient spin echo; SGP, short gradient pulse.
FIGURE 3
FIGURE 3
DW‐MRI signal and TDD contrast behavior in simulations. (a) Maps showing the DW‐MRI signal for gradient waveforms with multiple δ/ combinations in 12 different tissue microstructures (tiles). The color scale is different in each tile, allowing comparison of the direction of the signal gradient in different microstructures. The absolute signal values are shown with the isocontours. The locations of the maximum and minimum signals are marked with white squares. The three optimized gradient waveforms are marked with a black dot (WF1), a black cross (WF2), and a black circle (WF3). To maintain a sufficient signal‐to‐noise ratio in the actual measurements, the maximum echo time was restricted to 135 ms for the optimized waveforms (simulations were performed with echo times up to 155 ms). (b) Schematic representation of the optimized gradient waveforms for G max = 45 mT/m, b = 2500 s/mm2. Waveforms for G max = 15 mT/m, b = 1000 s/mm2 are shown in Figure S1. (c and d) The theoretical TDD contrast (AU) with the optimized waveforms. The green background color indicates possible cell sizes for asparagus cells, while the yellow background color indicates typical sizes for tumor cells., AU, arbitrary units; DW‐MRI, diffusion‐weighted magnetic resonance imaging; TDD, time‐dependent diffusion.
FIGURE 4
FIGURE 4
Diffusion time dependence in asparagus. (a) Results with the conventional MRI showing the ADC map (left), example TDD21 contrast map (right), and the mean DW‐MRI signal with the three gradient waveforms in asparagus and water ROIs (bottom). The asparagus ROI (red) and the water ROI (black) are shown in the ADC map and the TDD21 contrast map. The dashed box in the bottom panel shows the plotting area for the MRI‐Linac data. The error bars in the bottom panels correspond to ± 1σ. (b) Same as (a) but for the MRI‐Linac. (c) Optical microscopy of asparagus stems with 1 × (top) and 10 × (bottom) magnification. ADC, apparent diffusion coefficient; DW‐MRI, diffusion‐weighted magnetic resonance imaging; ROI, region of interest; TDD, time‐dependent diffusion.
FIGURE 5
FIGURE 5
The first four patient cases. The GTV (red contour) and three example ROIs (black contours with labels 1–3) are shown on T1w Gd and T2w FLAIR Gd images, ADC map, and TDD21 b = 2500 s/mm2 contrast map. The arrows in the two topmost rows indicate different regions in the tumors: viable tumor mass (yellow arrows), necrotic core (white arrows), and peritumoral T2w FLAIR Gd hyperintensity regions (blue arrows). The T2w FLAIR Gd hyperintensity had either low ADC values (yellow arrows) or high ADC values (white arrows). The TDD contrast maps showed areas of positive contrast (black arrows), indicating dominating restricted diffusion, and areas of negative contrast (white arrows), indicating dominating diffusional exchange. White dashed boxes in TDD contrast maps indicate the zoom‐in regions for Figure 6. ADC, apparent diffusion coefficient; GTV, gross tumor volume; T1w Gd, T1‐weighted gadolinium contrast; T2w FLAIR Gd, T2‐weighted FLAIR gadolinium contrast; TDD, time‐dependent diffusion; ROI, region of interest; WHO 4, World Health Organisation grade 4 glioma.
FIGURE 6
FIGURE 6
Examples of diffusion time dependence in brain lesions. The top row shows the magnifications of three regions defined in Figure 5. The black ROIs show examples of dominating restricted diffusion (ROI 1), dominating diffusional exchange (ROI 2), and no time dependence (ROI 3). The red contours indicate the location of the GTVs. The bottom row shows the ROI‐averaged DW‐MRI signals within ROIs 1–3 measured with two diffusion times (WF1: td  = 26 ms, WF2: td  = 44 ms) demonstrating the diffusion time dependence behind the different contrasts. DW‐MRI, diffusion‐weighted magnetic resonance imaging; GTV, gross tumor volume; ROI, region of interest.

Similar articles

Cited by

References

    1. Ling CC, Humm J, Larson S, et al. Towards multidimensional radiotherapy (MD‐CRT): biological imaging and biological conformality. Int J Radiat Oncol Biol Phys. 2000;47(3):551‐560. doi:10.1016/s0360-3016(00)00467-3 - DOI - PubMed
    1. Beaton L, Bandula S, Gaze MN, Sharma RA. How rapid advances in imaging are defining the future of precision radiation oncology. Br J Cancer. 2019;120(8):779‐790. doi:10.1038/s41416-019-0412-y - DOI - PMC - PubMed
    1. Webb S, Nahum AE. A model for calculating tumour control probability in radiotherapy including the effects of inhomogeneous distributions of dose and clonogenic cell density. Phys Med Biol. 1993;38(6):653‐666. doi:10.1088/0031-9155/38/6/001 - DOI - PubMed
    1. Horsman MR, Mortensen LS, Petersen JB, Busk M, Overgaard J. Imaging hypoxia to improve radiotherapy outcome. Nat Rev Clin Oncol. 2012;9(12):674‐687. doi:10.1038/nrclinonc.2012.171 - DOI - PubMed
    1. Gurney‐Champion OJ, Mahmood F, van Schie M, et al. Quantitative imaging for radiotherapy purposes. Radiother Oncol. 2020;146:66‐75. doi:10.1016/j.radonc.2020.01.026 - DOI - PMC - PubMed

MeSH terms

LinkOut - more resources