. 2024 Oct 10:13:RP95774.
doi: 10.7554/eLife.95774.

The conserved genetic program of male germ cells uncovers ancient regulators of human spermatogenesis

Affiliations

The conserved genetic program of male germ cells uncovers ancient regulators of human spermatogenesis

Rion Brattig-Correia et al. Elife. .

Abstract

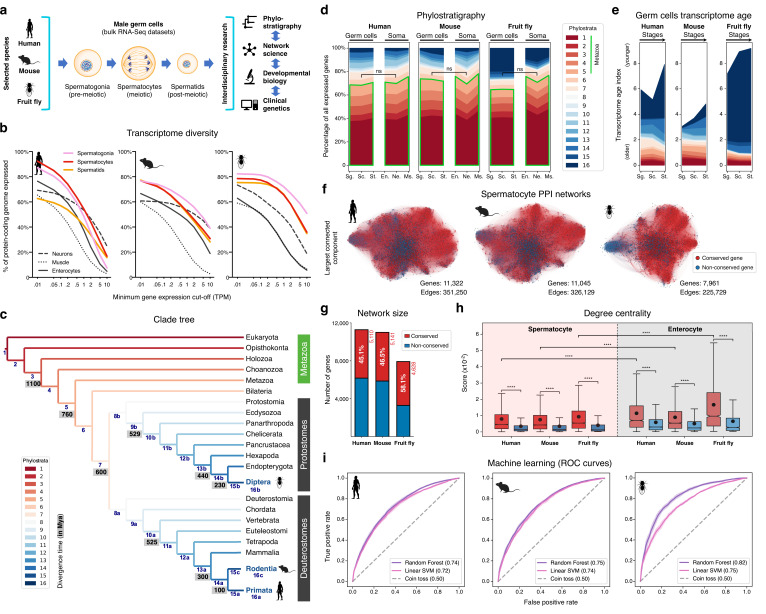
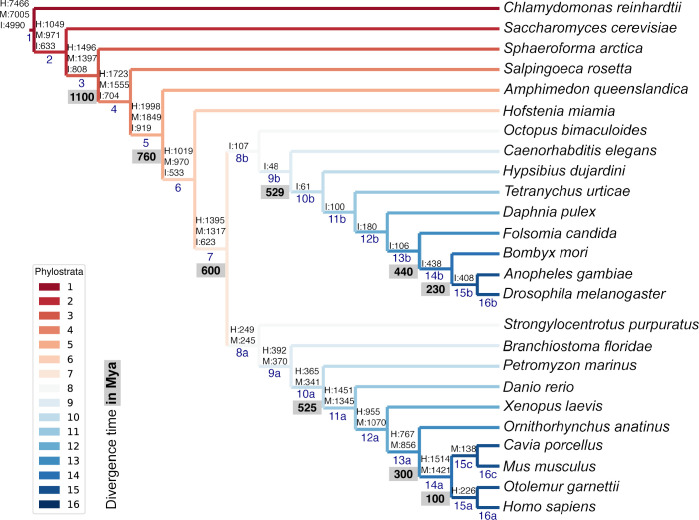
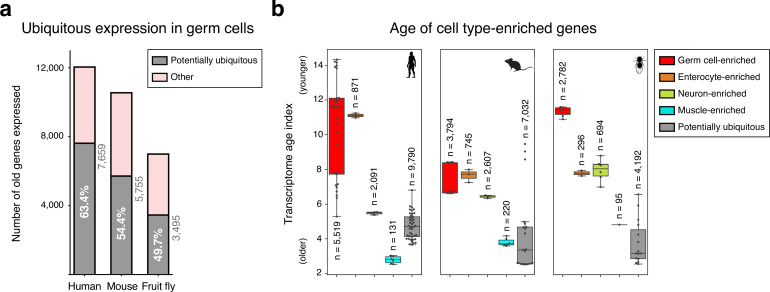
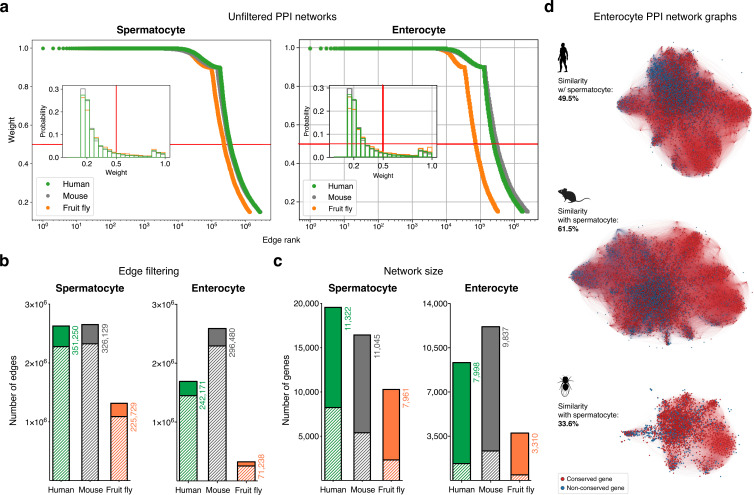
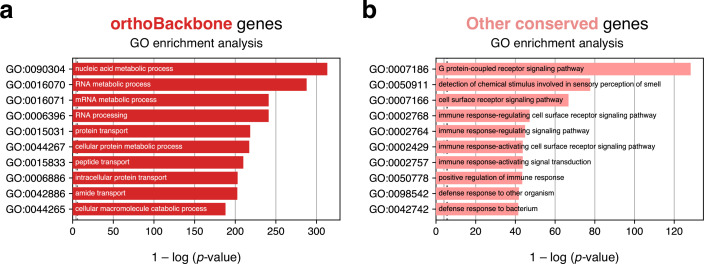
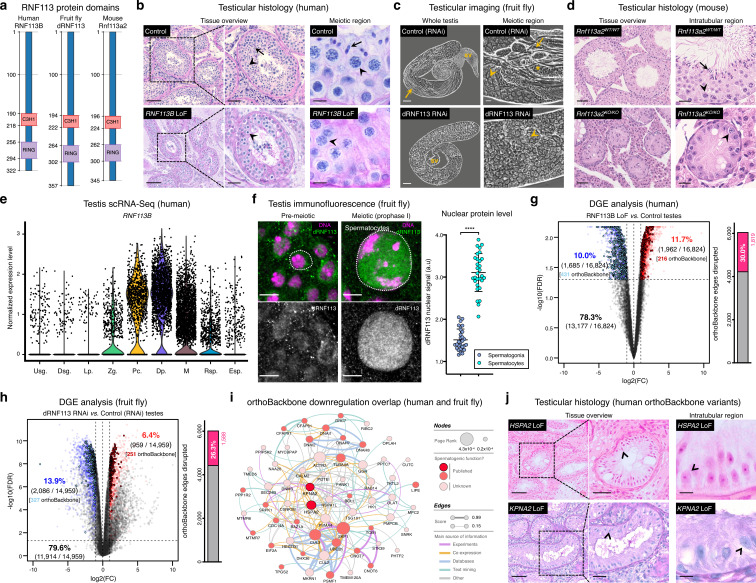
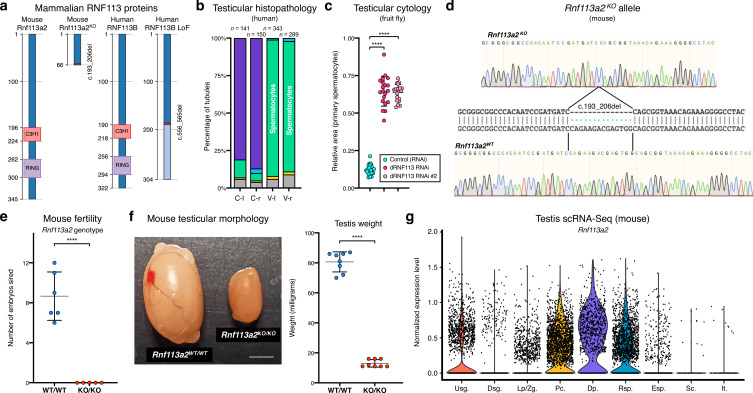
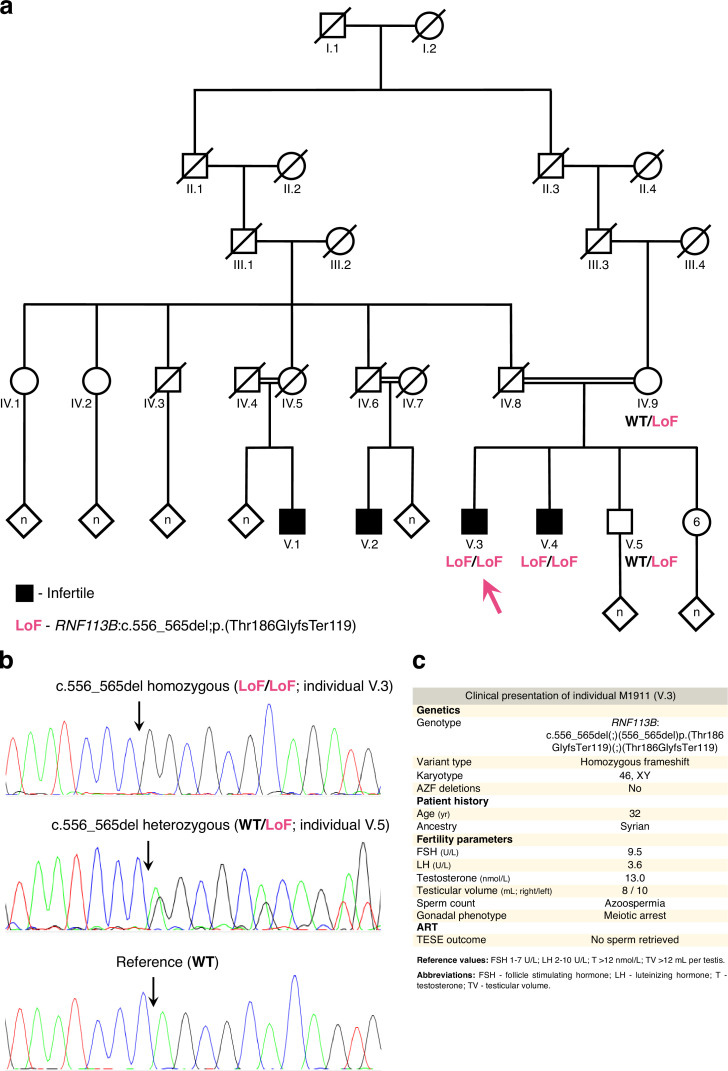
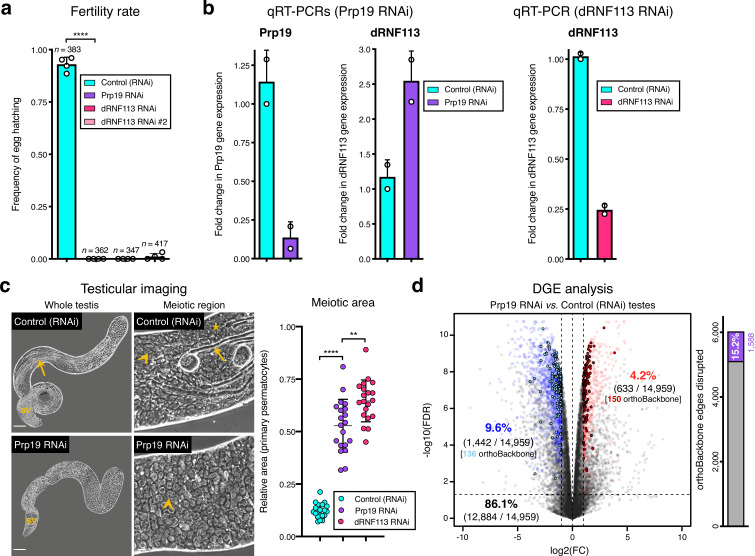
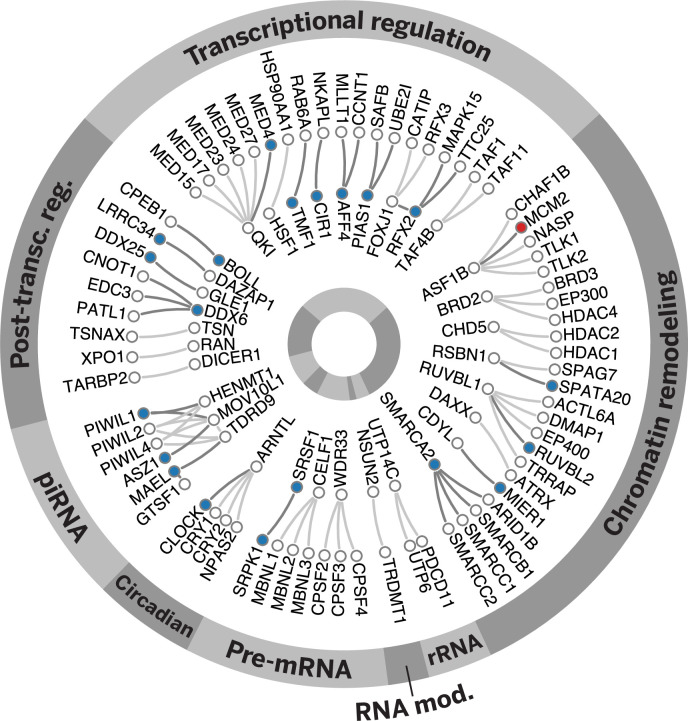
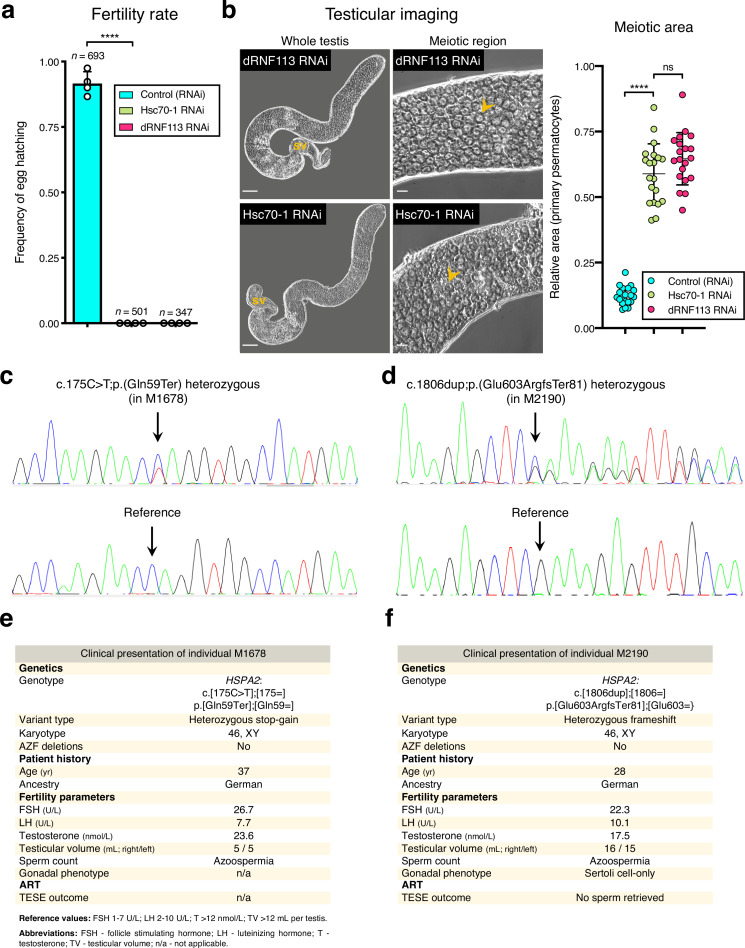
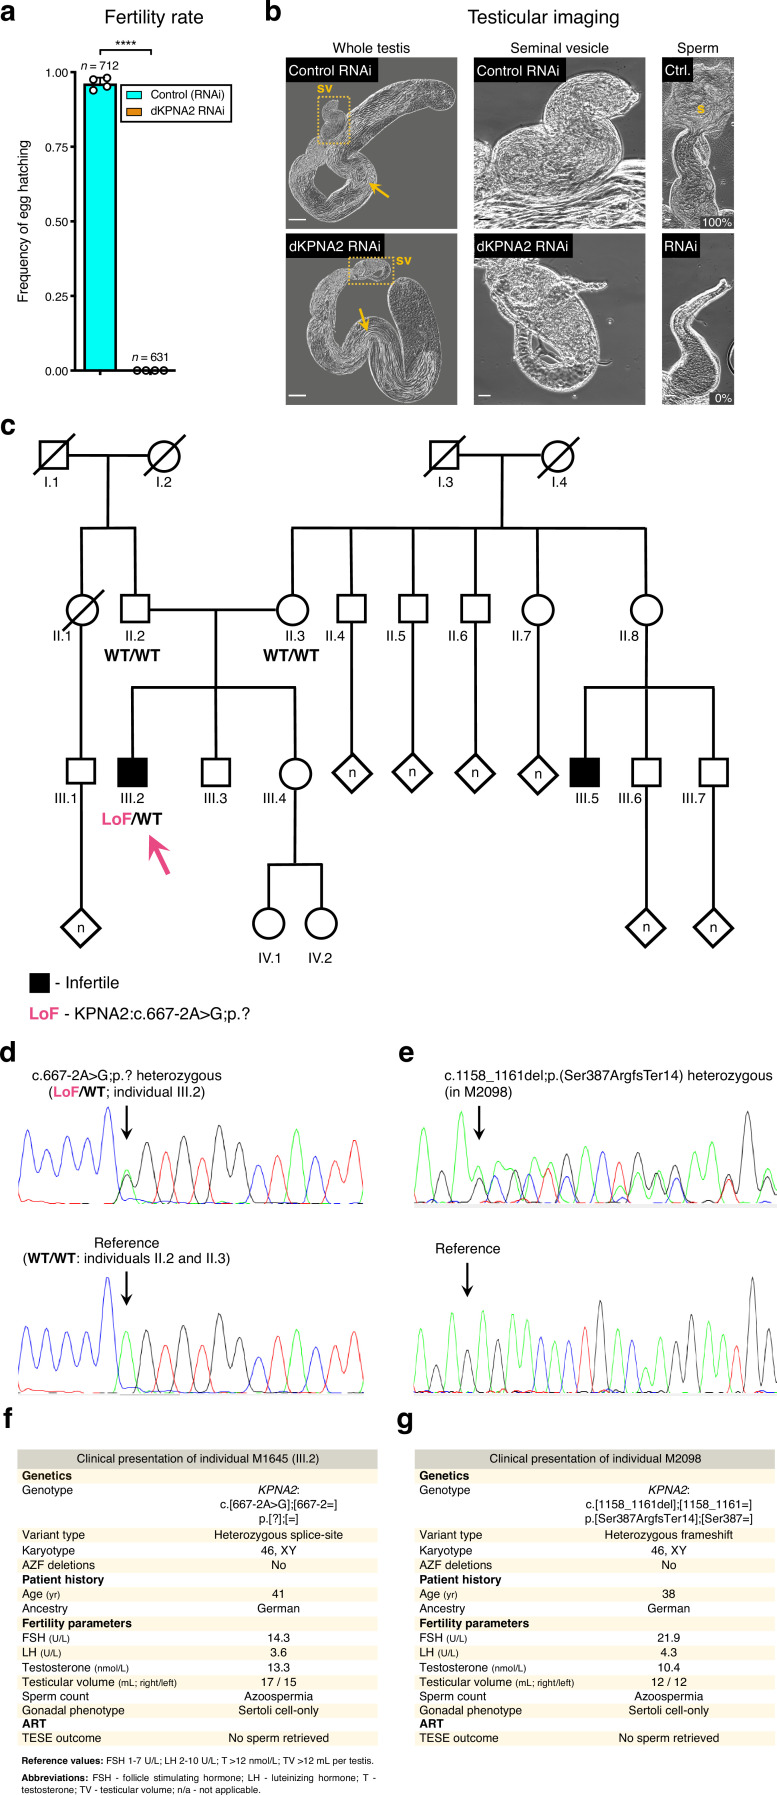
Male germ cells share a common origin across animal species, therefore they likely retain a conserved genetic program that defines their cellular identity. However, the unique evolutionary dynamics of male germ cells coupled with their widespread leaky transcription pose significant obstacles to the identification of the core spermatogenic program. Through network analysis of the spermatocyte transcriptome of vertebrate and invertebrate species, we describe the conserved evolutionary origin of metazoan male germ cells at the molecular level. We estimate the average functional requirement of a metazoan male germ cell to correspond to the expression of approximately 10,000 protein-coding genes, a third of which defines a genetic scaffold of deeply conserved genes that has been retained throughout evolution. Such scaffold contains a set of 79 functional associations between 104 gene expression regulators that represent a core component of the conserved genetic program of metazoan spermatogenesis. By genetically interfering with the acquisition and maintenance of male germ cell identity, we uncover 161 previously unknown spermatogenesis genes and three new potential genetic causes of human infertility. These findings emphasize the importance of evolutionary history on human reproductive disease and establish a cross-species analytical pipeline that can be repurposed to other cell types and pathologies.

Keywords: D. melanogaster; evolutionary biology; gene expression; germ cells; human; infertility; medicine; meiosis; mouse; spermatogenesis.

Plain language summary

Sperm are one of the most remarkable cells in nature, safely housing genetic information while also often moving through foreign environments in search of an egg to fertilize. Central for sexual reproduction, sperm cells of all shapes and sizes are found in animals, plants and even some species of fungi. You may be familiar with the streamlined structure of human sperm, for example, with its round head and flexible tail; but the sperm cells of fruit flies are about 300 times longer, and those found in mice have a hook-shaped head. Relatedly, the genes involved in the creation of reproductive cells often show rapid evolution, with their sequences quickly diverging between species. Due to the complexity of the network of genetic interactions taking place during sperm development, it has so far been difficult to fully isolate the ‘core program’ that governs sperm assembly and allows these cells to acquire their distinct identity. Whether this program could be conserved and shared across the tree of life, in particular, remains unclear. In response, Brattig-Correia, Almeida, Wyrwoll et al. first conducted analyses that allowed them to pinpoint the genes that were ‘switched on’ during the formation of human, mouse and fruit fly sperm. Assessing the ‘age’ of these genes showed that a large proportion had emerged early during evolution. Shared across the three species, these deeply conserved genes were shown to play a fundamental role in sperm cells acquiring and maintaining their identity. Further genetic experiments were conducted in fruit flies to refine these findings, highlighting a set of 161 previously unknown genes essential for sperm formation. By combining these results with genetic data from men unable to have children, Brattig-Correia, Almeida, Wyrwoll et al. were able to identify three new genes that could play a role in human infertility. This work emphasizes how our understanding of human reproductive development can benefit from examining this process in other species, and its evolutionary history. In particular, the knowledge gained from these comparative approaches could ultimately help develop better genetic tests and treatments for human infertility.


Conflict of interest statement

RB, JA, MW, IJ, DS, CM, SD, LG, HS, NS, PP, AN, AL, JB, SL, MM, SK, MM, LR, FT, JB, PN No competing interests declared

Figures

Figure 1.
Figure 1.. The male germ cell transcriptome has an old evolutionary origin.
(a) Overview of the experimental strategy. (b) The diversity of the male germ cell transcriptome substantially depends on lowly-expressed genes. Three representative somatic cell types are included for comparison. TPM: transcripts per million; see Supplementary file 1 for information on RNA-Seq datasets. (c) Clade tree for mapping the time of origin of genes in the three selected species: human (Primata), mouse (Rodentia), and fruit fly (Diptera). Genes assigned to phylostrata 1–5 are common to all metazoan species. Mya: million years ago; see Figure 1—figure supplement 1 for the list of representative species of each clade and the number of genes in each phylostratum. (d) The majority of genes expressed by male germ cells are common to all Metazoa (phylostrata 1–5, green outline). This fraction is similar to that found in representative somatic cell types of each selected species. Minimum average expression cut-off: TPM >1. ns- no significant difference (p>0.3472; Mann–Whitney U test). Sg.: Spermatogonia, Sc.: Spermatocytes, St.: Spermatids, En.: Enterocytes, Ne.: Neurons and Ms.: Muscle. (e) Post-meiotic male germ cells have younger transcriptomes than meiotic and pre-meiotic cells. Transcriptome age indices (TAIs) are split between the different phylostrata. (f) The spermatocyte transcriptome forms a large, structured network based on protein-protein interaction (PPI) data. Graphs represent the largest connected component of all spermatocyte-expressed genes (minimum average expression cut-off: TPM >1) according to STRING functional association scores. Gene conservation (across all Metazoa) was defined based on eggNOG orthogroups. Networks were filtered to only include edges with combined scores ≥0.5 (see Figure 1—figure supplement 3). (g) Spermatocyte PPI networks contain a substantial number of conserved genes. (h) Conserved genes (red) are more connected than non-conserved genes (blue) in both germ cell (spermatocyte) and somatic cell (enterocyte) PPI networks ****p<0.0001 (Kolmogorov-Smirnov test). (i) Machine-learning algorithms reliably predict the evolutionary conservation of spermatocyte-expressed genes based solely on PPI network features. Values correspond to AUC (area under the curve) scores. ‘Coin toss’ corresponds to a random classification. Fourfold cross-validation results are shown. ROC: receiver operating characteristic curves; SVM: support-vector machine; see Figure 1—figure supplement 5 for precision and recall curves.
Figure 1—figure supplement 1.
Figure 1—figure supplement 1.. List of representative species of each clade for the phylostratigraphic analysis.
Phylostrata are ranked from 1 (older, in red) to 16 (younger, in blue). The number of genes assigned to each phylostratum in the human (H), mouse (M), and fruit fly insect, (I) genomes is indicated above phylostratum rank. Divergence time (in grey) is indicated in million years ago (Mya).
Figure 1—figure supplement 2.
Figure 1—figure supplement 2.. Ubiquitously expressed genes in male germ cells.
(a) Number of potentially ubiquitously expressed old genes (mapping to the oldest-ranking phylostrata 1–5, see Figure 1d) in the male germ cell transcriptome. These were identified, in each species, by being also expressed in all three representative somatic cell types of the primary embryonic layers: neurons (ectoderm), muscle (mesoderm) and enterocytes (endoderm). Germ cells corresponds to spermatogonia +spermatocytes + spermatids. ‘Other’ corresponds to germ cell-enriched and variably expressed genes. Minimum expression cut-off: transcripts per million (TPM) >1. (b) Potentially ubiquitously expressed genes tend to be evolutionarily older than cell type-enriched genes, as determined by the transcriptome age index. Muscle is a noteworthy exception. Gene sets were determined irrespective of their age. Germ cell-enriched corresponds to spermatogonia + spermatocytes + spermatids. Dots represent replicates, n=number of genes in each group. Minimum expression cut-off: TPM >1.
Figure 1—figure supplement 3.
Figure 1—figure supplement 3.. Filtering the protein-protein interaction (PPI) networks.
(a) The majority of STRING functional association scores in unfiltered networks are weak (i.e. have a low combined score). All networks were filtered to only include interactions (edges) with a STRING combined score of ≥0.5 (cut-off represented by the red lines). (b) Filtering significantly reduced the total number of edges in the networks. Solid colors represent the number of remaining edges after filtering. (c) Filtering maintained the majority of expressed genes in the networks. Solid colors represent the number of remaining genes after filtering. (d) Graphs represent the largest connected component of the filtered enterocyte PPI network (minimum average expression cut-off: TPM >1). Gene conservation (across all Metazoa) was defined based on eggNOG orthogroups. For each species, the similarity between the enterocyte and spermatocyte PPI networks was assessed using the Jaccard similarity coefficient. See Figure 1f for the largest connected component of the spermatocyte networks.
Figure 1—figure supplement 4.
Figure 1—figure supplement 4.. Conserved genes have more connected interactors than non-conserved genes in protein-protein interaction networks.
Results of the page rank algorithm for both gene subsets across cell types and species. Red indicates conserved genes across all Metazoa (based on eggNOG orthogroups), and blue non-conserved genes. ****p<0.0001 (Kolmogorov-Smirnov test).
Figure 1—figure supplement 5.
Figure 1—figure supplement 5.. Precision and recall curves confirm the reliability of machine-learning algorithms in predicting evolutionary conservation of spermatocyte genes.
These curves plot positive predictive value (precision) against sensitivity (recall). Values correspond to AUC (area under the curve) scores. ‘Coin toss’ corresponds to a random classification. Note that unbalanced datasets can offset the baseline of the coin toss results. Four-fold cross-validation results are shown. SVM: support-vector machine.
Figure 1—figure supplement 6.
Figure 1—figure supplement 6.. Rewiring the spermatocyte protein-protein interaction networks.
(a) Effect on degree centrality metrics of randomly shuffling a variable percentage of all network edges. The difference between conserved and non-conserved genes is progressively attenuated but not erased. Gene conservation (across all Metazoa) was defined based on eggNOG orthogroups. (b) Same as in ‘a’, but for page rank metrics.
Figure 2.
Figure 2.. Functional analysis of the conserved genetic program of male germ cells.
(a) The orthoBackbone methodology. First, the most relevant associations are determined by defining the individual metric backbones (based on shortest paths) of protein-protein interaction (PPI) networks from different species. Of the backbone edges (in green), those connecting the same orthologous genes across the different species are selected as part of the evolutionarily conserved orthoBackbone (in red, with asterisks). In the case of a one-to-many conserved edge relationship, inclusion depends on at least one of the multiple edges being part of the backbone. Letters depict different genes, B’ and B’’ are paralogs, and numbers indicate distances between genes. (b) The orthoBackbone represents less than 3% of all functional interactions (edges) in the spermatocyte PPI networks. (c) The orthoBackbone connects >70% of all conserved genes expressed in spermatocytes. Gene conservation (across Metazoa) was defined based on eggNOG orthogroups. (d) orthoBackbone genes are preferentially involved in gene expression regulation compared with other equally conserved genes. Charts represent the top 5 terms of an unfiltered gene ontology (GO) enrichment analysis for biological processes of the human male germ cell orthoBackbone. False discovery rate ≤0.05; see Figure 2—figure supplement 1 for the expanded GO analyses. (e) The male germ cell orthoBackbone reveals a core set of 79 functional interactions between 104 gene expression regulators of spermatogenesis. Solid dots indicate genes with testis specific/enriched expression. Post-transc. reg.: Post-transcriptional regulation; RNA mod.: RNA modification. (f) Conserved mitosis-to-meiosis transcriptional burst genes were defined based on their upregulation at mammalian meiotic entry and/or downregulation at meiotic exit. In both cases, genes also had to be expressed in insect spermatogenesis. Green lines link orthologs (920 in fruit flies, 797 in humans and 850 in mice) based on eggNOG orthogroups. Expression level in normalized absolute log(FPKM +1). (g) An in vivo RNAi screen in fruit fly testes uncovers the functional requirement of 250 conserved transcriptional burst genes (27.2%) for male reproductive fitness. Silencing of the 920 genes was induced at the mitosis-to-meiosis transition using the bam-GAL4 driver. Color-code for the recorded testicular phenotype as in “h”. Results reflect a total of four independent experiments. Threshold for impaired reproductive fitness (red horizontal line) corresponds to a 75% fertility rate (>2 standard deviations of the mean observed in negative controls). (h) Conserved transcriptional burst genes are required for diverse spermatogenic processes. Testicular phenotypes of the 250 hits were defined by phase-contrast microscopy and assigned to five classes based on the earliest manifestation of the phenotype. (i) Transcriptional burst genes reveal 161 new, evolutionarily conserved regulators of spermatogenesis (64.4% of all hits, homologous to 179 and 187 in humans and mice, respectively). Phenotype novelty was defined by lack of previously published evidence of a role in male fertility/spermatogenesis in humans, mice or fruit flies. (j) All data acquired in this screen are freely available in the form of an open-access gene browser (Meiotic Navigator).
Figure 2—figure supplement 1.
Figure 2—figure supplement 1.. Top 10 terms of an unfiltered gene ontology (GO) enrichment analysis of the human male germ cell orthoBackbone.
Tested category: biological processes. (a) Spermatocyte orthoBackbone genes. (b) Other evolutionarily-conserved spermatocyte network genes not part of the orthoBackbone. Gene conservation (across all Metazoa) was defined based on eggNOG orthogroups. False discovery rate ≤0.05.
Figure 3.
Figure 3.. Deeply conserved regulators of human spermatogenesis.
(a) Similar domain structure of the RNF113 proteins in humans (RNF113B), fruit flies (dRNF113), and mice (Rnf113a2). All contain a C3H1-type zinc finger and a RING finger domain. Numbers indicate amino acid residue position. (b) Human RNF113B is required for meiotic progression past the primary spermatocyte stage. Testicular histology of M1911 [RNF113B loss of function (LoF) variant] and of a control sample with normal spermatogenesis. See Figure 3—figure supplement 1b for phenotype quantification. Arrowheads: primary spermatocytes; arrows: spermatids. Scale bars: 100 μm (overview), 50 μm (insets), and 10 μm (meiotic region). (c) Silencing fruit fly dRNF113 results in meiotic arrest. Phase-contrast microscopy. See Figure 3—figure supplement 1c for phenotype quantification. Arrowheads: primary spermatocytes; asterisks: early (round) spermatids; arrows: late (elongating) spermatids; sv- seminal vesicle. Scale bars: 50 μm (whole testis) and 20 μm (meiotic region). (d) Mouse Rnf113a2 is essential for spermatogenesis. Testes of whole-body homozygous Rnf113a2 knockout mice (Rnf113a2KO/KO) are essentially devoid of germ cells, with the rare occurrence of meiotic and pre-meiotic stages. The testicular histology of a wildtype littermate control (Rnf113a2WT/WT) is presented for comparison (normal spermatogenesis). See Figure 3—figure supplement 1d–g for additional data. Arrowheads: primary spermatocytes; arrows: spermatids. Scale bars: 50 μm (overview) and 20 μm (intratubular region). (e) Human RNF113B is predominantly expressed at meiotic entry. Data analyzed from our recently published single cell RNA-Seq atlas of normal spermatogenesis (Di Persio et al., 2021). Usg.: undifferentiated spermatogonia; Dsg.: differentiated spermatogonia / preleptotene; Lp.: leptotene; Zg.: zygotene; Pc.: pachytene; Dp.: diplotene; M: meiotic divisions; Rsp.: round spermatids; Esp.: elongating spermatids. (f) The nuclear levels of the fruit fly dRNF113 protein increase at meiotic entry. Images are maximum projections of the entire nuclear volume. Spermatocytes correspond to late prophase I cells. Dotted lines delimit the nuclear envelope (as assessed by fluorescent wheat germ agglutinin). Scale bar: 5 μm. a.u- arbitrary units. ****p<0.0001 (unpaired t-test). (g) RNF113B is required for normal gene expression during human spermatogenesis. Differential gene expression (DGE) analysis of RNA-Seq data obtained from testicular biopsies of M1911 (RNF113B LoF variant, left and right testis) and of three controls with normal spermatogenesis. Down and upregulated genes in blue and red, respectively. orthoBackbone differentially expressed genes (DEGs) are outlined. FC: fold change. FDR: false discovery rate. Edge disruption corresponds to the number of orthoBackbone edges containing at least one DEG. (h) dRNF113 regulates gene expression in the fruit fly male gonad. Whole testes samples (in triplicate) in both experimental conditions. (i) Network of functional associations between orthoBackbone genes downregulated both in the RNF113B LoF and dRNF113 RNAi. Node size indicates the result of the page rank metric in the spermatocyte protein-protein interaction network (measure of the connectivity of interacting genes), and color specifies if the gene has a known role in spermatogenesis (in any species). Testicular phenotype of men affected by variants in HSPA2 and KPNA2 (red nodes) are depicted in “j”. Edge thickness indicates STRING functional association scores, and color specifies the main source of data for the associations. (j) LoF variants in the orthoBackbone genes HSPA2 and KPNA2 are potentially associated with human male infertility. Testicular histology of individuals M2190 and M2098 (HSPA2 and KPNA2 variants, respectively) reveals a complete loss of germ cells (Sertoli cell-only phenotype). Arrowheads: Sertoli cells. Scale bars: 100 μm (overview), 50 μm (insets), and 10 μm (intratubular region).
Figure 3—figure supplement 1.
Figure 3—figure supplement 1.. The RNF113 proteins are required for male germ cell development across vertebrate and invertebrate species.
(a) Both the human RNF113B loss of function (LoF) variant and the mouse Rnf113a2KO allele severely disrupt protein structure. The two frameshift variants result in a truncated protein product lacking the C3H1-type zinc finger and RING finger domains. Numbers indicate amino acid residue position. (b) Quantification of the spermatogenic impairment phenotype associated with the human RNF113B LoF variant (in individual M1911). Testicular tubules were analyzed for the most advanced germ cell stage present: spermatogonia (yellow bars), spermatocytes (green), spermatids (blue), and Sertoli cells / tubular shadows (grey). C: control; V: RNF113B LoF variant. l and r indicate left and right testis, respectively. (c) Quantification of the spermatogenic impairment phenotype associated with the fruit fly dRNF113 RNAi. The fraction of the entire testis area occupied by primary spermatocytes was assessed. Two independent RNAi reagents were used. ****p<0.0001 (unpaired t-test). (d) The mouse Rnf113a2KO allele corresponds to a 14 nucleotide deletion in the coding region. See Materials and methods for experimental detail on the generation of this allele. (e) Male homozygous Rnf113a2KO/KO mice are sterile. The number of developing embryos per wildtype (FVB/N) female was determined 10 days after successful mating with 10-week-old males. Controls (Rnf113a2WT/WT) correspond to wildtype littermates. ****p<0.0001 (unpaired t-test). (f) Adult Rnf113a2KO/KO testes are abnormally small. Scale bar: 2 mm. Testis weight was determined at 10 weeks of age. ****p<0.0001 (unpaired t-test). (g) Mouse Rnf113a2 is expressed at the mitosis-to-meiosis transcriptional burst and in undifferentiated spermatogonia. Data analyzed from a previously published testis single cell RNA-Seq atlas of normal spermatogenesis Hermann et al., 2018. Usg.: undifferentiated spermatogonia; Dsg.: differentiated spermatogonia / preleptotene; Lp/Zg.: leptotene / zygotene; Pc.: pachytene; Dp.: diplotene; Rsp.: round spermatids; Esp.: elongating spermatids; Sc.: Sertoli cells; It.: intertubular cells (Leydig cells, endothelial cells, peritubular myoid cells).
Figure 3—figure supplement 2.
Figure 3—figure supplement 2.. The loss of function variant in RNF113B detected in individual M1911.
(a) Pedigree of M1911’s family. Black indicates a diagnosis of infertility. DNA was available for individuals IV.9, V.3 (M1911, arrow), V.4 and V.5. Note that the infertile individuals V.1 and V.2 are also the offspring of a consanguineous union between M1911’s ascendents. A simplified genotype is indicated. LoF (loss of function): c.556_565del;p.(Thr186GlyfsTer119); WT (‘wildtype’): reference allele. (b) Validation of the RNF113B LoF variant by Sanger sequencing. In all panels, arrows indicate the location of the variant / reference sequence. (c) Clinical presentation of M1911.
Figure 3—figure supplement 3.
Figure 3—figure supplement 3.. Silencing the spliceosome component Prp19 in the fruit fly testis.
Prp19 RNAi results in a comparable meiotic arrest phenotype to that of dRNF113, despite a less severe disruption of the orthoBackbone. (a) Prp19 is essential for male fertility. ****p<0.0001 (unpaired t-test). Male germ line driver: bam-GAL4. (b) Prp19 RNAi is highly effective in the testis and does not downregulate dRNF113 levels. For comparison, the efficiency of the dRNF113 RNAi is also represented (right). RT-qPCR: quantitative reverse transcription PCR. (c) Silencing Prp19 leads to a primary spermatocyte arrest comparable to that of the dRNF113 RNAi. Phase-contrast microscopy. Arrowheads: primary spermatocytes; asterisks: early (round) spermatids; arrows: late (elongating) spermatids; sv- seminal vesicle. Scale bars: 50 μm (whole testis) and 20 μm (meiotic region). Meiotic area indicates the fraction of the entire testis occupied by primary spermatocytes. ****p<0.0001 and **p=0.002 (unpaired t-tests). (d) Prp19 RNAi impacts the testicular transcriptome. Differential gene expression (DGE) analysis of RNA-Seq data obtained from whole testes samples (in triplicate) in both conditions. Down and upregulated genes in blue and red, respectively. orthoBackbone differentially expressed genes (DEGs) are outlined. FC: fold change. FDR: false discovery rate. Edge disruption corresponds to the number of orthoBackbone edges containing at least one DEG. orthoBackbone disruption is lower than in the dRNF113 RNAi (Figure 3h).
Figure 3—figure supplement 4.
Figure 3—figure supplement 4.. The loss of RNF113B has a considerable impact on the conserved genetic program of spermatogenesis.
The homozygous loss of function variant in RNF113B found in individual M1911 is associated with the disruption of 30 out of all 79 functional interactions that form a core component of the male germ cell genetic program. Disrupted interactions are labelled in dark grey and are determined based on the differential expression of at least one of its intervening genes in the testicular transcriptome of M1911. Genes found downregulated are indicated by blue circles, the single case of a gene found to be upregulated is indicated in red.
Figure 3—figure supplement 5.
Figure 3—figure supplement 5.. Association of HSPA2 loss-of-function variants and the fruit fly Hsc70-1 RNAi with male infertility.
(a) Hsc70-1, one of the fruit fly homologs of HSPA2, is essential for male fertility. ****p<0.0001 (unpaired t-test). Male germ line driver: bam-GAL4. (b) Silencing Hsc70-1 phenocopies the dRNF113 RNAi meiotic arrest. Phase-contrast microscopy. Arrowheads: primary spermatocytes; sv- seminal vesicle. Scale bars: 50 μm (whole testis) and 20 μm (meiotic region). Meiotic area indicates the fraction of the entire testis occupied by primary spermatocytes. ****p<0.0001 and ns: no significant difference (unpaired t-tests). (c) Validation of the HSPA2 heterozygous stop-gain variant in individual M1678 by Sanger sequencing. Arrows indicate the location of the variant / reference sequence. (d) Validation of the HSPA2 LoF variant in individual M2190 (heterozygous frameshift) by Sanger sequencing. (e) Clinical presentation of M1678. (f) Clinical presentation of M2190.
Figure 3—figure supplement 6.
Figure 3—figure supplement 6.. Association of KPNA2 loss-of-function variants and the fruit fly dKPNA2 RNAi with male infertility.
(a) dKPNA2, the fruit fly ortholog of KPNA2, is essential for male fertility. ****p<0.0001 (unpaired t-test). Male germ line driver: bam-GAL4. (b) Silencing dKPNA2 at meiotic entry aborts spermatogenesis at the late post-meiotic stage. Phase-contrast microscopy. Yellow dashed lines map the seminal vesicle (sv) insets. Note the lack of male gametes inside the seminal vesicles of the dKPNA2 RNAi, despite the presence of multiple elongating spermatids in the testis. These vesicles were either filled with cellular debris or empty. Arrows: late (elongating) spermatids; s- mature sperm; Ctr.- Control RNAi; RNAi- dKPNA2 RNAi. Twenty seminal vesicles were scored in each condition for the presence of mature sperm. Percentages refer to the release of male gametes from the scored vesicles. Scale bars: 50 μm (whole testis) and 20 μm (seminal vesicles). (c) Pedigree of individual M1645’s family. DNA was available for individuals II.2, II.3, and III.2 (M1645, arrow). Black indicates a diagnosis of infertility. Individual III.5 was diagnosed with infertility for unknown reasons. A simplified genotype is represented. LoF (loss of function): c.667–2A>G;p.?; WT (‘wildtype’): reference allele. (d) Validation of the KPNA2 LoF variant in M1645 by Sanger sequencing. Arrows indicate the location of the variant / reference sequence. (e) Validation of the KPNA2 LoF variant in individual M2098 (heterozygous frameshift) by Sanger sequencing. (f) Clinical presentation of M1645. (g) Clinical presentation of M2098.

Update of

  • doi: 10.1101/2022.03.02.482557
  • doi: 10.7554/eLife.95774.1
  • doi: 10.7554/eLife.95774.2

References

    1. Agarwal A, Mulgund A, Hamada A, Chyatte MR. A unique view on male infertility around the globe. Reproductive Biology and Endocrinology. 2015;13:37. doi: 10.1186/s12958-015-0032-1. - DOI - PMC - PubMed
    1. Alavattam KG, Maezawa S, Sakashita A, Khoury H, Barski A, Kaplan N, Namekawa SH. Attenuated chromatin compartmentalization in meiosis and its maturation in sperm development. Nature Structural & Molecular Biology. 2019;26:175–184. doi: 10.1038/s41594-019-0189-y. - DOI - PMC - PubMed
    1. Arendt D. The evolution of cell types in animals: emerging principles from molecular studies. Nature Reviews. Genetics. 2008;9:868–882. doi: 10.1038/nrg2416. - DOI - PubMed
    1. Azuma M, Ogata T, Yamazoe K, Tanaka Y, Inoue YH. Heat shock cognate 70 genes contribute to Drosophila spermatocyte growth progression possibly through the insulin signaling pathway. Development, Growth & Differentiation. 2021;63:231–248. doi: 10.1111/dgd.12734. - DOI - PubMed
    1. Baldarelli RM, Smith CM, Finger JH, Hayamizu TF, McCright IJ, Xu J, Shaw DR, Beal JS, Blodgett O, Campbell J, Corbani LE, Frost PJ, Giannatto SC, Miers DB, Kadin JA, Richardson JE, Ringwald M. The mouse gene expression database (GXD): 2021 update. Nucleic Acids Research. 2021;49:D924–D931. doi: 10.1093/nar/gkaa914. - DOI - PMC - PubMed

LinkOut - more resources