. 2024 Nov 22;9(22):e171585.
doi: 10.1172/jci.insight.171585.

Giantin mediates Golgi localization of Gal3-O-sulfotransferases and affects salivary mucin sulfation in patients with Sjögren's disease

Affiliations

Giantin mediates Golgi localization of Gal3-O-sulfotransferases and affects salivary mucin sulfation in patients with Sjögren's disease

Matilde Nuñez et al. JCI Insight. .

Abstract

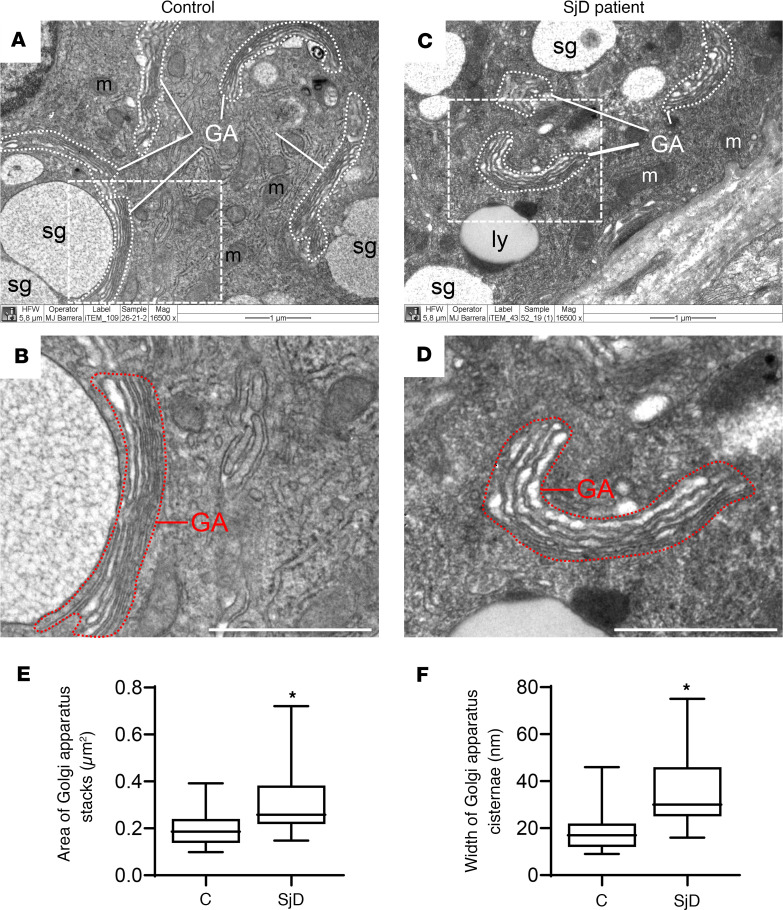
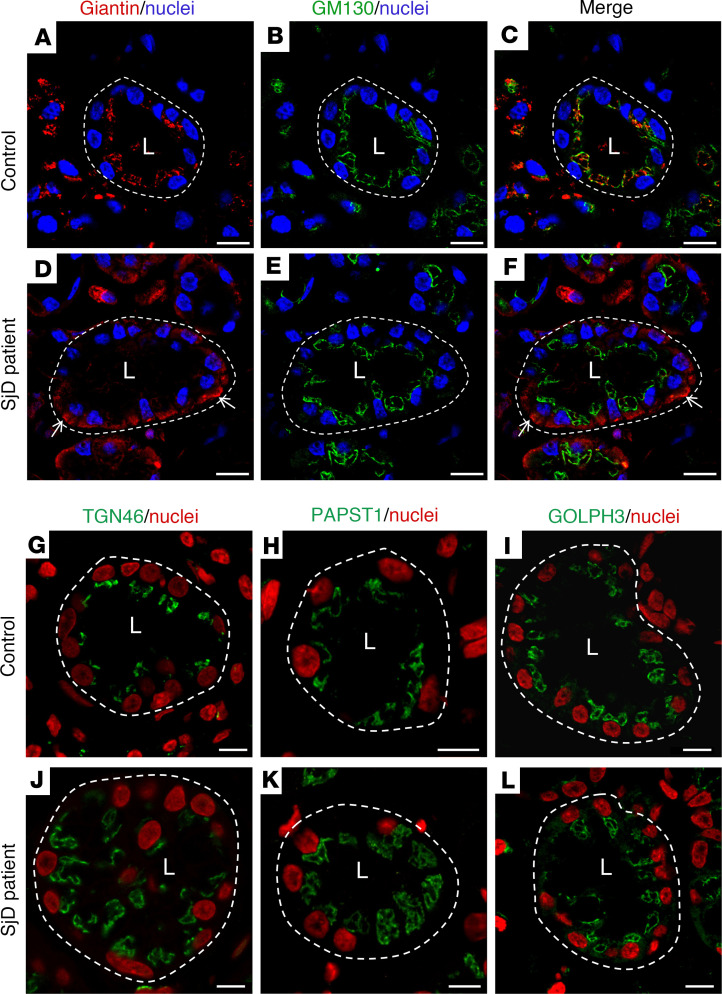
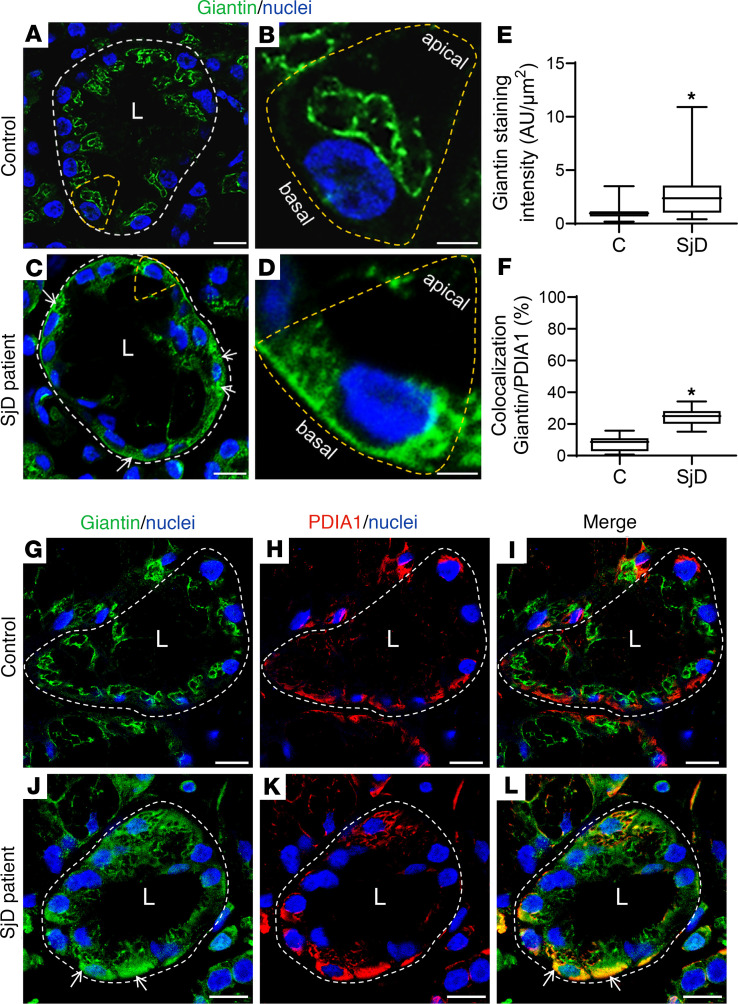
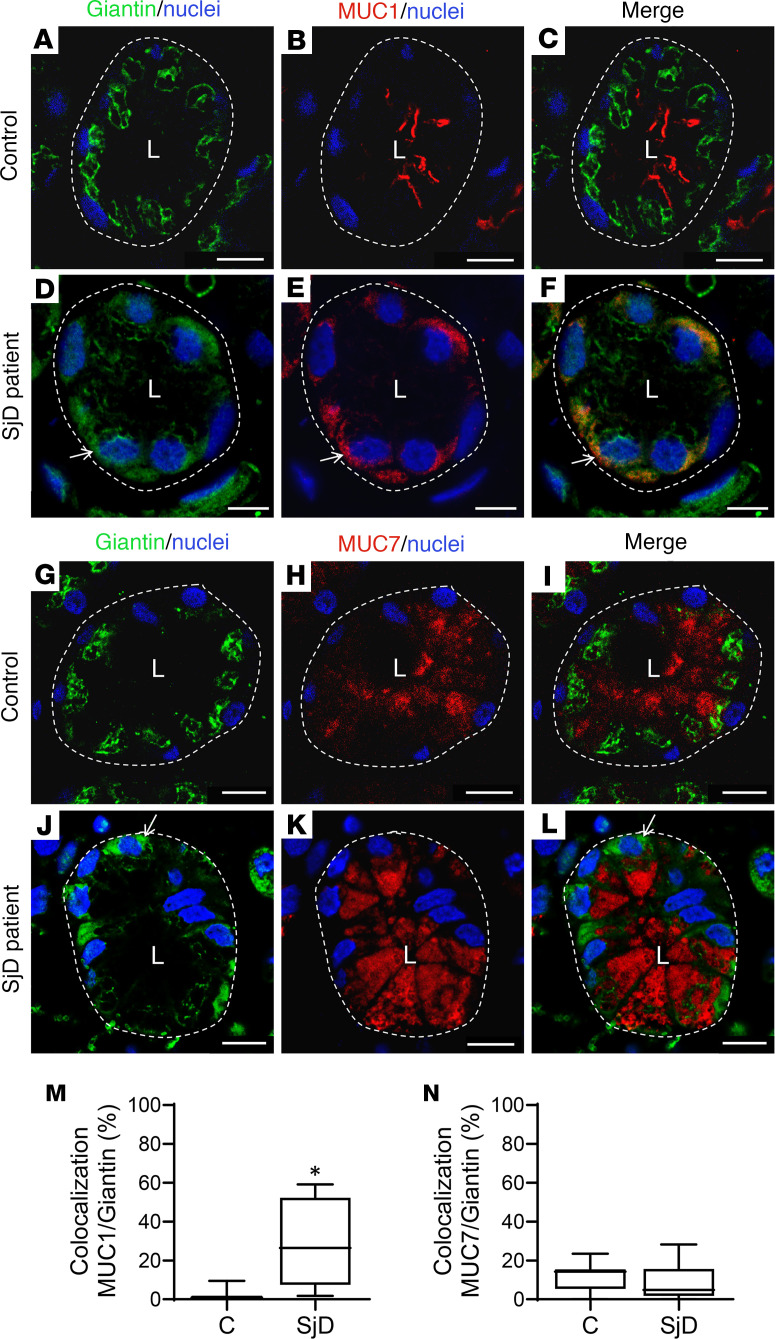
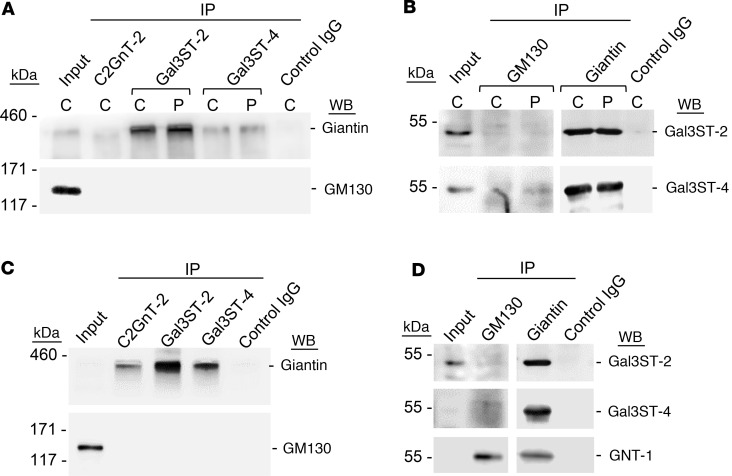
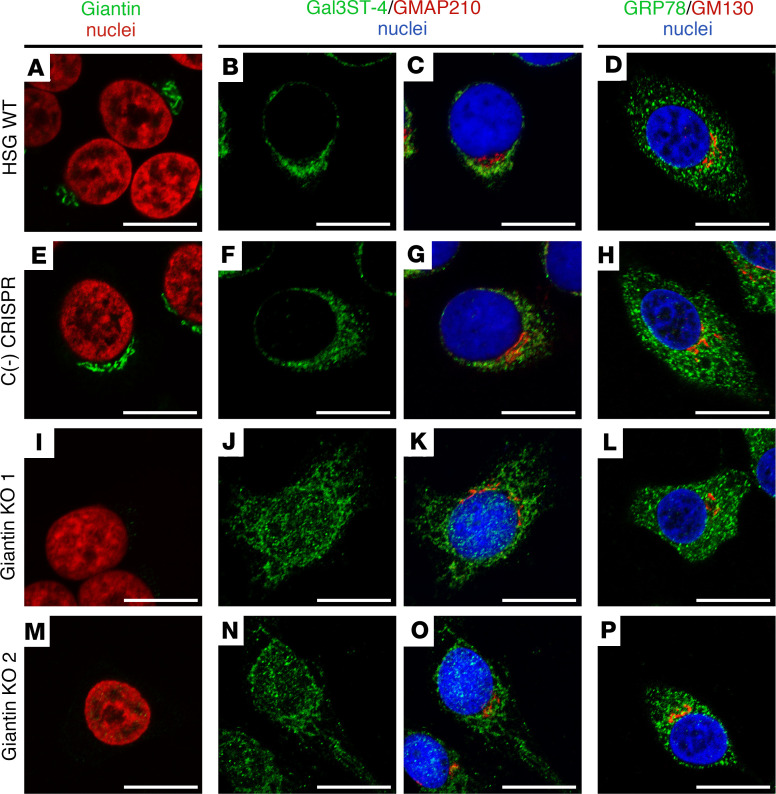
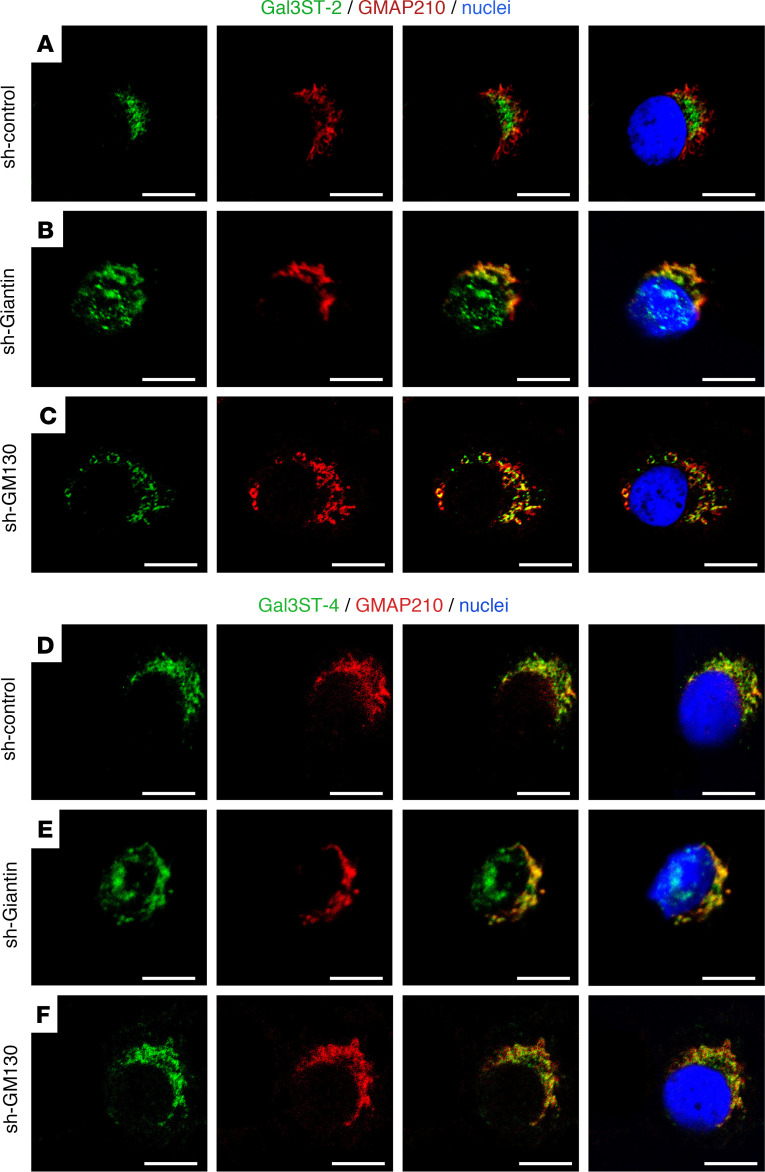
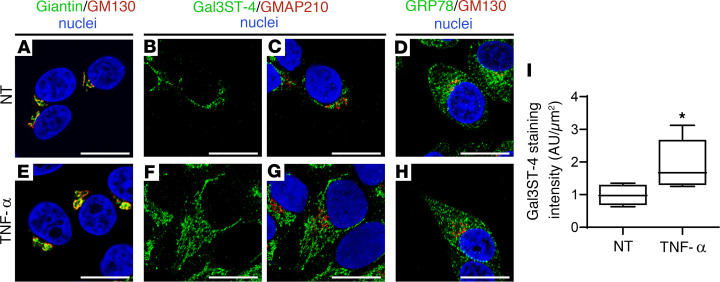
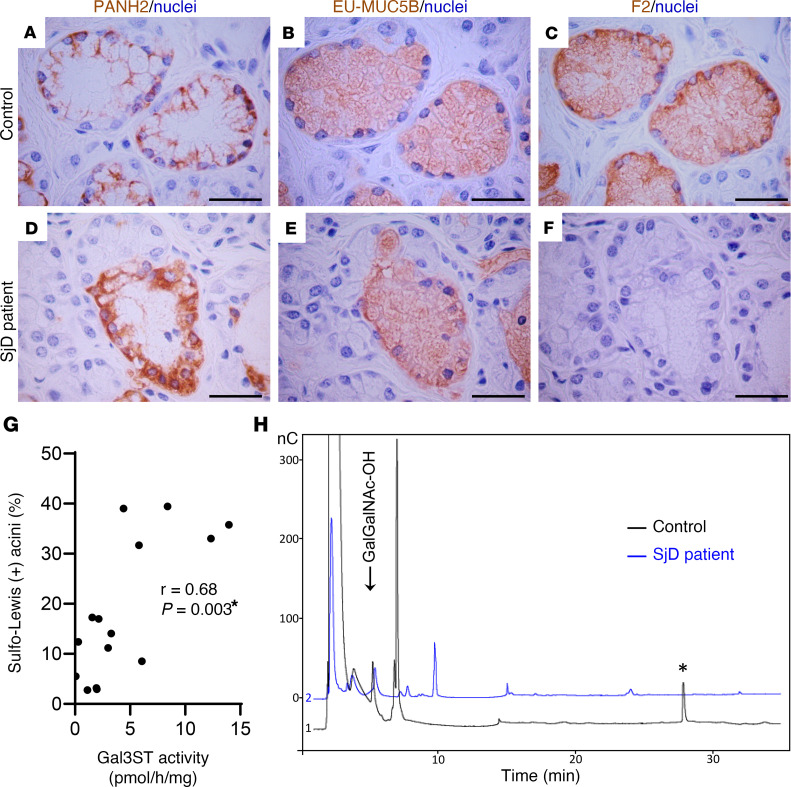
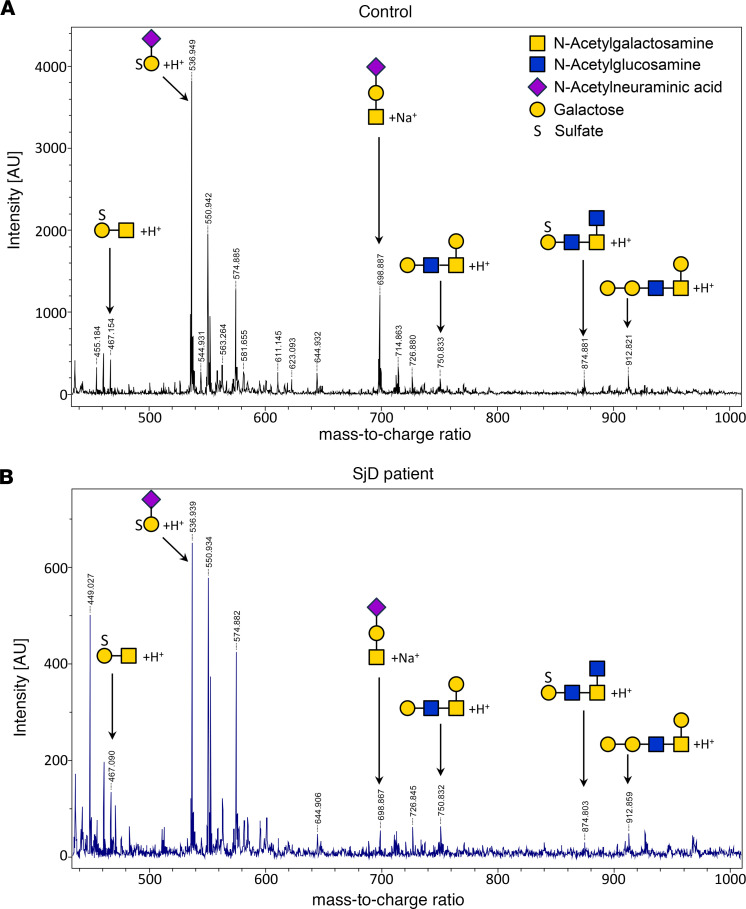
Sjögren's disease is a chronic autoimmune disease characterized by symptoms of oral and ocular dryness and extraglandular manifestations. Mouth dryness is not only due to reduced saliva volume, but also to alterations in the quality of salivary mucins in patients with Sjögren's disease. Mucins play a leading role in mucosa hydration and protection, where sulfated and sialylated oligosaccharides retain water molecules at the epithelial surface. The correct localization of glycosyltransferases and sulfotransferases within the Golgi apparatus determines adequate O-glycosylation and sulfation of mucins, which depends on specific golgins that tether enzyme-bearing vesicles. Here, we show that a golgin called Giantin was mislocalized in salivary glands from patients with Sjögren's disease and formed protein complexes with Gal3-O-sulfotransferases (Gal3STs), which changed their localization in Giantin-knockout and -knockdown cells. Our results suggest that Giantin could tether Gal3ST-bearing vesicles and that its altered localization could affect Gal3ST activity, explaining the decreased sulfation of MUC5B observed in salivary glands from patients with Sjögren's disease.

Keywords: Autoimmune diseases; Autoimmunity; Cell biology; Glycobiology; Protein traffic.


Figures

Figure 1
Figure 1. Swelling of the Golgi apparatus cisterns in epithelial cells of LSGs from patients with SjD.
(AD) Representative transmission electron micrographs showing the Golgi apparatus (GA) stacks surrounded by white dashed lines in salivary epithelial cells of an individual acting as a control and a patient with SjD. Scale bars: 1 μm. m, mitochondria; sg, secretory granule; ly, lysosome. (B and D) Higher-magnification images of regions bound by dashed lines in A and C, showing the GA stacks bound by red dashed lines. (E and F) Box plots showing the area of the Golgi apparatus stacks and the width of the Golgi apparatus cisternae. The quantification was performed on ultrathin sections from 3 individuals acting as controls and 6 patients with SjD. Boxes represent the 25th–75th percentiles; the lines within the boxes represent the median; and the whiskers represent the minimum and maximum. *P < 0.05 was considered significant using the Mann-Whitney test.
Figure 2
Figure 2. Altered localization of Giantin in LSGs from patients with SjD.
(AF) Representative micrographs of double staining of Giantin (red) and GM130 (green) in a section of LSG from an individual acting as a control (AC) and a patient with SjD (DF). White arrows show Giantin staining in the basolateral region. (GL) Representative images of TGN46, PAPST1, and GOLPH3 in LSG sections from individuals acting as controls (GI) and patients with SjD (JL). Hoechst 33342 was used for nuclear staining. The white dashed lines indicate acinar boundaries. L, lumen. Scale bars: 20 μm (AF); 10 μm (GL).
Figure 3
Figure 3. Increased Giantin protein levels in LSGs from patients with SjD.
(A–D) Representative images of Giantin (green) staining in LSG sections from individuals acting as controls and patients with SjD. (B and D) Higher-magnification images of epithelial cells surrounded by yellow dashed lines in A and C, respectively. (E) Giantin staining was quantified in acini from LSG sections of 5 individuals acting as controls and 5 patients with SjD. (F) Colocalization analysis of Giantin and PDIA1 in acini from LSG sections of 5 individuals acting as controls and 5 patients with SjD. Boxes represent the 25th–75th percentiles; the lines within the boxes represent the median; and the whiskers represent the minimum and maximum. *P < 0.05 was considered significant using the Mann-Whitney test. (GL) Representative micrographs of double staining of Giantin (green) and PDIA1 (red) in a section of LSG from individuals acting as controls (GI) and patients with SjD (JL). Hoechst 33342 (blue) was used for nuclear staining. White arrows show Giantin staining in the basolateral region. The broken lines indicate acinar boundaries. L, lumen. Scale bars: 20 μm (A and C); 5 μm (B and D); 10 μm (GI and JL).
Figure 4
Figure 4. Altered localization of Giantin and mucins in LSGs from patients with SjD.
(AF) Representative micrographs of double staining of Giantin (green) and MUC1 (red) in a section of LSG from an individual acting as a control (AC) and a patient with SjD (DF). (GI) Representative micrographs of double staining of Giantin (green) and MUC7 (red) in a section of LSG from an individual acting as a control (GI) and patient with SjD (JI). Hoechst 33342 (blue) was used for nuclear staining. The dashed lines indicate acinar boundaries. L, lumen. Scale bars: 10 μm. (M and N) Colocalization analysis of Giantin and mucins in acini from LSG sections of 5 individuals acting as controls and 5 patients with SjD. Boxes represent the 25th–75th percentiles; the lines within the boxes represent the median; and the whiskers represent the minimum and maximum. *P < 0.05 was considered significant using the Mann-Whitney test.
Figure 5
Figure 5. Formation of protein associations between Giantin and Gal3STs.
(A) C2GNT-2, Gal3ST-2, and Gal3ST-4 were immunoprecipitated (IP) from protein extracts of LSG from individuals acting as controls (C) and patients with SjD (P) and then analyzed by Western blot (WB) with anti-Giantin (~376 kDa) or anti-GM130 (130 kDa) antibodies. (B) GM130 and Giantin were IP from protein extracts of LSGs from individuals acting as controls and patients with SjD (P) and then analyzed by WB with anti–Gal3ST-2 (46 kDa) and anti–Gal3ST-4 (54 kDa) antibodies. (C) C2GNT-2, Gal3ST-2, and Gal3ST-4 were IP from protein extracts of HSG cells and then analyzed by WB with anti-Giantin or anti-GM130 antibodies. (D) GM130 and Giantin were IP from protein extracts of HSG cells and then analyzed by WB with Gal3ST-2 and Gal3ST-4 antibodies. The enzyme GNT-1 (57 kDa) was used as a positive control of IP GM130 and Giantin. For all experiments, the control IgG was α6 integrin.
Figure 6
Figure 6. Altered Gal3ST-4 localization in Giantin-KO cells.
(AD) Representative micrographs of WT HSG cells, (EH) negative control [C(-)] CRISPR/Cas9 HSG cells, and (IP) CRISPR/Cas9 Giantin-KO cells. A, E, I, and M show Giantin (green) and nuclei (red). B, F, J, and N show the green channel of the double staining of Gal3ST-4 (green) and GMAP210 (red). C, G, K, and O show the merged RGB channels. D, H, L, and P show the merged RGB channels of the double staining of GRP78 (green) and GM130 (red). Hoechst 33342 (blue) was used for nuclear staining. Scale bars: 10 μm.
Figure 7
Figure 7. Altered Gal3ST-2 and Gal3ST-4 localization in sh-Giantin cells.
Representative micrographs of double staining of Gal3STs (green) and GMAP210 (red) in HSG cells. (A) In sh-control cells, Gal3ST-2 is located adjacent to the nucleus and partially colocalizes with GMAP210. (B) In sh-Giantin cells, Gal3ST-2 distribution changes, with diffuse staining “on the nucleus.” (C) Gal3ST-2 detection in sh-GM130 cells shows a distribution similar to sh-control cells. (D) In sh-control cells, Gal3ST-4 is located adjacent to the nucleus and partially colocalizes with GMAP210. (E) In sh-Giantin cells, Gal3ST-4 distribution changes, with diffuse staining “on the nucleus.” (F) Gal3ST-4 detection in sh-GM130 cells shows a distribution similar to that of sh-control cells. Hoechst 33342 (blue) was used for nuclear staining. Scale bars: 10 μm.
Figure 8
Figure 8. Altered Gal3ST-4 localization in TNF-α–stimulated HSG cells.
Representative micrographs of (AD) nontreated (NT) HSG cells or (EH) HSG cells stimulated with 10 ng/mL TNF-α for 24 hours. (A and E) The merged RGB channels of the double staining of Giantin (green) and GM130 (red). (B and F) The green channel of the double staining of Gal3ST-4 (green) and GMAP210 (red). (C and G) The merged RGB channels. (D and H) The merged RGB channels of the double staining of GRP78 (green) and GM130 (red). Hoechst 33342 (blue) was used for nuclear staining. Scale bars: 10 μm. (I) Box plot showing the quantification of Gal3ST-4 staining. Boxes represent the 25th–75th percentiles; the lines within the boxes represent the median; and the whiskers represent the minimum and maximum. *P < 0.05 was considered significant using the Mann-Whitney test.
Figure 9
Figure 9. Decreased MUC5B sulfated O-glycans in LSGs from patients with SjD.
(AF) Representative images of immunohistochemical detection of partially glycosylated MUC5B (PANH2) (A and D), the MUC5B polypeptide backbone independent of its glycosylation status (EU-MUC5Bb) (B and E), and sulfo-Lewis a and c residues (F2) (C and F) in serial sections of LSGs from individuals acting as controls (AC) and patients with SjD (DF). Scale bars: 50 μm. (G) Spearman’s correlation between Gal3STs activity and the percentage of sulfo-Lewis a and c (F2)-positive acini. *P < 0.05 was considered significant. (H) Oligosaccharide mixtures of MUC5B obtained by reductive β-elimination analyzed by HPAEC-PAD in LSGs from individuals acting as controls (black line) and patients with SjD (blue line). The asterisk in H shows a peak detected in control samples but not in SjD samples. nC, chromatographic fingerprint of the signal.
Figure 10
Figure 10. Decreased abundance of MUC5B-associated oligosaccharides in LSGs from patients with SjD.
The oligosaccharide mixtures of MUC5B, obtained by reductive β-elimination in LSGs from individuals acting as controls (A) and patients with SjD (B), were also analyzed by UV-MALDI-TOF mass spectrometry. Signals for sulfated and nonsulfated oligosaccharides were detected; however, the abundance observed in samples from patients with SjD showed a substantial reduction (spectra are shown on different scales). O-glycan structures are depicted using the symbol nomenclature for glycans (SNFG).

References

    1. Vivino FB, et al. Sjogren’s syndrome: an update on disease pathogenesis, clinical manifestations and treatment. Clin Immunol. 2019;203:81–121. doi: 10.1016/j.clim.2019.04.009. - DOI - PubMed
    1. Vivino FB. Sjogren’s syndrome: clinical aspects. Clin Immunol. 2017;182:48–54. doi: 10.1016/j.clim.2017.04.005. - DOI - PubMed
    1. Rostron J, et al. Health-related quality of life in patients with primary Sjogren’s syndrome and xerostomia: a comparative study. Gerodontology. 2002;19(1):53–59. doi: 10.1111/j.1741-2358.2002.00053.x. - DOI - PubMed
    1. Eliasson L, et al. Feeling of dry mouth in relation to whole and minor gland saliva secretion rate. Arch Oral Biol. 2009;54(3):263–267. doi: 10.1016/j.archoralbio.2008.09.001. - DOI - PubMed
    1. Fusconi M, et al. Qualitative mucin disorders in patients with primary Sjögren’s syndrome: a literature review. Med Oral Patol Oral Cir Bucal. 2021;26(1):e71–e77. doi: 10.4317/medoral.23996. - DOI - PMC - PubMed