. 2024 Nov 8;9(21):e185687.
doi: 10.1172/jci.insight.185687.

High-dimensional analysis of NK cells in kidney transplantation uncovers subsets associated with antibody-independent graft dysfunction

Affiliations

High-dimensional analysis of NK cells in kidney transplantation uncovers subsets associated with antibody-independent graft dysfunction

Dan Fu Ruan et al. JCI Insight. .

Abstract

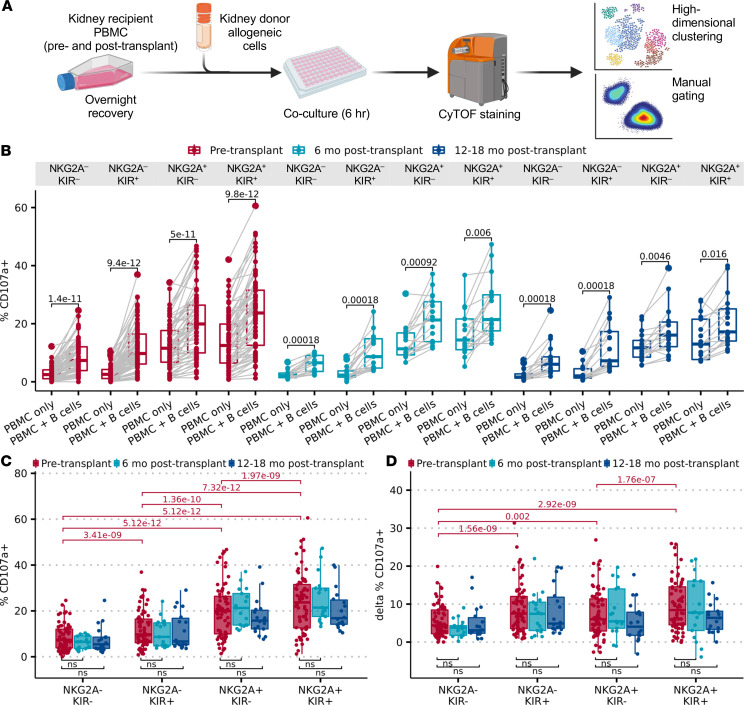
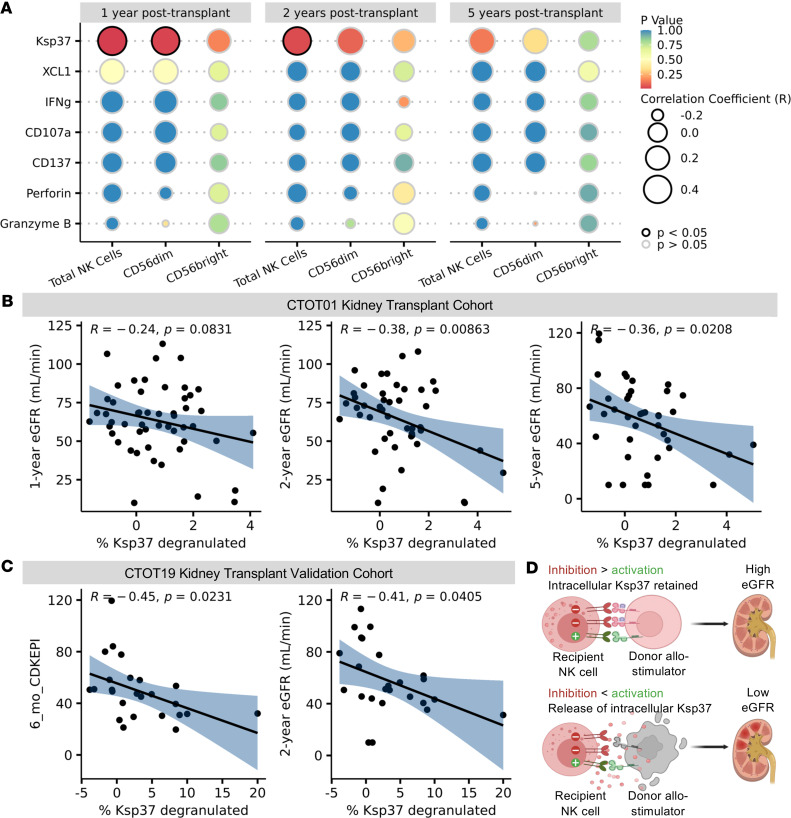
Natural killer (NK) cells respond to diseased and allogeneic cells through NKG2A/HLA-E or killer cell immunoglobulin-like receptor (KIR)/HLA-ABC interactions. Correlations between HLA/KIR disparities and kidney transplant pathology suggest an antibody-independent pathogenic role for NK cells in transplantation, but the mechanisms remain unclear. Using CyTOF to characterize recipient peripheral NK cell phenotypes and function, we observed diverse NK cell subsets among participants who responded heterogeneously to allo-stimulators. NKG2A+KIR+ NK cells responded more vigorously than other subsets, and this heightened response persisted after kidney transplantation despite immunosuppression. In test and validation sets from 2 clinical trials, pretransplant donor-induced release of cytotoxicity mediator Ksp37 by NKG2A+ NK cells correlated with reduced long-term allograft function. Separate analyses showed that Ksp37 gene expression in allograft biopsies lacking histological rejection correlated with death-censored graft loss. Our findings support an antibody-independent role for NK cells in transplant injury and support further testing of pretransplant, donor-reactive, NK cell-produced Ksp37 as a risk-assessing, transplantation biomarker.

Keywords: Immunology; NK cells; Organ transplantation; Transplantation.


Figures

Figure 1
Figure 1. Clinical sample availability and experimental design.
Consort table of (A) CTOT01 kidney transplant cohort (B) CTOT19 validation kidney transplant cohort and (C) healthy cohort. (D) Timeline of blood collection for CTOT01 cohort.
Figure 2
Figure 2. NK cells are highly diverse and vary in phenotype and composition across healthy donors and kidney transplant recipients.
Cyropreserved PBMCs from healthy donor (n = 20) and CTOT01 kidney transplant recipients (n = 70) were profiled by CyTOF. (A) UMAP of unsupervised RPhenograph clustering of peripheral blood–derived NK cell subsets of NK cells found across stages 4, 5, and 6 of NK cell development. (B) Box-and-whisker plots show spread of inverse Simpson scores across healthy donors (n = 20) and CTOT01 participants (n = 70) before transplantation for each population. Lines indicate mean of inverse Simpson scores. (C) Heatmap shows median expression of CyTOF antibodies defining NK cell clusters. (D) Relative proportion of each RPhenograph cluster within NK cells of each participant.
Figure 3
Figure 3. Cocultures of NK cells and allo-donor cells reveal variable alloreactivity that transcends donor differences and is maintained after transplantation.
(A) Cryopreserved pretransplant (n = 70) and posttransplant (n = 36) PBMCs from CTOT01 kidney transplant were recovered overnight in 10 ng/mL rhIL-15 and stimulated with donor allo-stimulator B cells for 6 hours at an E/T ratio of 3:1. Results were profiled by CyTOF and subsets were defined by gating on CD56dim NK cells followed by Boolean gating of educating inhibitory receptors NKG2A, KIR3DL1, KIR3DL2, KIR2DL1, and KIR2DL3. (B) Paired box-and-whisker plot shows change in percentage CD107a+ in recipient NK cells before transplantation (n = 70) and after transplantation (n = 36) with and without stimulation by donor B cells. (C) Box-and-whisker plot shows percentage CD107a+ in recipient NK cell subsets in coculture with donor cells across pre- and posttransplant time points. (D) Box-and-whisker plot shows B cell–dependent increase in percentage CD107a+ (stimulated – baseline %CD107a+) in recipient NK cell subsets at pre- and posttransplant time points. P values shown above the samples reflect Wilcoxon’s test with Bonferroni’s correction.
Figure 4
Figure 4. Increased Ksp37 degranulation in NK cells inversely correlates with lower estimated glomerular filtration rate (eGFR).
(A) Bubble plot of correlations between change in percentage of effector molecule–positive cells among NK cells after allo-donor stimulation (percentage in B cell coculture – percentage in baseline) and eGFR at 1 year (n = 52), 2 years (n = 47), and 5 years (n = 40) in CTOT01. (B) Percentage Ksp37 degranulated calculated as percentage Ksp37+ cells among total NK cells in B cell coculture condition minus PBMC-only condition. eGFR values were calculated with CKD-EPI formula and patients with graft failure were assigned eGFR = 10 mL/min. Scatter plots show inverse correlation of Ksp37 degranulation in CD57NKG2A+KIR NK cells with eGFR. (C) Scatter plots show inverse correlation of Ksp37 degranulation in CD57NKG2A+KIR NK cells and 6-month and 2-year eGFR (n = 25) in CTOT19 validation cohort. (D) Model of Ksp37 release induced by allogeneic donor cell leading to reduced kidney allograft function. Correlation coefficient and P value shown for Pearson’s correlation.
Figure 5
Figure 5. NK cell subsets enriched for education are more potent allo-reactive killers.
Flow-sorted NK cells from healthy donors were cocultured with K562 and allo-stimulator B cells at an E/T ratio of 1:1 for 5 hours to assess NK cell killing and activation. Box-and-whisker plots show (A) K562 cell death and (B) allo-stimulator cell death at baseline and with addition of purified NK cell subsets in culture across 3 technical replicates. (C) Correlation of NK cell Ksp37 release with percentage of K562 death and (D) allo-stimulator cell death. P values in A and B were calculated using a 2-tailed Student’s t test with Bonferroni’s correction. P values in C and D were calculated by Pearson’s correlation.
Figure 6
Figure 6. Increased expression of FGFBP2 in allograft rejection and graft failure.
Microarray gene expression of FGFBP2 was extracted from GEO GSE36059, GSE50058, and GSE21374. (A) Kaplan-Meier plot shows time to graft failure in subset of non-rejecting recipients from GSE21374 with either high (n = 30) or low (n = 176) expression of FGFBP2. High and low expression of FGFBP2 was determined by StepMiner, as previously reported (43). (B) FGFBP2 expression in GSE21374 was higher in histologically defined rejection (n = 76) than non-rejection (n = 206). (C) FGFBP2 expression in GSE36059 was higher in histologically defined TCMR (n = 35), ABMR (n = 65), and mixed rejection (n = 22) than non-rejection (n = 289). (D) FGFBP2 expression in GSE50058 was higher in histologically defined acute rejection (n = 43) than non-rejection (n = 58). P value in A was calculated by log-rank test; P values in BD reflect Wilcoxon’s test with Bonferroni’s correction.

References

    1. Yokoyama WM, Plougastel BF. Immune functions encoded by the natural killer gene complex. Nat Rev Immunol. 2003;3(4):304–316. doi: 10.1038/nri1055. - DOI - PubMed
    1. Trowsdale J, Knight JC. Major histocompatibility complex genomics and human disease. Annu Rev Genomics Hum Genet. 2013;14:301–323. doi: 10.1146/annurev-genom-091212-153455. - DOI - PMC - PubMed
    1. Parham P, Guethlein LA. Genetics of natural killer cells in human health, disease, and survival. Annu Rev Immunol. 2018;36:519–548. doi: 10.1146/annurev-immunol-042617-053149. - DOI - PubMed
    1. Anfossi N, et al. Human NK cell education by inhibitory receptors for MHC class I. Immunity. 2006;25(2):331–342. doi: 10.1016/j.immuni.2006.06.013. - DOI - PubMed
    1. Braud VM, et al. HLA-E binds to natural killer cell receptors CD94/NKG2A, B and C. Nature. 1998;391(6669):795–799. doi: 10.1038/35869. - DOI - PubMed

Substances