. 2024 Nov 22;9(22):e175098.
doi: 10.1172/jci.insight.175098.

TET2 promotes tumor antigen presentation and T cell IFN-γ, which is enhanced by vitamin C

Affiliations

TET2 promotes tumor antigen presentation and T cell IFN-γ, which is enhanced by vitamin C

Meng Cheng et al. JCI Insight. .

Abstract

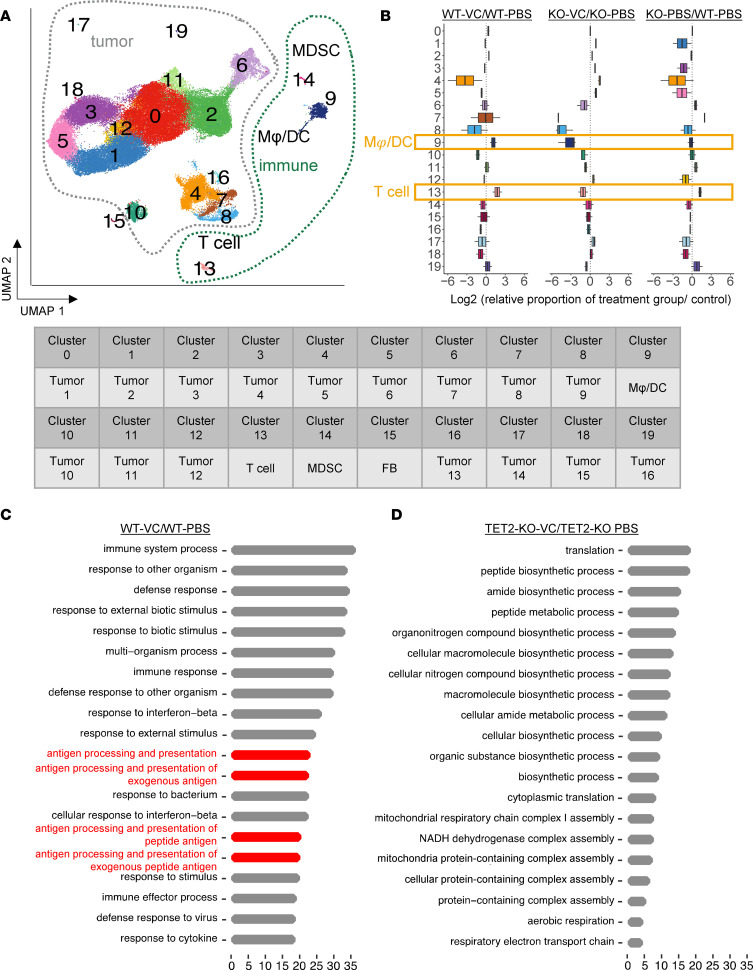
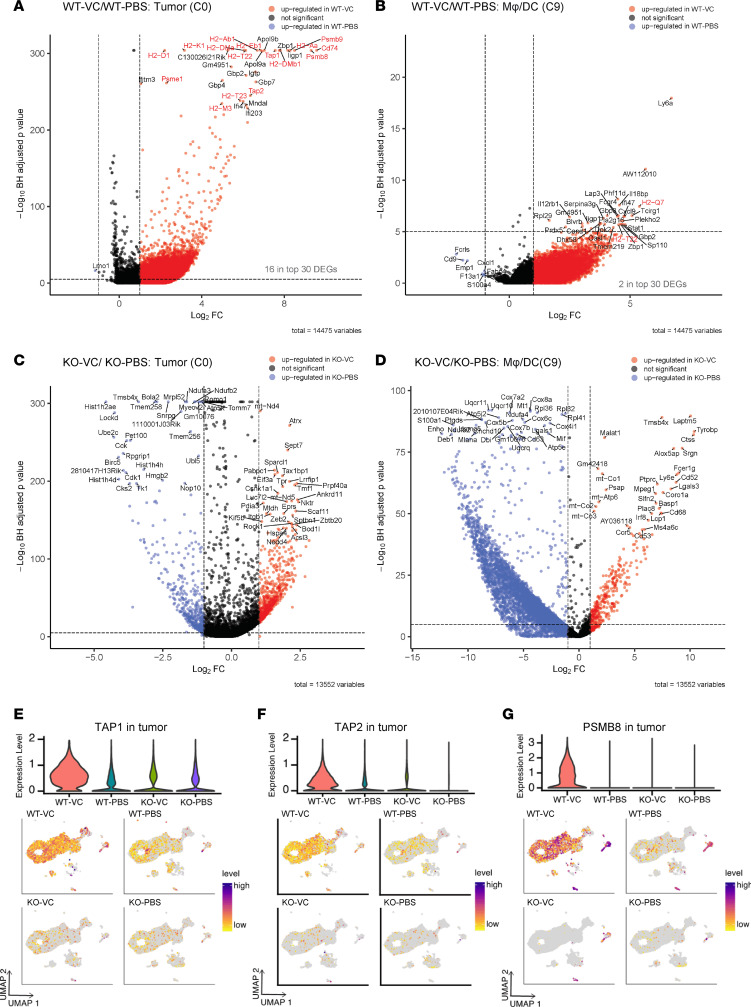
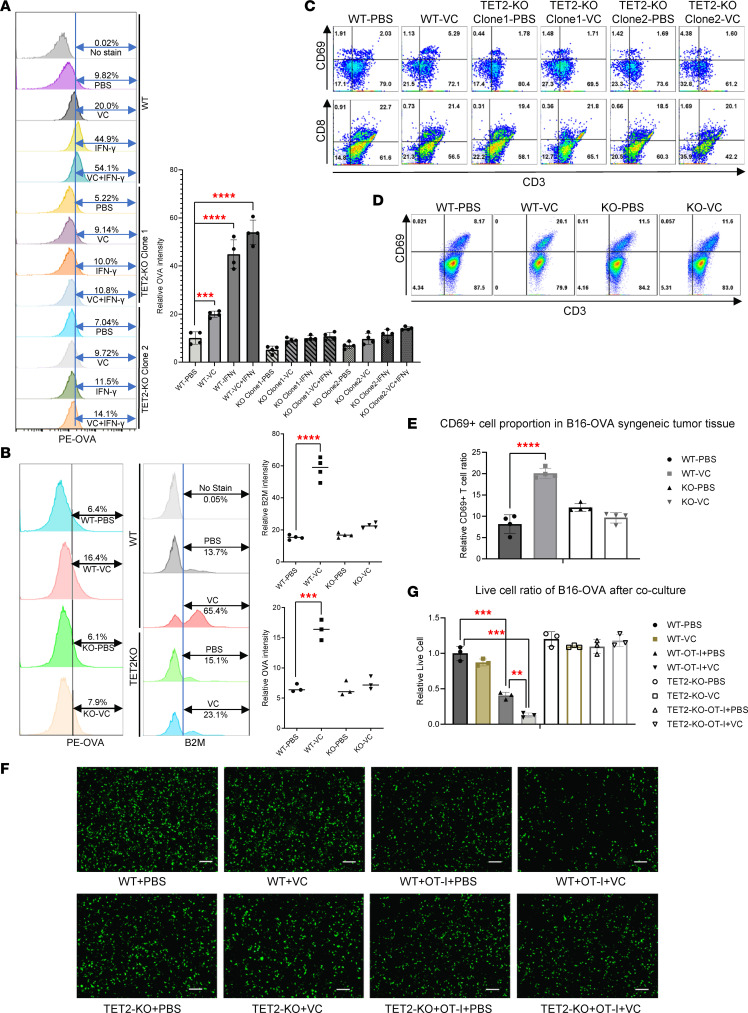
Immune evasion by tumors is promoted by low T cell infiltration, ineffective T cell activity directed against the tumor, and reduced tumor antigen presentation. The TET2 DNA dioxygenase gene is frequently mutated in hematopoietic malignancies and loss of TET enzymatic activity is found in a variety of solid tumors. We showed previously that vitamin C (VC), a cofactor of TET2, enhances tumor-associated T cell recruitment and checkpoint inhibitor therapy responses in a TET2-dependent manner. Using single-cell RNA sequencing (scRNA-seq) analysis performed on B16-OVA melanoma tumors, we have shown here that an additional function for TET2 in tumors is to promote expression of certain antigen presentation machinery genes, which is potently enhanced by VC. Consistently, VC promoted antigen presentation in cell-based and tumor assays in a TET2-dependent manner. Quantifying intercellular signaling from the scRNA-seq dataset showed that T cell-derived IFN-γ-induced signaling within the tumor and tumor microenvironment requires tumor-associated TET2 expression, which is enhanced by VC treatment. Analysis of patient tumor samples indicated that TET activity directly correlates with antigen presentation gene expression and with patient outcomes. Our results demonstrate the importance of tumor-associated TET2 activity as a critical mediator of tumor immunity, which is augmented by high-dose VC therapy.

Keywords: Adaptive immunity; Antigen presentation; Cancer; Immunology; Oncology.


Conflict of interest statement

Conflict of interest: The authors have declared that no conflict of interest exists.

Figures

Figure 1
Figure 1. Injection of VC i.v. provides optimal, TET2-dependent anti–PD-L1 immunotherapy efficacy.
WT B16-OVA (2 × 10⁵) cells were transplanted into 6-week-old C57BL/6J syngeneic mice followed by indicated doses of VC treatment daily or 200 μg anti–PD-L1 3 times per week. Tumor volume (A) was measured (width2 × length/2) with a caliper and mouse survival (B) was monitored and data recorded every day. Error bars represent ± SEM, n = 10. (C) TET2-KO clones of CT-26 cells were made using the CRISPR/Cas9 system and were confirmed by Western blotting as well as DNA sequencing; TET2 expression in CT-26 cells did not affect its proliferation in culture medium, n = 5. CT-26 (2 × 10⁵) cells were transplanted into 6-week-old BALB/c syngeneic mice followed by 1 g/kg i.v. VC treatment every day or 200 μg anti–PD-L1 3 times per week as indicated. Tumor volume (D) was measured with a caliper and mouse survival (E) was monitored and data recorded each day. The P values shown in the tables for survival data were determined by log-rank (Mantel-Cox) test comparing each 2 groups or unpaired, 2-tailed Student’s t test, and multiple comparisons were corrected using Bonferroni’s method. Error bars represent ± SEM, n = 10. Statistical significance was defined as an adjusted P value (Bonferroni’s correction) of less than 0.05. *P < 0.05, **P < 0.01, ***P < 0.001, ****P < 0.0001. NS, no significance.
Figure 2
Figure 2. scRNA-seq reveals enhanced antigen presentation processes after VC treatment in WT, but not TET2-KO, B16-OVA syngeneic tumor tissue.
(A) UMAP clustering from the total population of WT or TET2-KO B16-OVA treated with PBS or i.v. 1 g/kg VC groups (3 replicates per group with approximately 10,000 single cells per sample were sequenced for all 4 groups) was summarized and a total of 20 different clusters were identified, including myeloid-derived suppressor cell (MDSC), dendritic cell (DC), macrophage (Mφ), T cell, and fibroblast (FB) cell defined by their marker gene expression. (B) Population changes after VC treatment for each cluster were summarized in the bar plot. The relative abundance of each cluster was calculated by their ratio in that sample divided by the corresponding PBS control group. The top 20 most significantly enriched cellular processes based on GO analysis of the top 100 DEGs after VC treatment in the WT group (C) or TET2-KO groups (D) in the whole tumor tissue were summarized and antigen presentation processes are marked in red. Horizontal axes in C and D show the qscore.
Figure 3
Figure 3. VC-induced antigen presentation processes are largely from tumor cells and rely on the expression of TET2.
The top 20 most significantly enriched cellular processes based on GO analysis of the top 100 DEGs after VC treatment in the WT tumor cluster C2 (A) or WT group macrophage/dendritic cell cluster C9 (B) and in the TET2-KO tumor cluster C2 (C) or TET2-KO group macrophage/dendritic cell cluster C9 (D) were summarized, and antigen presentation processes are marked in red. Horizontal axes show the qscore.
Figure 4
Figure 4. VC induces MHC class I–related antigen presentation gene expression in WT, but not TET2-KO, tumor cells.
The top 30 DEGs after VC treatment in WT tumor cluster C0 (A) or WT group macrophage/dendritic cell cluster C9 (B) and TET2-KO tumor cluster C0 (C) or TET2-KO group macrophage/dendritic cell cluster C9 (D) were annotated in the volcano plots according to their adjusted P values and genes involved in the MHC I antigen presentation are marked in red. The single-cell expression profile of MHC class I genes TAP1 (E), TAP2 (F), and immunoproteasome gene PSMB8 (G) in the WT or TET2-KO B16-OVA tumor tissue treated with PBS control or VC are displayed on the UMAP projection from the whole tumor tissue. The relative expression of genes was calculated by log2-normalized gene count data where purple indicates high expression and yellow indicates low expression, with detailed quantification in the violin plots shown above.
Figure 5
Figure 5. VC increases tumor cell antigen presentation and T cell activation as well as T cell–induced tumor cell killing.
(A) WT or 2 TET2-KO clones were cultured in 6-well plates in DMEM. Then, 500 μM VC or 100 ng/mL IFN-γ or PBS control were added as indicated for 24 hours before running flow cytometry experiments to determine OVA antigen levels on the tumor cell surface. Data are quantified on the right, with mean ± SD (n = 4). P values were calculated by unpaired, 2-tailed Student’s t test, with multiple comparisons corrected using Bonferroni’s method. (B) WT or TET2-KO B16-OVA tumor cells (2 × 10⁵ each) were transplanted into 6-week-old C57BL/6J syngeneic mice and i.v. 1 g/kg VC or PBS treatment was given daily from day 7 to the date of harvesting tumor tissue. Then, single cells were isolated from tumor tissue for flow cytometry experiments to detect OVA antigen presentation or the B2M component of the MHC I complex on the tumor cell surface. Data are quantified on the right, with mean ± SD (n = 4). P values were calculated by unpaired, 2-tailed Student’s t test, with multiple comparisons corrected using Bonferroni’s method. (C) WT or TET2-KO B16-OVA cells were cultured in 6-well plates with RPMI medium. Then, 1 × 10⁶ isolated OT-I T cells were cocultured with B16-OVA cells and 500 μM VC or PBS was added as indicated above for the coculture experiments in the presence of 1 × 10⁵ isolated dendritic cells as the antigen-presenting cell. After 16 hours, OT-I T cells were collected for flow cytometry experiments to determine T cell activation using the CD69 marker. (D) T cells isolated from WT or TET2-KO B16-OVA syngeneic mice treated with PBS or VC as described in B were collected for flow cytometry assays to determine CD69+ activated T cell ratio and the results were calculated and summarized (E). The error bars indicate 5 replicates in each group and data are represented as mean ± SD. P values were calculated by unpaired, 2-tailed Student’s t test. (F) WT or TET2-KO B16-OVA cells were transfected with EGFP plasmid and then cocultured with isolated OT-I T cells as described in C. After 16-hour treatment with PBS or 500 μM VC, cells were washed 3 times with PBS before acquiring images. Scale bars: 100 μm. (G) The quantification of live cells from F was summarized and data are represented as mean ± SD (n = 4). P values were calculated by unpaired, 2-tailed Student’s t test, with multiple comparisons corrected using Bonferroni’s method. **P < 0.01; ***P < 0.001; ****P < 0.0001.
Figure 6
Figure 6. TET2 coordinates IFN-γ expression and its intercellular signaling, which is augmented by VC treatment.
(A) Single-cell expression of IFN-γ and its receptor IFNGR1 was summarized in the UMAP plot and quantified in the violin plot above. (B) Intercellular communication of the IFN-γ signal between the T cell population and tumor clusters in the WT or TET2-KO tumor microenvironment treated with PBS control or VC are presented in the network plot; each line indicates an IFN-γ signal communication between 2 populations and the strength of communication was quantified in the bar plot. (C) The expression of key MHC I antigen-presenting genes TAP1, TAPBP, and B2M in the WT B16-OVA cells treated with IFN-γ and VC was determined by qPCR. Data represented as mean ± SD, with 3 replicates. (D) Coimmunoprecipitation of TET2 with STAT1 following treatment of B16-OVA cells with IFN-γ and/or VC. (E) The promoter region binding of TET2 and STAT1 on the TAP1 and TAPBP genes was analyzed through a ChIP assay. (F) Effects on TAP1 and TAPBP expression in B16-Ova (WT and KO) cells following STAT1 knockdown with siRNA, or with control (CTRL) siRNA. Data represented as mean ± SD, with 3 replicates. P values were calculated by unpaired, 2-tailed Student’s t test, with multiple comparisons corrected using Bonferroni’s method. ***P < 0.001, ****P < 0.0001.
Figure 7
Figure 7. The expression of antigen presentation genes correlates with better prognosis and higher TET activity in human patients.
The expression level of key MHC I antigen presentation genes TAP1 (A), TAPBP (B), B2M (C), and HLA-A (D) and their correlation with patient survival predictions were summarized in different human cancer types. Data collected from the Kaplan-Meier Plotter database, with HR indicating hazard ratio and logrank P indicating P value. Human cancer tissue was purchased from Biomax (Methods) and stained for 5hmC, TAP1, TAPBP, B2M, and with DAPI for immunofluorescence imaging in malignant melanoma (E) and colon adenocarcinoma (F). Scale bars: 100 μm. White boxes show ×20 magnification. The relative density of 5hmC, TAP1, TAPBP, and B2M relative to DAPI was calculated from at least 6 replicates under enlarged fields. Unpaired, 2-tailed Student’s t test with multiple comparisons corrected using Bonferroni’s method was used to determine the P value of positive cells between 5hmC-high samples and 5hmC-low samples. ****P < 0.0001. (G) Schematic model of the role of TET2 downstream of IFN-γ signaling and VC in regulating tumor antigen presentation and T cell activity directed to the tumor cell.

References

    1. Waldman AD, et al. A guide to cancer immunotherapy: from T cell basic science to clinical practice. Nat Rev Immunol. 2020;20(11):651–668. doi: 10.1038/s41577-020-0306-5. - DOI - PMC - PubMed
    1. Ferrington DA, Gregerson DS. Immunoproteasomes: structure, function, and antigen presentation. Prog Mol Biol Transl Sci. 2012;109:75–112. doi: 10.1016/B978-0-12-397863-9.00003-1. - DOI - PMC - PubMed
    1. Jhunjhunwala S, et al. Antigen presentation in cancer: insights into tumour immunogenicity and immune evasion. Nat Rev Cancer. 2021;21(5):298–312. doi: 10.1038/s41568-021-00339-z. - DOI - PubMed
    1. Anandappa AJ, et al. Directing traffic: how to effectively drive T cells into tumors. Cancer Discov. 2020;10(2):185–197. doi: 10.1158/2159-8290.CD-19-0790. - DOI - PMC - PubMed
    1. Dhatchinamoorthy K, et al. Cancer immune evasion through loss of MHC class I antigen presentation. Front Immunol. 2021;12:636568. doi: 10.3389/fimmu.2021.636568. - DOI - PMC - PubMed

MeSH terms