. 2024 Oct 22;43(10):114841.
doi: 10.1016/j.celrep.2024.114841. Epub 2024 Oct 10.

WWC2 modulates GABAA-receptor-mediated synaptic transmission, revealing class-specific mechanisms of synapse regulation by WWC family proteins

Affiliations

WWC2 modulates GABAA-receptor-mediated synaptic transmission, revealing class-specific mechanisms of synapse regulation by WWC family proteins

Thomas L Dunham et al. Cell Rep. .

Abstract

The WW and C2 domain-containing protein (WWC2) is implicated in several neurological disorders. Here, we demonstrate that WWC2 interacts with inhibitory, but not excitatory, postsynaptic scaffolds, consistent with prior proteomic identification of WWC2 as a putative component of the inhibitory postsynaptic density. Using mice lacking WWC2 expression in excitatory forebrain neurons, we show that WWC2 suppresses γ-aminobutyric acid type-A receptor (GABAAR) incorporation into the plasma membrane and regulates HAP1 and GRIP1, which form a complex promoting GABAAR recycling to the membrane. Inhibitory synaptic transmission is increased in CA1 pyramidal cells lacking WWC2. Furthermore, unlike the WWC2 homolog KIBRA (kidney/brain protein; WWC1), a key regulator of α-amino-3-hydroxy-5-methyl-4-isoxazolepropionic acid receptor (AMPAR) trafficking at excitatory synapses, the deletion of WWC2 does not affect synaptic AMPAR expression. In contrast, loss of KIBRA does not affect GABAAR membrane expression. These data reveal synapse class-selective functions for WWC proteins as regulators of ionotropic neurotransmitter receptors and provide insight into mechanisms regulating GABAAR membrane expression.

Keywords: AMPA receptor; CP: Neuroscience; GABAA receptor; GRIP1; HAP1; KIBRA; WWC1; WWC2; dendritic arborization; inhibitory synapse; synaptic transmission.


Conflict of interest statement

Declaration of interests The authors declare no competing interests.

Figures

Figure 1.
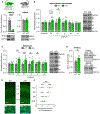
Figure 1.. Distribution of WWC2 expression in the brain
A) Diagram of KIBRA and WWC2 interaction domains and phosphorylation sites. B,C) Analysis of WWC2 gene expression from Allen Institute for Brain Science cell types database: RNA-Seq Data, Mouse whole Cortex and Hippocampus-10x Genomics with 10X-Smart-Seq Taxonomy,. (B) Percent of identified excitatory (232) and inhibitory (121) neuron cell types from mouse hippocampus and cortex that express WWC2. (C) Number of each hippocampal excitatory, cortical excitatory, cortical + hippocampal inhibitory, and non-neuronal cell class that shows Wwc2 expression. Dark blue portion of the bar represents the number of cell types in the indicated class that do not express Wwc2. Colored portion of the bar shows the number of cell types in the indicated class that express Wwc2, where the color represents the relative expression level (trimmed means). Numbers indicate the number of cell types in each bar. For example, of the 45 somatostatin+ cell types, 35 express Wwc2, with relative expression of 1.17, averaged across all of the 35 Sst+ cell types that showed detectible Wwc2 expression. D) Spearman correlation of WWC2 and WWC1 expression for each excitatory hippocampal cell type (15 CA1, 2 CA2, 8 CA3, 2 Mossy and 4 DG cell types). E) WWC2 is enriched in the hippocampus and cortex of WT animals. HC=hippocampus, CTX=cortex, MB=midbrain, CB=cerebellum. (***p=0.0006, repeated measures ANOVA, F (1.783, 5.384) = 77.45). Multiple comparisons to average whole brain expression (Šidák): HC and MB *p < 0.05, CB **p < 0.01, CTX p = 0.0595.)N=4 animals. Data presented as mean ± SEM. See Methods for sexes represented in each experimental group. F) WWC2 is enriched in the cytosol (S2), present in the membrane-associated fraction (P2), and is depleted from the excitatory postsynaptic density (PSD). G-H) WWC2 interacts with gephyrin, but not PSD-95. An extra lane containing an unrelated KIBRA IP was removed between the WWC2 IP and input.
Figure 2.
Figure 2.. Increased surface GABAAR expression in WWC2 cKO hippocampus.
A) Quantification of WWC proteins in ex vivo hippocampal homogenate from WT mice and WWC2 cKO littermates. (WWC2, WT = 1.0 ± 0.07, cKO = 0.12 ± 0.02; KIBRA, WT = 1.0 ± 0.03, cKO = 1.05 ± 0.05.Welch’s t-test p < 0.0001). See Fig. S2 for WWC2 KO mouse generation. B,C) Western blot analysis of gephyrin and GABAAR receptor subunits in ex vivo hippocampal homogenate (B) and membrane (C) fractions. (B, gephyrin, WT = 1.0 ± 0.02, cKO = 1.04 ± 0.05; β2, WT = 1.0 ± 0.05, cKO = 1.29 ± 0.13; β3, WT = 1.0 ± 0.07, cKO = 1.49 ± 0.16; γ2, WT = 1.0 ± 0.08, cKO = 1.20 ± 0.1; α2, WT = 1.0 ± 0.08, cKO = 0.90 ± 0.09; α5, WT = 1.0 ± 0.07, cKO = 0.96 ± 0.03. t-test with Welch’s correction *p=0.0163) (C, gephyrin, WT = 1.0 ± 0.03, cKO = 1.04 ± 0.06; β2, WT = 1.0 ± 0.13, cKO = 1.59 ± 0.18; β3, WT = 1.0 ± 0.09, cKO = 1.49 ± 0.11; γ2, WT = 1.0 ± 0.11, cKO = 1.33 ± 0.10; α2, WT = 1.0 ± 0.04, cKO = 1.2 ± 0.06; α5, WT = 1.0 ± 0.05, cKO = 1.1 ± 0.04. Welch’s t-test *p<0.05 [β2 p=0.0166, γ2 p=0.0373, α2 p=0.0156], **p=0.0032). See also, Fig. S3. D) Quantification of surface biotinylated proteins from acute hippocampal slices prepared from WWC2 cKO mice or WT littermates. Data presented as ratio of surface GABAR to total GABAR normalized to gephyrin signal. (WT = 1.0 ± 0.08, cKO = 1.34 ± 0.11. Welch’s t-test *p=0.0247) N, indicated in each bar, represents number of animals. E) Representative images of WT and cKO hippocampal slices stained for γ2 under nonpermeablizing conditions. Scale bars = 100 μm. F) Quantification of slice-average fluorescence intensity of indicated CA1 layers normalized to littermate WT SP values. SO: WT = 0.99 ± 0.05, cKO = 1.13 ± 0.04. SP: WT = 1.00 ± 0.03, cKO = 1.10 ± 0.04. SR: WT = 0.99 ± 0.03, cKO = 1.08 ± 0.04. SLM: WT = 1.19 ± 0.05, cKO = 1.26 ± 0.05. N = 3 animals/16 slices per group. 2-way ANOVA, main effects, all normalized to WT SP: Layer p<0.0001 (F (3,120) = 8.392), genotype p = 0.0026 (F (1, 120) = 9.499), layer x genotype p = 0.9314 (F (3,120). Multiple comparisons (Šídák's, WT vs cKO): SO *p = 0.044, SP p = 0.104, SR p = 0.1933, SLM p = 0.240. Data presented as mean ± SEM. Graphical representation shows cKO normalized to corresponding WT of the same layer. See Methods for sexes represented in each experimental group.
Figure 3.
Figure 3.. KIBRA loss does not affect GABAAR protein expression or membrane localization, and WWC2 does not affect AMPAR protein expression or membrane localization.
A,B) Western blot analysis of gephyrin and GABAAR subunits γ2 and β2/3 protein expression in hippocampal homogenate (A) or membrane fraction (B) from WT mice and constitutive KIBRA KO littermates. (A, gephyrin, WT = 1.0 ± 0.03, KO = 0.99 ± 0.03; γ2, WT = 1.0 ± 0.11, KO = 1.07 ± 0.12; β2/3, WT = 1.0 ± 0.09, KO = 1.02 ± 0.11. B, gephyrin, WT = 1.0 ± 0.06, KO = 0.88 ± 0.07; γ2, WT = 1.0 ± 0.15, KO = 1.02 ± 0.11; β2/3, WT = 1.0 ± 0.11, KO = 1.0 ± 0.09.) C-E) Western blot analysis of PSD-95 and AMPAR subunits GluA1 and GluA2 in ex vivo hippocampal homogenate (C), membrane (D), and purified postsynaptic density (E) fractions of WT and WWC2 cKO littermates. (C, PSD-95, WT = 1.0 ± 0.03, cKO = 0.95 ± 0.27; GluA1, WT = 1.0 ± 0.03, cKO = 1.03 ± 0.04; GluA2, WT = 1.0 ± 0.05, cKO = 1.06 ± 0.09. D, PSD-95, WT = 1.0 ± 0.04, cKO = 0.98 ± 0.04; GluA1, WT = 1.0 ± 0.06, cKO = 1.11 ± 0.06; GluA2, WT = 1.0 ± 0.06, cKO = 1.15 ± 0.07. E, PSD-95, WT = 1.0 ± 0.05, cKO = 0.92 ± 0.04; GluA1, WT = 1.0 ± 0.04, cKO = 0.97 ± 0.03; GluA2, WT = 1.0 ± 0.06, cKO = 0.94 ± 0.05. No significant differences, Welch’s t-test). See also, Fig. S3. N, indicated in each bar, represents number of animals. Data presented as mean ± SEM. See Methods for sexes represented in each experimental group.
Figure 4.
Figure 4.. WWC2 binds GABAARs and the GABAAR recycling complex proteins HAP1 and GRIP1
A) WWC2 co-immunoprecipitates with GABAAR subunits β2/3 and γ2 in forebrain homogenate from WT mice B) Quantification of HAP1 and GRIP1 protein expression in the membrane associated (left) and cytosolic (right) fractions from WWC2 cKO and WT hippocampal tissue. (Membrane: HAP1, WT = 1.0 ± 0.11, cKO = 1.60 ± 0.20, *p = 0.0219; GRIP1, WT = 1.0 ± 0.07, cKO = 1.26 ± 0.10, *p = 0.0483. Cytosol: HAP1, WT = 1.0 ± 0.06, cKO = 0.94 ± 0.10; GRIP1, WT = 1.0 ± 0.08, cKO = 0.73 ± 0.06, *p = 0.0150, Welch’s t-test.). See also, Fig. S4. N, indicated in each bar, represents number of animals. Data presented as mean ± SEM. See Methods for sexes represented in each experimental group. B,C) GRIP1 and HAP1 co-immunoprecipitate with WWC2 (B) and WWC2 co-immunoprecipitates with GRIP1 and HAP1 (C) in forebrain homogenate from WT mice. Extraneous HAP1 and GRIP1 lanes were removed for clarity.
Figure 5.
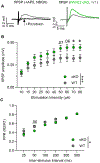
Figure 5.. Loss of WWC2 increases hippocampal inhibitory synaptic transmission.
A) Left: Representative traces of pharmacologically-isolated field Inhibitory Postsynaptic Potentials evoked and recorded in the pyramidal layer of hippocampal area CA1(fIPSP;AP5+NBQX, gray trace) and blockade of fIPSPs by the GABAAR antagonist picrotoxin (black trace). Right: Representative fIPSP responses in WT (gray) and WWC2 cKO (green) hippocampal slices. B) fIPSP input-output curve shows increased inhibitory synaptic transmission in WWC2 cKO hippocampus. 2-way repeated measures ANOVA, main effects: stimulation intensity p < 0.0001 (F (1.122, 22.44) = 81.89), genotype p = 0.0850 (F (1, 20) = 3.284), stimulation intensity x genotype p = 0.0004 (F (9, 180) = 3.595 ). Multiple comparisons (Šídák's: 0.5399, 0.2377, 0.0974, 0.1573, 0.0959, 0.1471, 0.0661, 0.0595, 0.0227, 0.0371). WWC2 cKO, n = 11 slices from 4 mice, WT n = 11 slices from 3 mice. C) Paired pulse ratios of fIPSPs. 2-way repeated measures ANOVA, main effects: ISI p < 0.0001 (F (1.995, 37.90) = 82.64), genotype p = 0.0161 (F (1, 19) = 6.972), ISI x genotype p = 0.1337 (F (5, 95) = 1.719 ). Multiple comparisons (Šídák's, 25, 50, 100, 200, 300, 500ms ISI): 0.7951, 0.0599, 0.1500, 0.2764, >0.9999, >0.9999. WWC2 cKO, n = 11 slices from 4 mice, WT n = 10 slices from 3 mice. Data presented as mean ± SEM. See Methods for sexes represented in each experimental group.
Figure 6.
Figure 6.. WWC2 loss results in decreased dendritic arborization
A) Representative images of WT (cre-negative, top) and WWC2 cKO (cre-positive, bottom) cultured hippocampal neurons. Scale bars 50 μm. B) Western blot of WWC2 expression in cultured Wwc2 f/f hippocampal neurons receiving AAV-GFP (WT) or AAV-Cre (cKO). C,D) WWC2 cKO neurons have decreased total dendritic length (F) and number of branches (G) compared to WT controls. (F, WT = 3111 ± 181, cKO = 2179 ± 127, **p=0.0001 Welch’s t-test. G, WT = 25.4 ± 1.20, cKO = 21.10 ± 1.24, *p=0.0174 Welch’s t-test.) E) WWC2 cKO neurons do not have significantly altered soma size. WT (GFP-infected) 500 ± 42.4, cKO (GFP-Cre-infected) 409 ± 29.4, Mann Whitney test p = 0.0858. F) Sholl analysis of dendrites in cultured Wwc2 f/f neurons receiving AAV-GFP (WT) or AAV-GFP-cre (cKO). (2-way ANOVA, main effects: genotype p<0.0001; Multiple comparisons (Šídák’s), *p<0.05, **p<0.01, ***p<0.001, ****p<0.0001.) For C-F, WT N=23, cKO N = 30 cells analyzed from 2 independent cultures. G) Experimental design of P0 intracerebroventricular injections of AAV-EGFP or AAV-dTomato-Cre into Wwc2 f/f animals. H) Representative image of p18-21 CA1 pyramidal cells marked with GFP (WT) or dTomato (cre+, cKO). Scale bar 100 μm I) Primary dendrite length in the stratum oriens (SO) and stratum radiatum/lacinosum moleculare (SR/SLM). (SO: WT = 108.9 ± 5.660, cKO = 110.4 ± 3.879, SR/SLM: WT = 313.5 ± 15.88, cKO = 269.1 ± 10.84 *p=.03, Welch’s t-test) WT n=6 animals, 14 cells, cKO n=6 animals, 18 cells J) Number of branch points off primary dendrites in the SO and SR. (SO: WT = 7.29 ± 0.46, cKO = 5.72 ± 0.31 **p=0.0098 Welch’s t-test. SR: WT = 10.5 ± 0.78, cKO = 9.17 ± 0.51) WT n=6 animals, 14 cells, cKO n=6 animals,18 cells. Data presented as mean ± SEM. See Methods for sexes represented in each experimental group.
Figure 7.
Figure 7.. Model summarizing proposed synaptic and cellular functions of WWC proteins in neurons.
Based on data from this and other, studies, we hypothesize that KIBRA (WWC1) and WWC2 play distinct roles in regulating excitatory and inhibitory synapses, respectively, whereas they share convergent roles in promoting dendritic arborization. Created with BioRender.com

Update of

References

    1. Milnik A, Heck A, Vogler C, Heinze HJ, de Quervain DJ, and Papassotiropoulos A (2012). Association of KIBRA with episodic and working memory: a meta-analysis. Am J Med Genet B Neuropsychiatr Genet 159B, 958–969. 10.1002/ajmg.b.32101. - DOI - PubMed
    1. Kauppi K, Nilsson LG, Adolfsson R, Eriksson E, and Nyberg L (2011). KIBRA polymorphism is related to enhanced memory and elevated hippocampal processing. J Neurosci 31, 14218–14222. 10.1523/JNEUROSCI.3292-11.2011. - DOI - PMC - PubMed
    1. Vassos E, Bramon E, Picchioni M, Walshe M, Filbey FM, Kravariti E, McDonald C, Murray RM, Collier DA, and Toulopoulou T (2010). Evidence of association of KIBRA genotype with episodic memory in families of psychotic patients and controls. J Psychiatr Res 44, 795–798. 10.1016/j.jpsychires.2010.01.012. - DOI - PubMed
    1. Yasuda Y, Hashimoto R, Ohi K, Fukumoto M, Takamura H, Iike N, Yoshida T, Hayashi N, Takahashi H, Yamamori H, et al. (2010). Association study of KIBRA gene with memory performance in a Japanese population. World J Biol Psychiatry 11, 852–857. 10.3109/15622971003797258. - DOI - PubMed
    1. Bates TC, Price JF, Harris SE, Marioni RE, Fowkes FG, Stewart MC, Murray GD, Whalley LJ, Starr JM, and Deary IJ (2009). Association of KIBRA and memory. Neurosci Lett 458, 140–143. 10.1016/j.neulet.2009.04.050. - DOI - PubMed

MeSH terms

Substances

LinkOut - more resources