. 2024 Oct 10;19(10):e0311819.
doi: 10.1371/journal.pone.0311819. eCollection 2024.

The antioxidant betulinic acid enhances porcine oocyte maturation through Nrf2/Keap1 signaling pathway modulation

Affiliations

The antioxidant betulinic acid enhances porcine oocyte maturation through Nrf2/Keap1 signaling pathway modulation

Min Ju Kim et al. PLoS One. .

Abstract

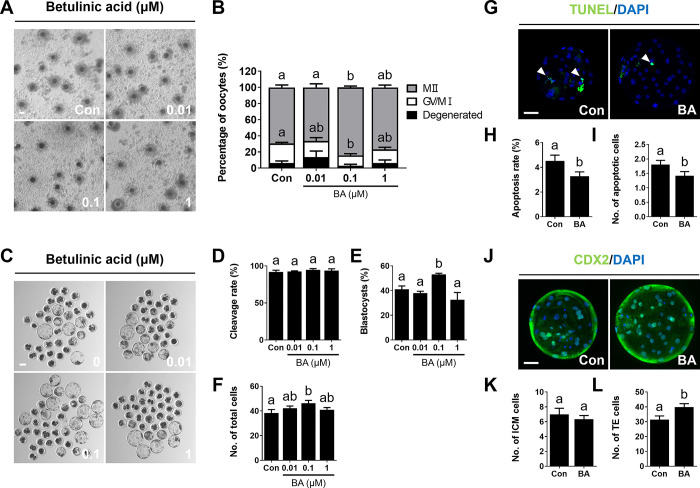
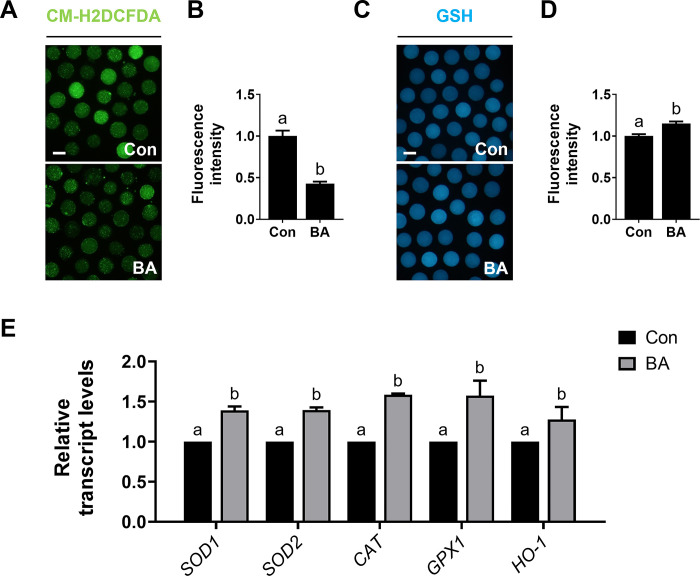
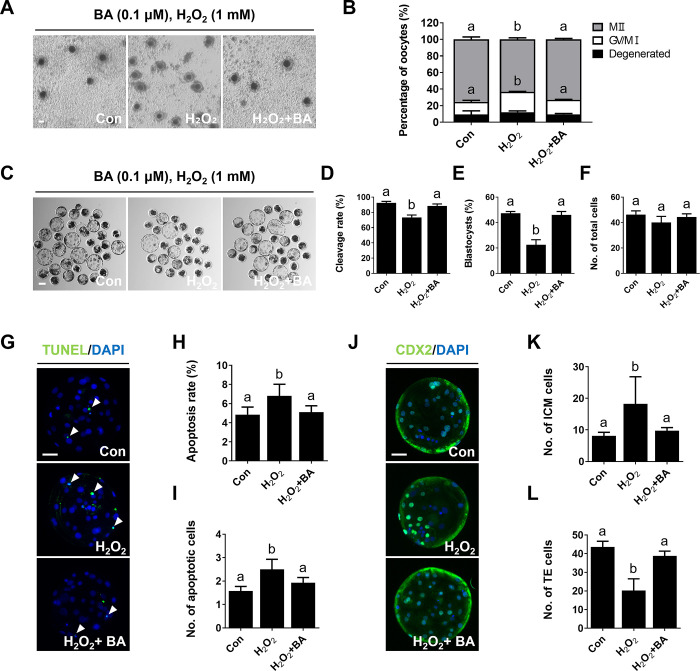
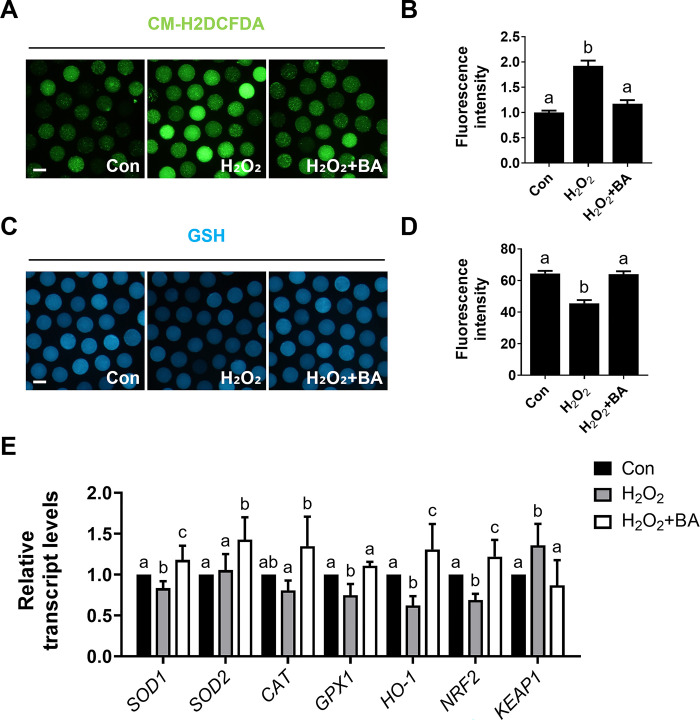
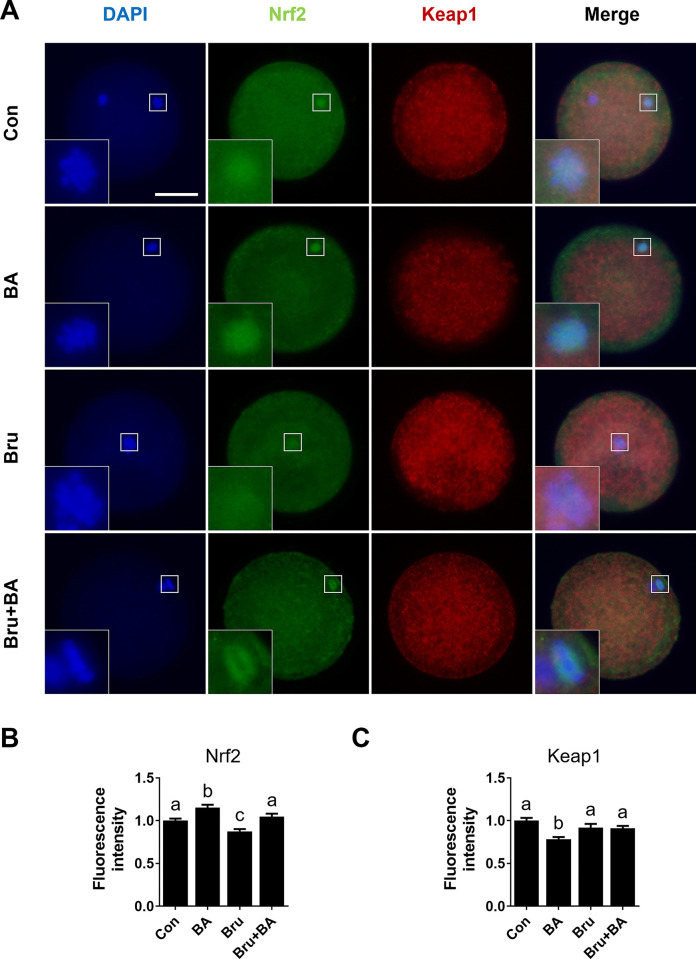
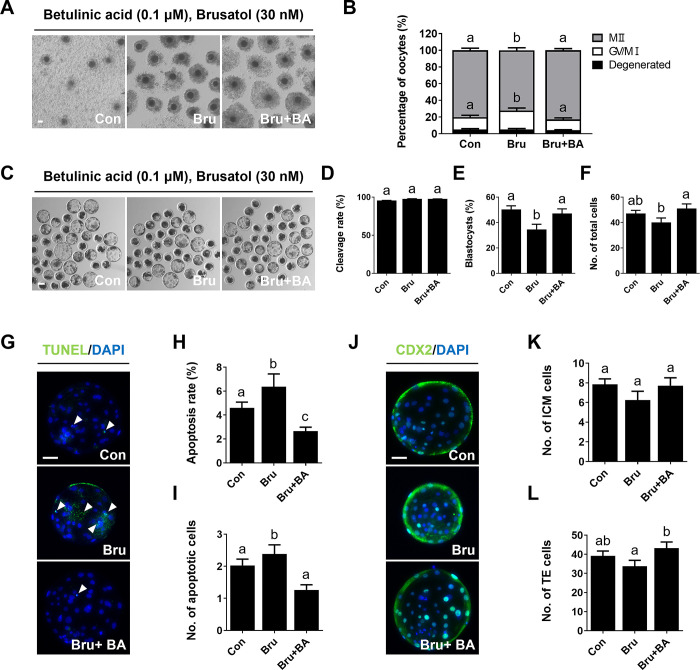
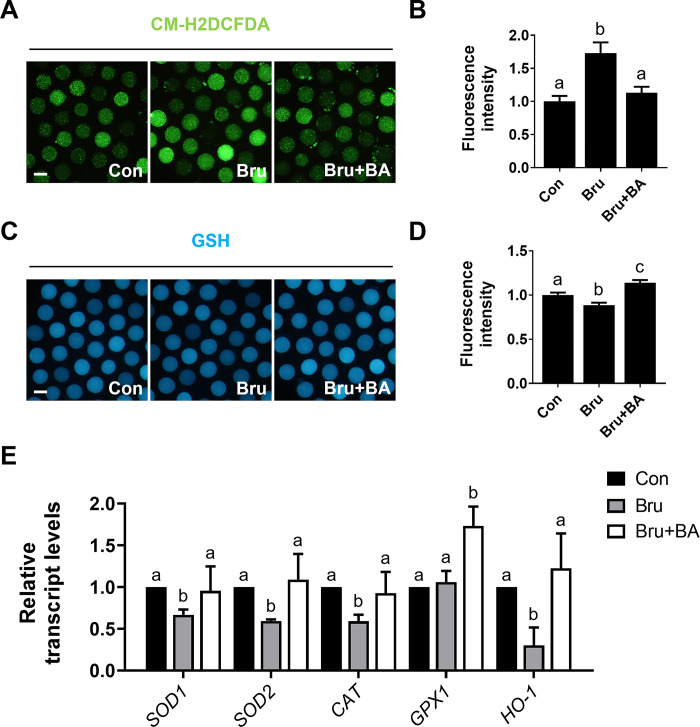
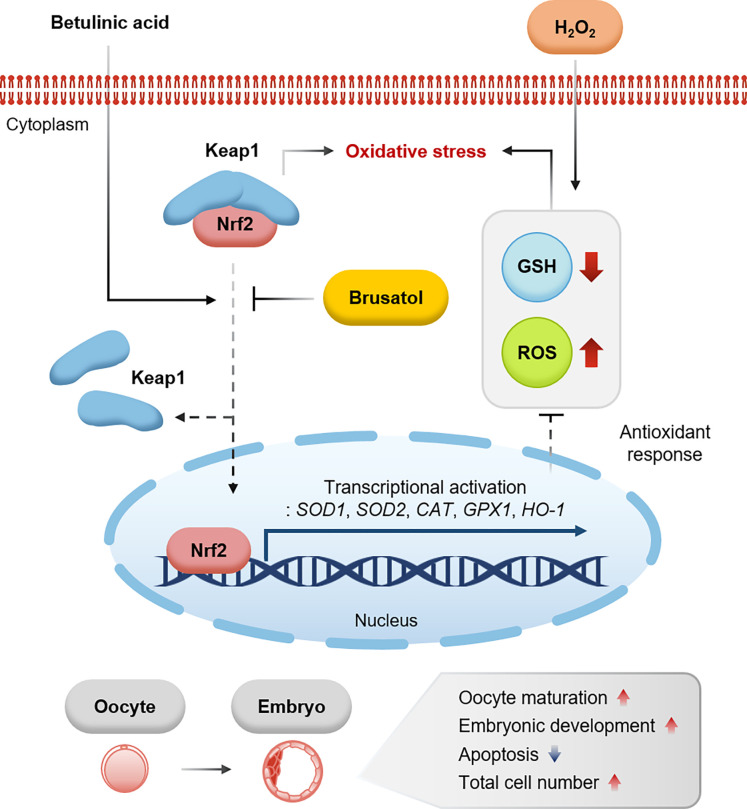
During in vitro maturation, excess levels of reactive oxygen species (ROS) are a major cause of developmental defects in embryos. Betulinic acid (BA) is a naturally produced antioxidant in white birch bark. Recent studies have shown that BA exhibits antioxidant properties in various cells through the activation of antioxidant genes. Therefore, we investigated the effect of BA treatment on porcine oocytes and its underlying mechanism during oocyte maturation. Treatment with 0.1 μM BA significantly increased the proportion of MII oocytes compared with controls, and BA-treated oocytes had significantly higher development rates, trophectoderm cell numbers, and cell survival rates than controls. These results demonstrate that BA treatment improved the developmental competence of oocytes. Following BA treatment, oocytes exhibited reduced ROS levels and elevated glutathione (GSH) levels, accompanied by the enhanced expression of antioxidant genes, compared with control oocytes. To evaluate the antioxidant effects of BA, oocytes were exposed to H2O2, a potent ROS activator. Impaired nuclear maturation, ROS levels, and GSH levels induced in oocytes by H2O2 exposure was restored by BA treatment. As these antioxidant genes are regulated by the Nrf2/Keap1 signaling pathway, which is involved in antioxidant responses, we applied the Nrf2 inhibitor brusatol to investigate the effects of BA on this pathway. The negative effects of brusatol on meiotic maturation and oocyte quality, including levels of ROS, GSH, and antioxidant-related gene expression, were mitigated by BA treatment. Our results suggested that BA plays an effective role as an antioxidant in porcine oocyte maturation through adjusting the Nrf2/Keap1 signaling pathway. This finding provides valuable insights into the mechanisms governing oocyte maturation and embryonic development.


Conflict of interest statement

The authors have declared that no competing interests exist.

Figures

Fig 1
Fig 1. Betulinic acid (BA) treatment enhances porcine oocytes maturation.
A Bright-field images of oocytes after 44 h of in vitro maturation (IVM) with various concentrations of BA. Bar = 100 μm. B Proportions of different stages of nuclear maturation (0.0 μM BA, n = 264; 0.01 μM BA, n = 243; 0.1 μM BA, n = 264; 1.0 μM BA, n = 274). C Bright-field images of BA-treated oocytes at 6 days of culture after parthenogenetic activation. Bar = 100 μm. D–F Cleavage rate, blastocyst formation rate, and total cell number measurements (0.0 μM BA, n = 192; 0.01 μM BA, n = 124; 0.1 μM BA, n = 210; 1 μM BA, n = 216). G Representative images of blastocysts from a terminal deoxynucleotidyl transferase dUTP nick-end labeling (TUNEL) assay. Merged images show cells positive for 4′,6-diamidino-2-phenylindole (DAPI; blue) and TUNEL (green; white arrows). Bar = 50 μm. H, I Apoptosis rates and cell numbers (n = 46 per group). J Representative images of CDX2 labeling in blastocysts. Merged images show cells positive for DAPI (blue) and CDX2 (green). Bar = 50 μm. K, L Numbers of trophectoderm (TE) and inner cell mass (ICM) cells (n = 33 per group). Data are means of three independent experiments; different letters indicate significant differences (P < 0.05).
Fig 2
Fig 2. BA treatment alleviates oxidative stress in porcine oocytes.
A Representative images of CM-H2DCFDA staining (green) in oocytes after 44 h of IVM. Bar = 100 μm. B Measurement of reactive oxygen species (ROS) fluorescence intensity (n = 40 per group). C Representative images of glutathione (GSH; blue) staining in oocytes after 44 h of IVM. Bar = 100 μm. D Measurement of GSH fluorescence intensity (n = 40 per group). E Transcription levels derived from quantitative reverse-transcription polymerase chain reaction (qRT-PCR) analysis of antioxidant genes in oocytes (n = 3 per group). Data are means of three independent experiments; different letters indicate significant differences (P < 0.05).
Fig 3
Fig 3. BA treatment restores impaired oocytes maturation caused by H2O2 exposure in porcine oocytes.
A Bright-field images of oocytes after IVM. Bar = 100 μm. B Proportions of different stages of nuclear maturation (0.0 μM BA, n = 151; H2O2, n = 151; H2O2+BA, n = 149). C Bright-field images of BA-treated oocytes at 6 days of culture after parthenogenetic activation. Bar = 100 μm. D–F Cleavage rate, blastocyst formation rate, and total cell number measurements (0.0 μM BA, n = 116; H2O2, n = 86; H2O2+BA, n = 105). G Representative images of TUNEL labeling in blastocysts. Merged images show cells positive for DAPI (blue) and TUNEL (green; white arrows). Bar = 50 μm. H, I Apoptosis rates and cell numbers (n = 23 per group). J Representative images of CDX2 labeling in blastocysts. Merged images show cells positive for DAPI (blue) and CDX2 (green). Bar = 50 μm. K, L Numbers of TE and ICM cells (n = 23 per group). Data are means of three independent experiments; different letters indicate significant differences (P < 0.05).
Fig 4
Fig 4. BA treatment restores impaired oxidative stress caused by H2O2 in porcine oocytes.
A Representative images of CM-H2DCFDA staining (green) in oocytes after 44 h of IVM. Bar = 100 μm. B Measurements of ROS fluorescence intensity (n = 40 per group). C Representative images of GSH staining (blue) in oocytes after 44 h of IVM. Bar = 100 μm. D Measurements of GSH fluorescence intensity (n = 40 per group). E Transcription levels derived from qRT-PCR analysis of antioxidant genes and Nrf2/Keap1 signaling pathway-related genes in oocytes (n = 3 per group). Data are means of three independent experiments; different letters indicate significant differences (P < 0.05).
Fig 5
Fig 5. BA treatment restores abnormal expression of Nrf2/Keap1 proteins caused by brusatol (Bru).
A Representative images of oocytes stained for Nrf2 and Keap1, and merged images (n = 27 per group). Merged images show cells positive for DAPI (blue), Nrf2 (green), and Keap1 (red). White box indicates the magnified nuclear region. B Nrf2 and C fluorescence intensity measurements. Data are means of three independent experiments; different letters indicate significant differences (P < 0.05).
Fig 6
Fig 6. BA treatment restores oocytes maturation impaired by Bru.
A Bright-field images of oocytes after IVM. Bar = 100 μm. B Proportions of different stages of nuclear maturation (0.0 μM BA, n = 391; Bru, n = 395; Bru+BA, n = 382). C Bright-field images of BA-treated oocytes at 6 days of culture after parthenogenetic activation. Bar = 100 μm. D–F Cleavage rate, blastocyst formation rate, and total cell number measurements (0.0 μM BA, n = 154; Bru, n = 132; Bru+BA, n = 152). G Representative images of TUNEL labeling in blastocysts. Merged images show cells positive for DAPI (blue) and TUNEL (green; white arrows). Bar = 50 μm. H, I Apoptosis rates and cell numbers (n = 26 per group). J Representative images of CDX2 labeling in blastocysts. Merged images show cells positive for DAPI (blue) and CDX2 (green). Bar = 50 μm. K, L Numbers of TE and ICM cells (n = 24 per group). Data are means of three independent experiments; different letters indicate significant differences (P < 0.05).
Fig 7
Fig 7. BA treatment restores impaired oxidative stress caused by Bru.
A Representative images of CM-H2DCFDA staining (green) in oocytes after 44 h of IVM. Bar = 100 μm. B Measurements of ROS fluorescence intensity (n = 40 per group). C Representative images of GSH staining (blue) in oocytes after 44 h of IVM. Bar = 100 μm. D Measurements of the GSH fluorescence intensity (n = 40 per group). E Transcription levels derived from qRT-PCR analysis of antioxidant genes in oocytes (n = 3 per group). Data are means of three independent experiments; different letters indicate significant differences (P < 0.05).
Fig 8
Fig 8. Graphical overview of the effect of BA treatment on porcine oocyte maturation.
BA treatment increased the proportion of MII oocytes, enhanced developmental rates, cell numbers, trophectoderm rates, and cell survival compared to control. Additionally, BA-treated oocytes exhibited reduced levels of ROS and elevated levels of glutathione, accompanied by enhanced expression of antioxidant genes. Especially, BA treatment mitigated the negative effects of H2O2-induced ROS activation and the Nrf2 inhibitor, brusatol, on meiotic maturation and oocyte quality. These results suggest that BA affects beneficial effects on the maturation of porcine oocytes, which can be attributable to the activation of the Nrf2/Keap1 signaling pathway by BA.

References

    1. Graham ME, Jelin A, Hoon AH, Jr., Wilms Floet AM, Levey E, Graham EM. Assisted reproductive technology: Short- and long-term outcomes. Dev Med Child Neurol. 2023;65(1):38–49. doi: 10.1111/dmcn.15332 - DOI - PMC - PubMed
    1. He M, Zhang T, Yang Y, Wang C. Mechanisms of Oocyte Maturation and Related Epigenetic Regulation. Front Cell Dev Biol. 2021;9:654028. doi: 10.3389/fcell.2021.654028 - DOI - PMC - PubMed
    1. Jiang Y, He Y, Pan X, Wang P, Yuan X, Ma B. Advances in Oocyte Maturation In Vivo and In Vitro in Mammals. Int J Mol Sci. 2023;24(10). doi: 10.3390/ijms24109059 - DOI - PMC - PubMed
    1. Prasad S, Tiwari M, Pandey AN, Shrivastav TG, Chaube SK. Impact of stress on oocyte quality and reproductive outcome. J Biomed Sci. 2016;23:36. doi: 10.1186/s12929-016-0253-4 - DOI - PMC - PubMed
    1. Mailloux RJ, Jin X, Willmore WG. Redox regulation of mitochondrial function with emphasis on cysteine oxidation reactions. Redox Biol. 2014;2:123–39. doi: 10.1016/j.redox.2013.12.011 - DOI - PMC - PubMed