. 2024 Oct 10;19(10):e0311761.
doi: 10.1371/journal.pone.0311761. eCollection 2024.

CRISPR/Cas9 gene editing in induced pluripotent stem cells to investigate the feline hypertrophic cardiomyopathy causing MYBPC3/R820W mutation

Affiliations

CRISPR/Cas9 gene editing in induced pluripotent stem cells to investigate the feline hypertrophic cardiomyopathy causing MYBPC3/R820W mutation

Luke C Dutton et al. PLoS One. .

Abstract

Hypertrophic cardiomyopathy (HCM) is the most common heart disease in domestic cats, often leading to congestive heart failure and death, with current treatment strategies unable to reverse or prevent progression of the disease. The underlying pathological processes driving HCM remain unclear, which hinders novel drug discovery. The aim of this study was to generate a cellular model of the feline HCM-causing MYBPC3 mutation R820W. Using CRISPR/Cas9 gene editing we introduced the R820W mutation into a human induced pluripotent stem cell (iPSC) line. We differentiated both homozygous mutant clones and isogenic control clones to cardiomyocytes (iPSC-CMs). Protein quantification indicated that haploinsufficiency is not the disease mechanism of the mutation. Homozygous mutant iPSC-CMs had a larger cell area than isogenic controls, with the sarcomere structure and incorporation of cMyBP-C appearing similar between mutant and control iPSC-CMs. Contraction kinetic analysis indicated that homozygous iPSC-CMs have impaired relaxation and are hypocontractile compared to isogenic control iPSC-CMs. In summary, we demonstrate successful generation of an iPSC model of a feline MYBPC3 mutation, with the cellular model recapitulating aspects of HCM including cellular hypertrophy and impaired relaxation kinetics. We anticipate that further study of this model will lead to improved understanding of the disease-causing molecular mechanism, ultimately leading to novel drug discovery.


Conflict of interest statement

The authors have declared that no competing interests exist.

Figures

Fig 1
Fig 1. Chromatogram from Sanger sequencing of a representative homozygous mutant clone and an isogenic control cell line.
The reference sequence if given at the top (location hg38 47337533 to 47337545). The site of the blocking mutation (to prevent re-cutting of the Cas9 nuclease) and the single nucleotide polymorphism (SNP) that results in the R820W mutation are highlighted. The isogenic control clone has the blocking mutation and is wild-type at the SNP location.
Fig 2
Fig 2. Characterisation of human induced pluripotent stem cell-derived cardiomyocytes (iPSC-CMs) assessed at day 35 of differentiation.
RT-qPCR showed that iPSC-CMs significantly down-regulated NANOG expression and up-regulated the cardiac specific markers TNNT2 and ACTC1 compared to iPSCs (n = 3 iPSC-CMs and 3 iPSC clonal lines from the same donor, p < 0.001, A). The Alu repeat sequences were used as internal control. Immunocytochemistry (ICC) showed that iPSCs expressed troponin T (TnT, green fluorescence, B), GATA4 (red fluorescence, B), cardiac myosin binding protein C (cMyBP-C, green fluorescence, C) and alpha-sarcomeric actinin (α-SA, red fluorescence, C). The iPSC-CMs also had organised sarcomeres, demonstrated by ICC staining of the A-band protein cMyBP-C (green fluorescence, D) and Z-disc protein α-SA (red fluorescence, D). Flow cytometry analysis of iPSC-CMs showed >95% of cells were troponin T positive (n = 3 separate differentiations, red histogram, E) compared to the negative control (undifferentiated iPSCs, blue histogram, E). Scale bars = 100 μm, (B), 200 μm (C) and 20 μm (D). Nuclei are stained with DAPI (blue fluorescence). * = p < 0.001.
Fig 3
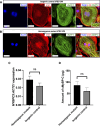
Fig 3. Cardiac myosin binding protein C expression in induced pluripotent stem cell-derived cardiomyocytes (iPSC-CMs) from homozygous mutant and isogenic control human iPSCs.
Immunocytochemistry showed that both homozygous mutant and isogenic control iPSC-CMs express and incorporate cardiac myosin binding protein C (cMyBP-C, green fluorescence) into the A-band of the sarcomere between the Z-disc protein alpha-sarcomeric actinin (α-SA, red fluorescence, A and B). Nuclei are stained with DAPI (blue fluorescence). RT-qPCR of MYPBC3 transcripts relative to ACTC1 showed no difference in expression levels between homozygous mutant and isogenic control iPSC-CMs (n = 3 homozygous mutant lines and 3 isogenic control lines, p = 0.231, C). The amount of cMyBP-C, measured per μg of total protein extract by ELISA, was also not different between the homozygous mutant and isogenic control iPSC-CMs (n = 3 homozygous mutant lines and 3 isogenic control lines, p = 0.109, D). Scale bars = 20 μM. ns = not significant.
Fig 4
Fig 4. Cell size of induced pluripotent stem cell-derived cardiomyocytes from homozygous mutant and isogenic control human iPSCs.
Representative alpha-sarcomeric actin-stained isogenic control and homozygous mutant cells used for cell size analysis (α-SA, red fluorescence, A and B respectively). The area of homozygous mutant iPSC-CMs was approximately 40% more than isogenic control iPSC-CMs (C, n = 3 homozygous mutant lines, total 268 cells, and 3 isogenic control lines, total 301 cells, p < 0.001). Whiskers indicate the maximum and minimum values; boxes show the mean and inter-quartile range.
Fig 5
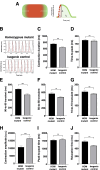
Fig 5. Contraction kinetics of induced pluripotent stem cell-derived cardiomyocytes (iPSC-CMs) with and without the R820W mutation analysed by MUSCLEMOTION software.
Panel A shows a schematic of the contractile pattern of an artificial cell the develops used to test the MUSCLEMOTION and relative parameters corresponding to amplitude of contraction (A), time-to-peak (t1), and relaxation time (t2). This figure was adapted and reproduced here from the report by Sala et al. with the authors permission [26]. Panel B shows contraction of iPSC-CMs as graphical representation of pixel motion (n = 3 homozygous mutant lines and 3 isogenic control lines). The red lines indicate measure of contraction amplitude and duration. Contraction duration (C), time-to-peak (D), 90-to-90 transient (E), 50-to-50 transient (F), 10-to-10 transient (G), contraction amplitude (H), peak-to-peak time (I) and relaxation time (J) are shown. HOM = homozygous. Error bars represent the mean ± SEM. Significance was determined by Student’s T-test; *** = p < 0.0001, ** = p < 0.001, ns = not significant. a.u. = arbitrary units.

References

    1. Luis Fuentes V, Abbott J, Chetboul V, Côté E, Fox PR, Häggström J, et al.. ACVIM consensus statement guidelines for the classification, diagnosis, and management of cardiomyopathies in cats. J Vet Intern Med. 2020;34: 1062–1077. doi: 10.1111/jvim.15745 - DOI - PMC - PubMed
    1. Payne JR, Brodbelt DC, Luis Fuentes V. Cardiomyopathy prevalence in 780 apparently healthy cats in rehoming centres (the CatScan study). J Vet Cardiol. 2015;17: S244–S257. doi: 10.1016/j.jvc.2015.03.008 - DOI - PubMed
    1. Fox PR, Keene BW, Lamb K, Schober KA, Chetboul V, Luis Fuentes V, et al.. International collaborative study to assess cardiovascular risk and evaluate long‐term health in cats with preclinical hypertrophic cardiomyopathy and apparently healthy cats: The REVEAL Study. J Vet Intern Med. 2018;32: 930–943. doi: 10.1111/jvim.15122 - DOI - PMC - PubMed
    1. Kittleson MD, Côté E. The Feline Cardiomyopathies: 2. Hypertrophic cardiomyopathy. J Feline Med Surg. 2021;23: 1028–1051. doi: 10.1177/1098612X211020162 - DOI - PMC - PubMed
    1. Messer AE, Chan J, Daley A, Copeland O, Marston SB, Connolly DJ. Investigations into the Sarcomeric Protein and Ca2+-Regulation Abnormalities Underlying Hypertrophic Cardiomyopathy in Cats (Felix catus). Front Physiol. 2017;8: 348. doi: 10.3389/fphys.2017.00348 - DOI - PMC - PubMed

LinkOut - more resources