. 2024 Oct 11;386(6718):eadl4492.
doi: 10.1126/science.adl4492. Epub 2024 Oct 11.

Epigenetic regulators of clonal hematopoiesis control CD8 T cell stemness during immunotherapy

Affiliations

Epigenetic regulators of clonal hematopoiesis control CD8 T cell stemness during immunotherapy

Tae Gun Kang et al. Science. .

Abstract

Epigenetic reinforcement of T cell exhaustion is known to be a major barrier limiting T cell responses during immunotherapy. However, the core epigenetic regulators restricting antitumor immunity during prolonged antigen exposure are not clear. We investigated three commonly mutated epigenetic regulators that promote clonal hematopoiesis to determine whether they affect T cell stemness and response to checkpoint blockade immunotherapy. CD8 T cells lacking Dnmt3a, Tet2, or Asxl1 preserved a progenitor-exhausted (Tpex) population for more than 1 year during chronic antigen exposure without undergoing malignant transformation. Asxl1 controlled the self-renewal capacity of T cells and reduced CD8 T cell differentiation through H2AK119 ubiquitination and epigenetic modification of the polycomb group-repressive deubiquitinase pathway. Asxl1-deficient T cells synergized with anti-PD-L1 immunotherapy to improve tumor control in experimental models and conferred a survival advantage to mutated T cells from treated patients.


Figures
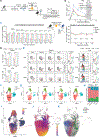
Fig 1.
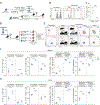
Fig 1.. Common regulators of clonal hematopoiesis control CD8 T cell stemness.
(A) Experimental scheme for assessing the role of specific epigenetic regulators controlling the expansion potential of T cells during chronic LCMV infection. P14 cells were transfected with Cas complexed with guide RNA for Rosa, Dnmt3a, Tet2, and Asxl1. Edited P14 cells were transferred into congenically distinct animals, and then were tracked in the blood longitudinally during chronic LCMV infection. After the chronic infection established terminal exhaustion in the WT P14 cells, mice were treated with PD-L1. Part of the illustration was created with Biorender.com. (B) Representative summary graph of the longitudinal percentage of Rosa, Dnmt3a, Tet2, and Asxl1 KO P14 cells among total CD8 T cells isolated from the peripheral blood of PD-L1 treated mice during chronic LCMV infection. (C) Longitudinal analysis of Rosa, Dnmt3a, Tet2, and Asxl1 KO P14 CD8 T cell quantity in the peripheral bold during one year of chronic infection, and after rechallenge of one year old splenic P14 cells. Chimeric mice for the re-challenge study were generated by transferring 3000 one year old chronically stimulated splenic P14 cells into native mice and chronically infecting chimeric mice with LCMV clone 13. (D) Bar graph for number of P14 CD8 T cells at 30 and 120 days post chronic LCMV infection isolated from the spleen (Top panel) and lungs (bottom panel). (E) Representative FACS plots and summary graph of TCF1 and GzmB expression on Rosa, Dnmt3a, Tet2, and Asxl1 KO P14 CD8 T cells isolated from the spleen (left panel) and lungs (right panel) of chronically infected mice at day 30 (top panel), day 120 (middle panel), and day 360 (bottom panel). (F) UMAP plots of cells form scRNA-seq samples, colored according to CD8 T cell clusters. (G) UMAP plots of all scRNA-seq clusters among four different groups. (H) Summarized bar graph for percentage of each cluster among four different groups. (I) UMAP plot showing developmental trajectories and pseudotime provided by monocle. Cells are color-coded on the basis of pseudotime prediction. (J) RNA velocity in transitory cluster with color-coded by latent time. (K) RNA velocity reflecting each group in transitory cluster with color-coded by latent time. (B-E) depict a representative experiment from at least two experiments. Each experiment comprised three to ten mice per group and was performed independently at least two times, leading to similar conclusions. Comparisons between groups were analyzed using two-tailed unpaired student’s t test (two groups) or two-way ANOVA with Tukey correction (more than two groups). Error bars indicate mean ± SEM.
Fig. 2.
Fig. 2.. Asxl1 KO stem-like CD8 T cells can differentiate into potent effectors
(A) CRISPR-edited Asxl1 KO P14 CD8 T cells were transferred into congenically distinct mice which were infected with chronic LCMV. At over 30 days post infection, congenically distinct splenocytes either PBS pulsed CTVhi (control) or GP33-pulsed CTVlo were adoptively transferred at an equal ratio. Part of the illustration was created with Biorender.com. (B) Representative histogram of CTVhi and CTVlo splenocytes pre- and post-transfer. (C) Summary graph of (B). (D) Experimental scheme for adoptive transfer experiment. At over 30 days post infection, Rosa Ly108+ or Tim3+ P14 cells were sorted from Rosa-transferred mice and Asxl1 KO Ly108+ or Tim3+ P14 cells were sorted from Asxl1 KO-transferred mice. Then each subset was transferred to infection-matched mice. Part of the illustration was created with Biorender.com. (E) After 21 days post cell transfer, transferred cells were analyzed by flow cytometry. (F-G) The frequency and number of transferred cells or each subset were summarized in bar graph. (A-C) depict a representative experiment from two experiments. (E-G) depict a pool of two independent experiments. Each experiment comprised two to six mice per group and was performed independently at least two times, leading to similar conclusions. Comparisons between groups were analyzed using two-tailed unpaired student’s t test (two groups) or two-way ANOVA with Tukey correction (more than two groups). Error bars indicate mean ± SEM.
Fig. 3.
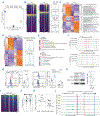
Fig. 3.. Asxl1 disruption preserves stem-associated chromatic accessibility and histone modification.
(A) PCA of ATAC-seq data for Rosa KO Ly108+, Rosa KO Tim3+, Asxl1 KO Ly108+, Asxl1 KO Tim3+ P14 cells at 30 days post LCMV CL13 infection. (B) Signal tracks (left and middle) and histograms (right) of DAR from ATAC-seq. (C) Heatmap of all DAR by ATAC-seq from each group. Representative genes and gene ontology analysis from each cluster are listed. (D) (Left) Heatmap of DAR in Tpex or Tex associated genes. (Right) Histogram of DAR associated with Tpex or Tex signature. (E) (top) GSEA analysis presenting enrichment of indicated signatures among genes upregulated in Asxl1 KO Ly108+ compared to Rosa KO Ly108+. (bottom) GSEA analysis presenting enrichment of indicated signatures among genes upregulated in Asxl1 KO Tim3+ compared to Rosa KO Tim3+. (F) Representative OCR signals detected by ATAC-seq at Tcf7 and Lef1 loci. Public ATAC-seq data of Tpex and Texh (GEO:GSE149879). (G) Representative histogram and summary graph for flow analysis of total H2AK119Ub among total Rosa and Asxl1 KO P14 cells (left) or stem (Ly108+) vs terminally exhausted (Tim3+) Rosa and Asxl1 KO P14 cell subset (right) at 30 days post after LCMV infection. (H) Representative western blots and summary graph of total H2AK119Ub among human AAVS and ASXL1 KO CD8 T cells. (I) Signal tracks of differential H2AK119Ub regions in each group from Cut&Tag data. (J) Quantification of genomic regions enriched for H2AK119Ub in Rosa and Asxl1 KO P14 cells at two weeks post LCMV infection. (K) Correlation plot between DEG of bulk-RNA sequencing and differential H2AK119Ub regions from Cut&Tag data. (L) Representative signals detected by ATAC-seq and Cut&Tag of H2AK119Ub or H3K27me3 at Tcf7 and Lef1 loci. Public ATAC-seq data of Tpex and Texh (GEO:GSE149879). (G-H) depict a representative experiment from at least two experiments. Each experiment comprised five to eight mice per group and was performed independently at least two times, leading to similar conclusions. Each sequencing was performed by at least duplicate, leading to similar conclusions. Comparison between groups were analyzed using two-tailed unpaired student’s t test. Error bars indicate mean ± SEM.
Fig. 4.
Fig. 4.. Asxl1 expression is coupled to survival during cancer immunotherapy in mice and humans.
Tumor growth curves (top) and overall survival (bottom) of (A) LLC1-GP33 tumor bearing mice treated with Rosa or Asxl1 KO P14 cells, and (B) B16-OVA tumor bearing mice treated with Rosa or Asxl1 KO OT-1 cells, and (C) B16F10 tumor bearing mice treated with Rosa or Asxl1 KO Pmel-1 cells. All tumor studies were performed with and without anti-PD-L1. (D-E) At 14 days post LLC1-GP33 tumor inoculation, P14 cells in the absence of anti-PD-L1 were analyzed by flow cytometry. (D) The frequency and number of P14 cells in tumor and tumor-draining lymph node were summarized in bar graph. (E) The frequency of IFNγ+ and TCF1+ cells among P14 cells were summarized in graph. (F-G) Tumor inoculated mice were injected with FTY720 daily from 10 to 20 days post tumor inoculation. (G) Tumor growth and overall survival was analyzed. (H) Kaplan-Meier survival curve of cancer patients with no ICB treatment, Nivolumab treatment, and anti-PD-L1 treatment. Patients were divided into two groups based on each indicated gene+ or gene- ratio. Patients sample numbers are indicated in each survival plot. (I) Sorting strategy of T cells from MDS patients. (Baseline n=3, Post-treatment n=2) (J) The ASXL1 VAF was summarized in graph. (A-G) depict a representative experiment from at least two independent experiments. Each experiment comprised four to eight mice per group and was performed independently at least two times, leading to similar conclusions. Comparisons between groups were analyzed using two-tailed unpaired student’s t test (two groups) or two-way ANOVA with Tukey correction (more than two groups). Error bars indicate mean ± SEM.

Comment in

References

    1. Gattinoni L et al. , A human memory T cell subset with stem cell-like properties. Nat Med 17, 1290–1297 (2011). - PMC - PubMed
    1. Sabatino M et al. , Generation of clinical-grade CD19-specific CAR-modified CD8+ memory stem cells for the treatment of human B-cell malignancies. Blood 128, 519–528 (2016). - PMC - PubMed
    1. Klebanoff CA, Gattinoni L, Restifo NP, Sorting through subsets: which T-cell populations mediate highly effective adoptive immunotherapy? J Immunother 35, 651–660 (2012). - PMC - PubMed
    1. Kurtulus S et al. , Checkpoint Blockade Immunotherapy Induces Dynamic Changes in PD-1(-)CD8(+) Tumor-Infiltrating T Cells. Immunity 50, 181–194 e186 (2019). - PMC - PubMed
    1. Krishna S et al. , Stem-like CD8 T cells mediate response of adoptive cell immunotherapy against human cancer. Science 370, 1328–1334 (2020). - PMC - PubMed

Publication types

MeSH terms