. 2024 Dec;89(6):106305.
doi: 10.1016/j.jinf.2024.106305. Epub 2024 Oct 9.

Infant-derived human nasal organoids exhibit relatively increased susceptibility, epithelial responses, and cytotoxicity during RSV infection

Affiliations

Infant-derived human nasal organoids exhibit relatively increased susceptibility, epithelial responses, and cytotoxicity during RSV infection

Gina M Aloisio et al. J Infect. 2024 Dec.

Abstract

Background: Respiratory syncytial virus (RSV) causes significant morbidity and mortality, especially in young children. Why RSV infection in children is more severe compared to healthy adults is not fully understood.

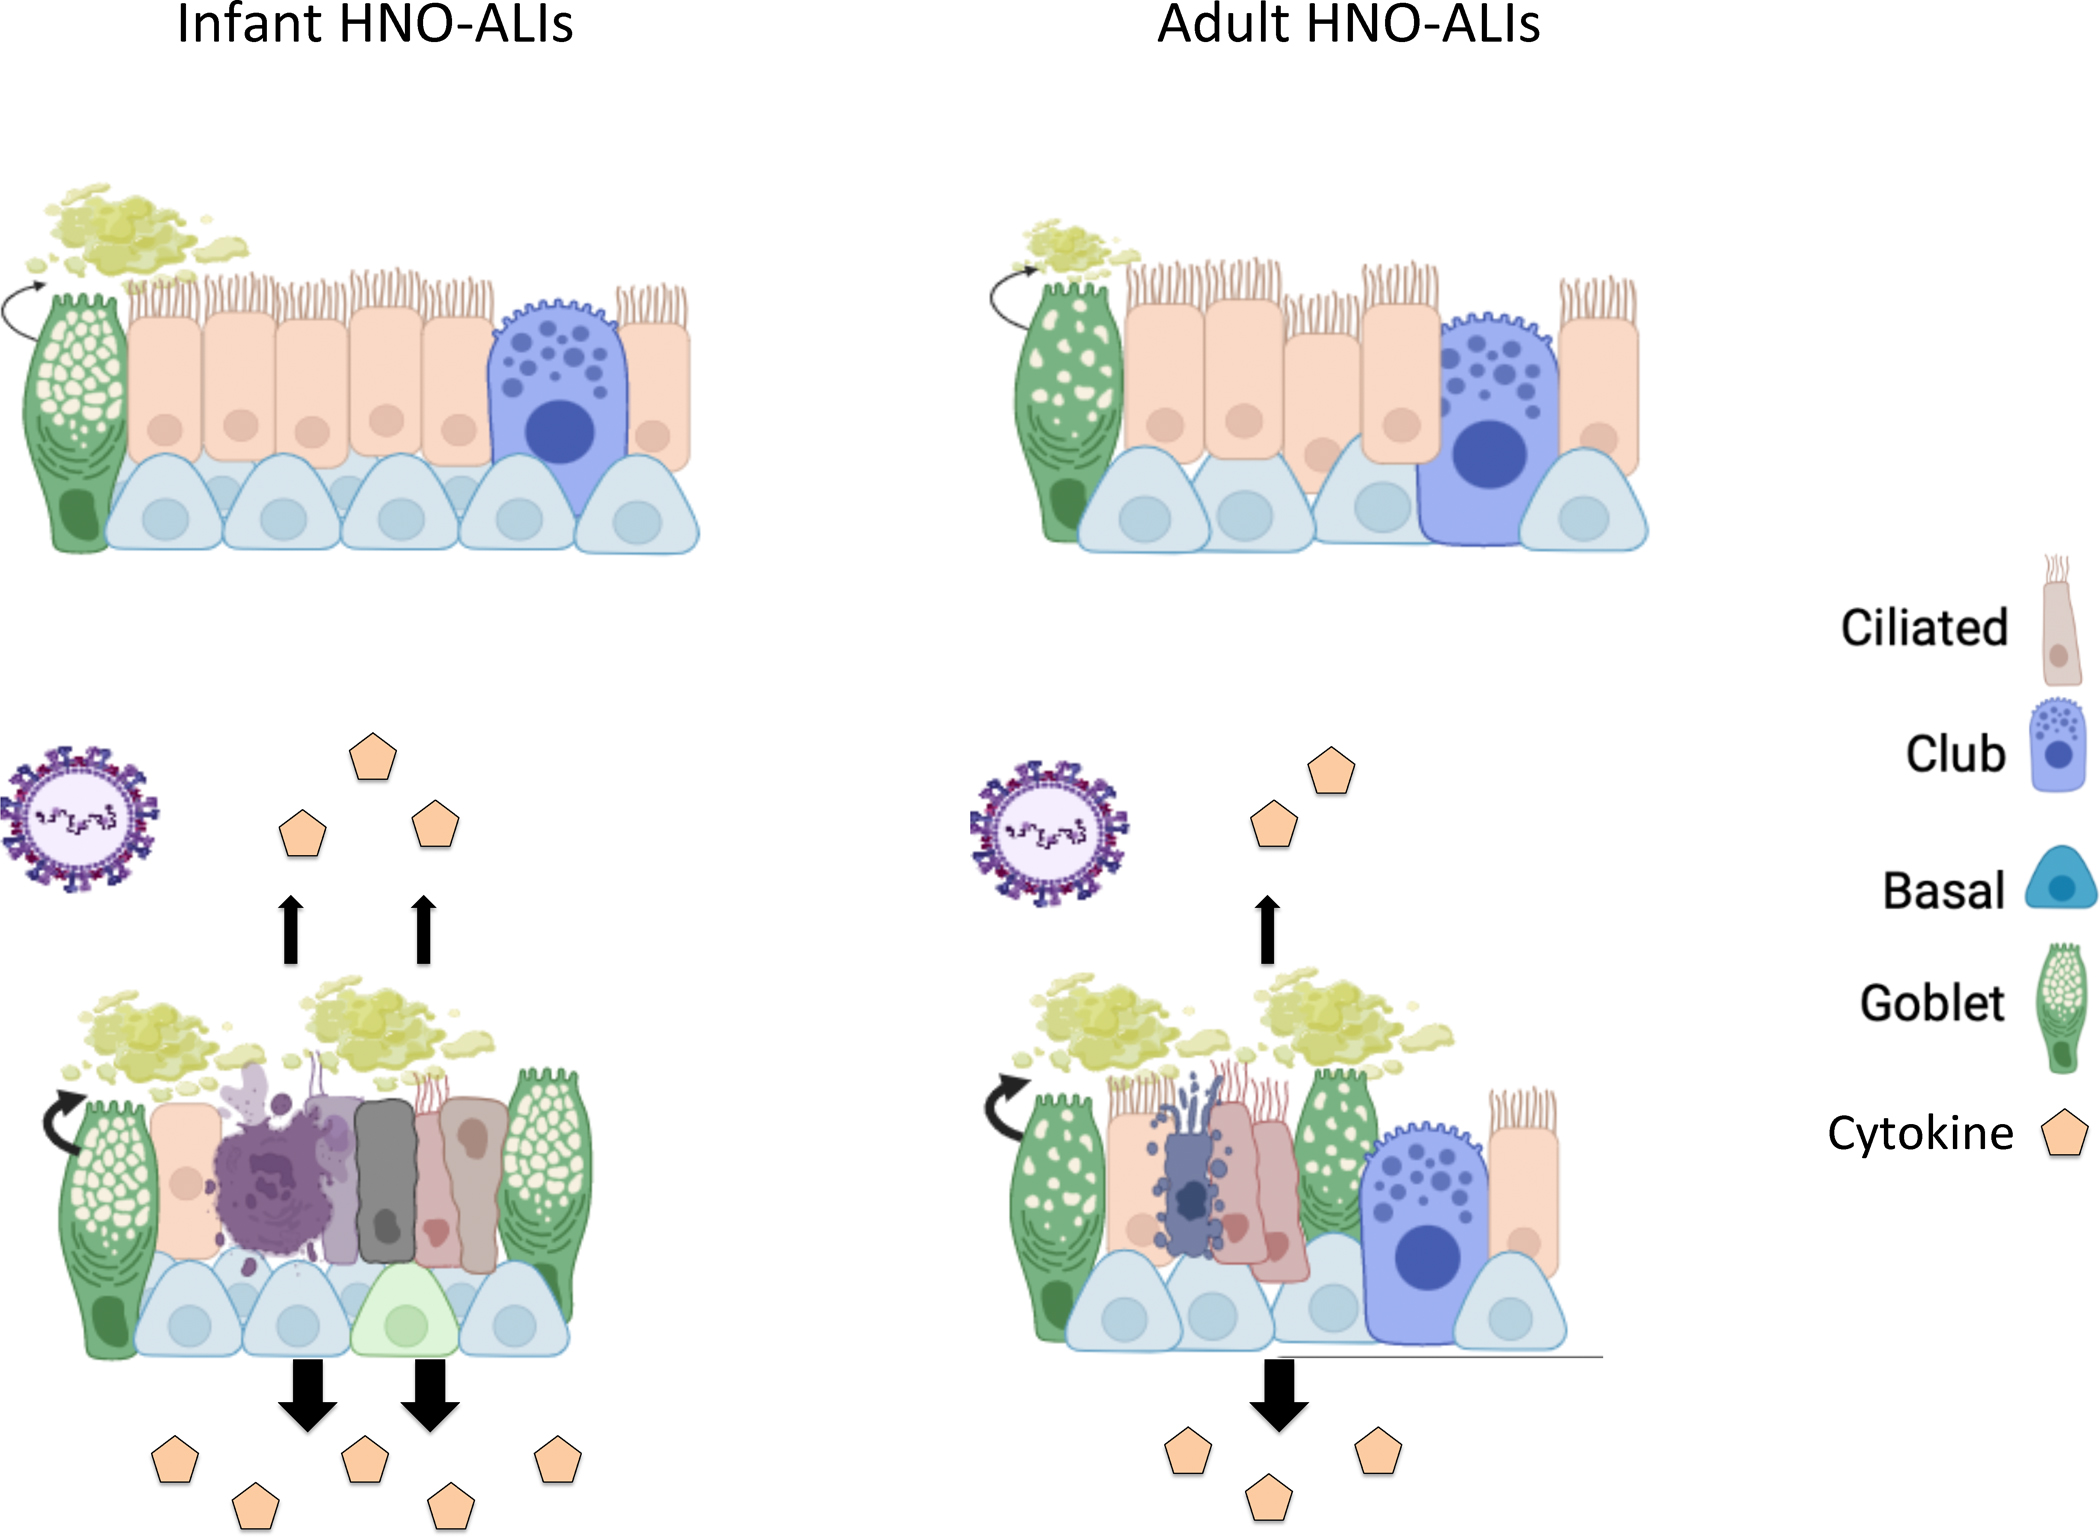
Methods: We used ex-vivo human nasal organoid platforms from infants and adults to investigate the underlying mechanism of this disease disparity at the initial site of RSV replication, the nasal epithelium.

Results: Infant-derived human nasal organoid-air liquid interface (HNO-ALIs) lines were more susceptible to early RSV replication. Moreover, infant-derived HNO-ALIs elicited a statistically significant greater overall cytokine response, enhanced mucous production, and greater cellular damage compared to their adult counterparts. Furthermore, the adult cytokine response was associated with a superior regulatory cytokine response, which could explain less cellular damage than in infant lines.

Conclusions: Our data highlights substantial differences in how infant and adult upper respiratory tract epithelium responds to RSV infection at the cellular level. These differences in epithelial cellular response can lead to impaired mucociliary clearance, a more dysregulated innate immune response predisposing infants to more severe RSV infection compared to adults.

Keywords: Adult; Infant; Infection; Innate immune responses; Nasal organoids; RSV; Replication.


Conflict of interest statement

Declaration of Competing Interest The authors declare no conflicts of interest.

Figures

Figure 1.
Figure 1.. Replication kinetics and morphologic analysis of RSV infected infant HNO-ALIs and adult HNO-ALIs.
A) Mean and standard deviation of RT PCR log10 copy number per mL from 4 adult and 4 pediatric HNO-ALIs infected with RSV/A/ON, apical wash genomic load measured at 1, 2, 5, 8 dpiand B) corresponding log10 Plaque Forming Units (PFU) measures. C) Mean and standard deviation of RT PCR log10 copy number per mL from 4 adult and 4 pediatric HNO-ALIs infected with RSV/B/BA, apical wash genomic load measured at 1, 2, 5, 8 dpi and D) corresponding log10 PFU measures. E) Forest plot depicting the difference in adjusted mean estimates between pediatric and adult HNO-ALIs with 95% confidence intervals of log10 PFU measures at each timepoint. The final model estimates were adjusted for virus (RSV/A/ON, RSV/B/BA), time (linear), age (pediatric, adult), and age-time interaction. The age-time interaction was statistically significant, p=0.001. F) H&E images of adult HNO-ALI 918 at 5 and 8 day post-infection (dpi). (* denotes goblet cells). G) H&E images of infant HNO-ALI 9003 at 5 and 8 dpi. (* denotes goblet cells). H) Comparison of mean epithelial area with standard deviation between infant and adult HNO-ALIs at 5 and 8 dpi with RSV/A/ON, RSV/B/BA, or mock infection. Each dot in a bar represents a well of the 4 HNO-ALIs lines. Scale bar is 100 μm.
Figure 2
Figure 2. Epithelial cytokine and chemokine response during RSV infection in infant and adult HNO-ALIs.
Forest plots demonstrating the adjusted odds ratio with 95% confidence interval of cytokine/chemokine expression. The final model estimates were adjusted for virus (mock, RSV/A/ON, RSV/B/BA), cell surface (basolateral, apical), time (linear, quadratic), age (pediatric, adult), age-virus interaction, and time-virus. No multiple comparison adjustment procedure was applied to any of the comparison (contrast) testing. A) Comparison of cytokine expression between infant and adult HNO-ALIs in terms of composite Z-score probabilities at each level of virus (significant age-virus interaction) for higher cytokine expression in overall cytokines and for each of the cytokine functional groups. Mock infection is shown in black, RSV/A/ON in red, and RSV/B/BA in blue. B) Comparison of higher cytokine expression (in terms of Z-score probabilities) between basolateral and apical compartments for overall cytokines and in each of the cytokine groups. C) Comparison of higher cytokine expression (in terms of Z-score probabilities) between infant and adult HNO-ALIs at each level of virus (significant age-virus interaction) and for each individual cytokine. Mock infection is shown in black, RSV/A/ON in red, and RSV/B/BA in blue. D) Comparison of higher cytokine expression (in terms of Z-score probabilities) between basolateral and apical compartments for each individual cytokine.
Figure 3.
Figure 3.. Cell death and damage during RSV infection in infant and adult HNO-ALIs.
LDH and caspase area were modeled on the following factors: interacting cell surface, viral infection, and dpi as well as age. A) Amount of apical LDH in 4 infant versus 4 adult HNO-ALIs infected with RSV/A/ON. B) or RSV/B/BA. C) Amount of apical caspase in 4 infant vs 4 adult HNO-ALIs infected with RSV/A/ON. D) or RSV/B/BA. E) Spearman correlation of infant and adult levels of LDH and caspase. Each dot represents the mean value of each unique experimental condition where both LDH and caspase were measured. Adult and Infant samples are colored magenta and green, respectfully F) Forest plot with adjusted odds ratio with 95% confidence intervals of apical or basolateral expression of LDH. G) Forest plot of adjusted odds ratios of apical or basolateral expression of caspase. Adjusted odds ratio estimates with 95% confidence intervals are represented by dots and T-bars, respectively.
Figure 4.
Figure 4.. Ciliary damage in infant and adult HNO-ALIs.
A) Representative IF imaging of a single adult HNO at 5 and 8 days post-infection (dpi). Basal cells are stained in red by Krt5, ciliated cells are stained in green by acetylated alpha tubulin, RSV particles are stained in yellow by anti-RSV antibody, and cellular nuclei are stained in blue by DAPI and B) single infant HNO-ALI at 5 and 8 dpi. Basal cells are stained in red by Krt5, ciliated cells are stained in green by acetylated alpha tubulin, RSV particles are stained in yellow by anti-RSV antibody, and cellular nuclei are stained in blue by DAPI. Scale bar is 100 μm. C) Percentage of ciliary damage in adult vs infant HNO-ALIs at 5 or 8 dpi. In this graph, the ciliary area is normalized to the corresponding HNO-ALI mock infection being 100%. D) Forest plot of mock versus virus of cilia area modeled on the following factors: the interaction of dpi and age, the interaction of age and viral infection, and the interaction of dpi and virus. Adjusted risk ratio estimates and their associated 95% confidence intervals are represented by dots and T-bars, respectively. E) Forest plot of ciliary area of adults versus infants was modeled on the following factors: the interaction of dpi and HNO-ALI age, the interaction of age and viral infection, and the interaction of dpi and virus. Adjusted risk ratio estimates and their associated 95% confidence intervals are represented by dots and T-bars, respectively.
Figure 5.
Figure 5.. Mucous secretion in infant and adult HNO-ALIs
A) Representative IF imaging of a single uninfected adult and infant HNO-ALI. Basal cells are stained in red by Krt5, mucus in green by Muc5AC, and cellular nuclei are stained in blue by DAPI. B) Mucous area was modeled using the following factors: the interaction of days post-infection (dpi) and HNO age, the interaction of age and viral infection, and the interaction of dpi and virus. Forest plot of the adjusted relative risk with 95% confidence interval of having higher mucous area in infant vs adult HNO-ALIs. Adjusted risk ratio estimates and their associated 95% confidence intervals are represented by dots and T-bars, respectively. Scale bar is 100 μm. C) The area of mucus (Muc5AC+ area) in adult compared to infant HNO-ALIs infected with RSV/A/ON (red) and RSV/B/BA (blue) at 5 and 8 dpi. D) Adjusted relative risk of higher mucus (Muc5AC) area in mock compared to viral infection in combined adult and infant HNOs. E) Percentage of goblet cells (Muc5AC+ cells with DAPI+ nuclei over total number of DAPI+ cells) in adult compared to infant HNO-ALIs at 5 and 8 dpi. F) Goblet cell percentage data was modeled using the following factors: the interaction of age and virus as well as the interaction of day and virus. Adjusted odds ratio estimates and their associated 95% confidence intervals are represented by dots and T-bars, respectively.
Figure 6.
Figure 6.. Club cells in infant and adult HNO-ALIs
A) Representative IF images of a single adult HNO and B) single infant HNO at day 5 and 8 post infection. Club cells are stained red with CC10, goblet cells are stained in green by Muc5AC, RSV particles are stained in magenta by anti-RSV antibody, and cell nuclei are stained in blue by DAPI. Scale bar is 100 μm. C) Percentage of club cells (CC10+ cells with DAPI+ nuclei over total number of DAPI+ cells) in adult compared to infant HNO-ALIs at 5- and 8-day post-infection (dpi). D) Club cell percentage data was modeled using the following factors: the interaction of dpi and HNO age, the interaction of age and viral infection, and the interaction of dpi and virus. Adjusted odds ratio estimates with 95% confidence intervals are represented by dots and T-bars, respectively. E) Adjusted odds ratio with 95% confidence intervals of higher percentage of club cells in adult compared to infant HNOs.
Figure 7:
Figure 7:. Cell proliferation in infant and adult HNO-ALIs
A) Representative Ki67 staining of a single adult HNO-ALI and B) single infant HNO-ALI at 5- and 8-day post infection (dpi) with RSV/A/ON, RSV/B/BA, or mock infection. Scale bar is 100 μm. C) Percentage of proliferating cells (number of Ki67 positive cells/ total cells) in 4 adult HNO-ALIs versus 4 infant HNO-ALIs at 5 or 8 dpi after infection with RSV/A/ON, RSV/B/BA, or mock infection. D) Percentage of basal cells (number of Krt5 positive cells/ total cells) in 4 adult HNO-ALIs versus 4 infant HNO-ALIs at 5 or 8 dpi after infection with RSV/A/ON, RSV/B/BA, or mock infection. E) Ki67 percent data was modeled using the following factors: the interaction of dpi and HNO age as well as the interaction of dpi and virus. Forest plot showing the adjusted odds ratio with 95% confidence intervals between adult and infant HNOs of having a higher amount of proliferating cells. Adjusted odds ratio estimates and their associated 95% confidence intervals are represented by dots and T-bars, respectively. There was no difference between mock and RSV infected HNOs, and thus this was dropped from the model and graph. F) Percentage of proliferating cells, in 4 adult HNO-ALIs at 1, 2, 5, and 8 dpi with RSV/A/ON or RSV/B/BA or mock infection. Each line shows variability in amount of proliferation. G) Percentage of proliferating cells in 4 infant HNO-ALIs at 1, 2, 5, and 8 dpi with RSV/A/ON or RSV/B/BA or mock infection.
Figure 8:
Figure 8:. Schematic of RSV infection in infant compared to adult HNO-ALIs.
Prior to infection, infant lines have increased mucus as well as more basal cells. After infection with RSV, both infant and adult HNOs have ciliary damage, increased mucus production, cell death and damage, and increase cytokine production. However, infant lines have more ciliary damage, more cellular damage, and increased cytokine production compared to adult lines. Infant lines do not have a comparative increase in the amount of apoptosis to their increased cell damage compared to adult lines, suggesting that other mechanisms of cell death such as cell necrosis may be contributing, further augmenting the inflammatory response. Created with BioRender.com

Update of

References

    1. Shi T, et al. Global, regional, and national disease burden estimates of acute lower respiratory infections due to respiratory syncytial virus in young children in 2015: a systematic review and modelling study. Lancet. 2017;390(10098):946–958. - PMC - PubMed
    1. Meissner HC. Viral Bronchiolitis in Children. N Engl J Med. 2016;374(1):62–72. - PubMed
    1. Laudanno Sofía L et al. “RSV Lower Respiratory Tract Illness in Infants of Low- and Middle-income Countries.” Acta medica academica vol. 49,2 (2020): 191–197. doi:10.5644/ama2006-124.297 - DOI - PubMed
    1. Smith DK, Seales S, Budzik C. Respiratory Syncytial Virus Bronchiolitis in Children. Am Fam Physician. 2017;95(2):94–99. - PubMed
    1. Glezen WP, et al. Risk of primary infection and reinfection with respiratory syncytial virus. Am J Dis Child. 1986;140(6):543–6. - PubMed