. 2024 Oct 10;7(12):e202302505.
doi: 10.26508/lsa.202302505. Print 2024 Dec.

NAD+ depletion is central to placental dysfunction in an inflammatory subclass of preeclampsia

Affiliations

NAD+ depletion is central to placental dysfunction in an inflammatory subclass of preeclampsia

Fahmida Jahan et al. Life Sci Alliance. .

Abstract

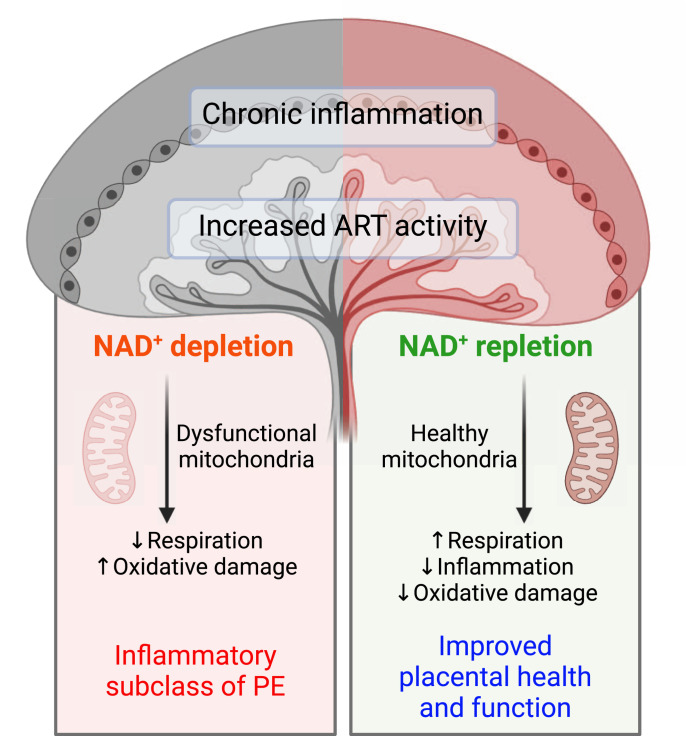
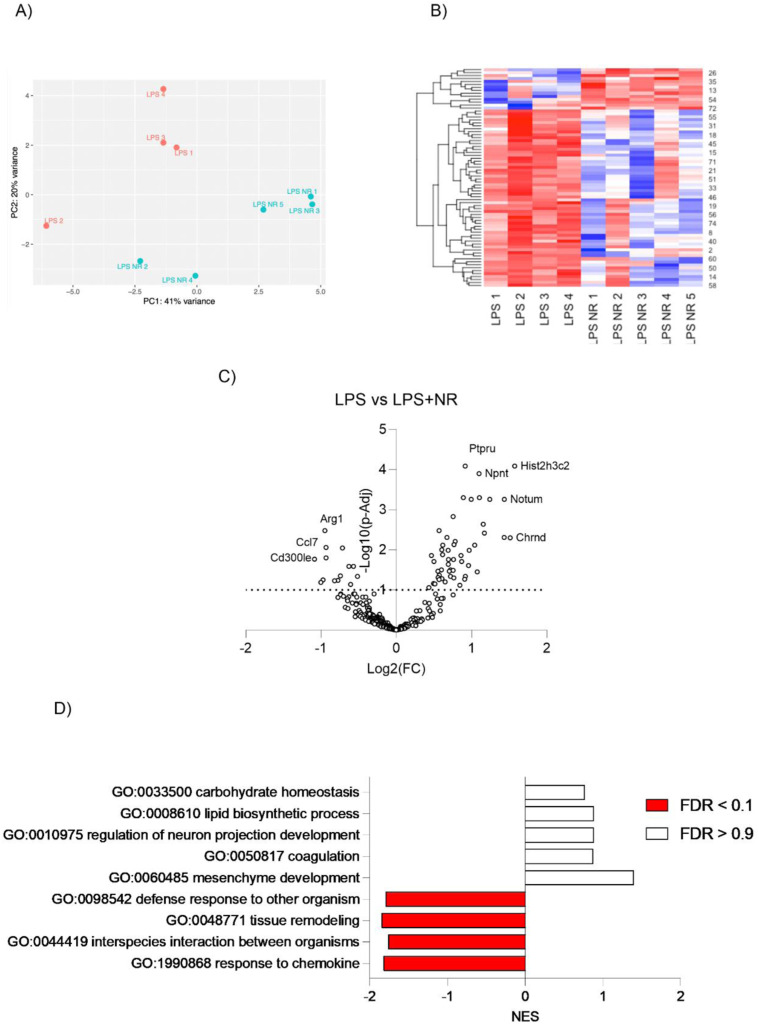
Preeclampsia (PE) is a hypertensive disorder of pregnancy and a major cause of maternal/perinatal adverse health outcomes with no effective therapeutic strategies. Our group previously identified distinct subclasses of PE, one of which exhibits heightened placental inflammation (inflammation-driven PE). In non-pregnant populations, chronic inflammation is associated with decreased levels of cellular NAD+, a vitamin B3 derivative involved in energy metabolism and mitochondrial function. Interestingly, specifically in placentas from women with inflammation-driven PE, we observed the increased activity of NAD+-consuming enzymes, decreased NAD+ content, decreased expression of mitochondrial proteins, and increased oxidative damage. HTR8 human trophoblasts likewise demonstrated increased NAD+-dependent ADP-ribosyltransferase (ART) activity, coupled with decreased mitochondrial respiration rates and invasive function under inflammatory conditions. Such adverse effects were attenuated by boosting cellular NAD+ levels with nicotinamide riboside (NR). Finally, in an LPS-induced rat model of inflammation-driven PE, NR administration (200 mg/kg/day) from gestational days 1-19 prevented maternal hypertension and fetal/placental growth restriction, improved placental mitochondrial function, and reduced inflammation and oxidative stress. This study demonstrates the critical role of NAD+ in maintaining placental function and identifies NAD+ boosting as a promising preventative strategy for PE.


Conflict of interest statement

The authors declare that they have no conflict of interest.

Figures

None
Graphical abstract
Figure 1.
Figure 1.. Identification of altered NAD+/ADP-ribosylation signaling, mitochondrial proteomes, and oxidative damage in human placentas with inflammation-driven PE (PE3).
(A, B, C) Gene expression of inflammatory markers in human placenta biopsies from all three PE subclasses (n = 4 placentas/group). (B, C) Representative immunofluorescence images and quantification of protein ADP-ribosylation in trophoblasts of human placental tissue sections from all three PE subclasses and various control groups (n = 7–8 placentas/group). ADP-ribosylation was measured specifically within the trophoblasts highlighted using the white lines. (D, E, F, G) LC/MS quantification of human placental NAD(H) levels (n = 15–42 placentas/group). (H) Heatmap of down-regulated mitochondrial proteins in inflammatory PE3 (term) placentas compared with control term placentas (n = 5–6 per group). Shown are only proteins that met the false discovery rate threshold of 0.05. (I, J) Placental oxidative stress was determined by immunofluorescence staining of human placental tissue sections with anti-8-oxo-dG antibody and quantification by the integrated intensity/area of trophoblasts (n = 4 per group). One-way ANOVA with Holm–Šídák’s multiple comparisons test, *P < 0.05, **P < 0.01, ***P < 0.001. The error bar indicates the SD. Control = control term and preterm, CH = chronic hypertension control, PE1 = gestational parent–driven PE subclass, PE2 = hypoxia-driven PE subclass, PE3 = inflammation-driven PE subclass.
Figure S1.
Figure S1.. Placental NAD+-related metabolite–NAM levels and the mitochondrial content in human PE subclasses.
(A) Placental NAM levels were determined by LC/MS. (B, C) Placental mitochondrial content was determined by measuring the activity of two markers, citrate synthase and complex IV, by performing enzymatic activity assays (n = 17–41 placentas/group). One-way ANOVA with Holm–Šídák's multiple comparisons test. The error bar indicates the SD. (D) Heatmap of down-regulated mitochondrial proteins in hypoxia-driven PE2 placentas compared with control placentas (n = 5–6 per group). Shown are only proteins that met the false discovery rate threshold of 0.05. Control = control term and preterm, CH = chronic hypertension control, PE 1 = gestational parent–driven PE subclass, PE2 = hypoxia-driven PE subclass, PE2 = inflammation-driven PE subclass.
Figure 2.
Figure 2.. Potential of NAD+ boosting to improve HTR8/SVneo human trophoblast health and function under an inflammatory in vitro condition.
(A, B) Trophoblast protein ADP-ribosylation was determined by Western blot with anti-ADP-ribosylation antibody on cells treated with 10 ng/ml TNF-α and/or 150 μM–1 mM NR for 24 h (n = 3). One-way ANOVA with Holm–Šídák's multiple comparisons test. (C) Total cellular NAD+(H) and NAD+/NADH ratio quantification was performed on cells treated with or without 10 ng/ml TNF-α for 24 h (n = 3). One-tailed unpaired t test. (D, E, F, G) XFe96 Seahorse Mito stress test was performed on cells treated with 10 ng/ml TNF-α and/or 250 μM NR for 24 h. Basal, ATP-linked, and maximal mitochondrial respiration rates and extracellular acidification rates were measured (n = 4). (H, I, J, K, L) Expression of oxidative phosphorylation (OXPHOS) proteins was determined by Western blot with OXPHOS antibody cocktail on cells treated with 10 ng/ml TNF-α and/or 250 μM NR for 24 h (n = 4–7). (M, N) Trophoblast invasion capacity was determined by performing a Matrigel invasion assay on cells treated with 10 ng/ml TNF-α and/or 250 μM NR for 72 h (n = 3). Two-way ANOVA with Holm–Šídák's multiple comparisons test, *P < 0.05, **P < 0.01, ***P < 0.001. The error bar indicates the SD. TNF-α = tumor necrosis factor, NR = nicotinamide riboside. Source data are available for this figure.
Figure S2.
Figure S2.. NAD+ boosting in HTR8/SVneo cells under an inflammatory condition.
Total cellular NAD+ quantification was performed on cells treated with 10 ng/ml TNF-α and/or 250 μM NR for 24 h (n = 3). One-tailed unpaired t test, *P < 0.05. The error bar indicates the SD. TNF-α = tumor necrosis factor, NR = nicotinamide riboside.
Figure 3.
Figure 3.. Effect of NAD+ boosting in preventing inflammation-driven PE in a rat model.
(A) Study design: pregnant rats were given either NR or drinking water from GD 1-19, and either LPS (20–70μg/kg/day) or saline was injected from GD 13–18; euthanasia was performed on GD 19 (created with BioRender.com on 12 June 2023). (B) Blood pressure was measured from GD 14–19 by the tail–cuff method (n = 6–8 pregnant rats/treatment). * indicates P-values between saline and LPS, and # indicates P-values between LPS and LPS+NR. (C) Fetal survival and death percentage. Two-way ANOVA with Holm–Šídák's multiple comparisons test. (D, E) Fetal and placental weights were measured (n = 10–12 litters/treatment). One-way ANOVA with Holm–Šídák's multiple comparisons test. (F, G, H, I, J) Total placenta area along with individual regions such as labyrinth (Lab), junctional zone (Jz), and decidua was measured (n = 7–9 litters/treatment, 1 placenta/litter). Two-way ANOVA with Holm–Šídák's multiple comparisons test, */#P < 0.05, **P < 0.01, ***P < 0.001, ****/####P < 0.0001. The error bar indicates the SD. LPS = lipopolysaccharide, NR = nicotinamide riboside.
Figure 4.
Figure 4.. Effect of NAD+ boosting on placental dysfunction in a rat model of inflammatory PE.
(A) Placental TNF-α levels were determined by ELISA (n = 7–9 litters/treatment, 1 placenta/litter). (B, C) Placental protein ADP-ribosylation was determined by Western blot with anti-ADP-ribosylation antibody (n = 10 litters/treatment, 1 placenta/litter). (D) Placental ADP-ribose (ADPR) levels were determined by LC/MS (n = 6–10 litters/treatment, 1 placenta/litter). (E, F, G, H) Placental NAD+(H) levels were determined by a colorimetric assay (n = 8–10 litters/treatment, 1 placenta/litter). (I, J) Placental mitochondrial function was determined by performing an oxygraph assay on isolated mitochondria. Complex I– and complex II–mediated oxygen consumption rates were recorded to determine their activity (n = 4–8 litters/treatment, 6–8 placentas/litter). (K, L) Placental oxidative stress was determined by Western blot with anti-pH2A.X antibody, a marker of oxidative DNA damage (n = 7 litters/treatment, 1 placenta/litter). (M, N) Placental sections were stained with anti-pH2A.X antibody to determine the number of pH2A.X-positive cells in different regions of placenta (n = 5 litters/treatment, 1 placenta/litter). Two-way ANOVA with Holm–Šídák's multiple comparisons test, *P < 0.05, **P < 0.01, ***P < 0.001. The error bar indicates the SD. ADPR = ADP-ribose, LPS = lipopolysaccharide, NR = nicotinamide riboside.
Figure S3.
Figure S3.. Effect of NAD+ boosting on the placental transcriptome of a rat model of inflammation-driven PE.
(A, B, C, D) Principal component analysis, (B) heatmap, (C) volcano plot, and (D) GO-term analysis were performed between LPS and LPS+NR-treated rat placentas (n = 4–5 litters/treatment, 1 placenta/litter).
Figure S4.
Figure S4.. Effect of LPS and NAD+ boosting on placental NAM levels and mitochondria.
(A, B) NAM levels were determined by LC/MS (n = 5 litters/treatment, 1 placenta/litter). (B) Mitochondrial complex IV activity was measured by an oxygraph assay (n = 4–8 litters/treatment, 6–8 placentas/litter). (C, D, E, F, G, H, I, J, K) Placental OXPHOS, OPA1, YME1L1, and CLPP protein levels were determined by Western blot (n = 5 litters/treatment, 1 placenta/litter). Two-way ANOVA with Holm–Šídák's multiple comparisons test, *P < 0.05, **P < 0.01, ***P < 0.001. The error bar indicates the SD.

References

    1. Kuklina EV, Ayala C, Callaghan WM (2009) Hypertensive disorders and severe obstetric morbidity in the United States. Obstet Gynecol 113: 1299–1306. 10.1097/AOG.0b013e3181a45b25 - DOI - PubMed
    1. Backes CH, Markham K, Moorehead P, Cordero L, Nankervis CA, Giannone PJ (2011) Maternal preeclampsia and neonatal outcomes. J Pregnancy 2011: 214365. 10.1155/2011/214365 - DOI - PMC - PubMed
    1. Leavey K, Benton SJ, Grynspan D, Kingdom JC, Bainbridge SA, Cox BJ (2016) Unsupervised placental gene expression profiling identifies clinically relevant subclasses of human preeclampsia. Hypertension 68: 137–147. 10.1161/HYPERTENSIONAHA.116.07293 - DOI - PubMed
    1. Leavey K, Bainbridge SA, Cox BJ (2015) Large scale aggregate microarray analysis reveals three distinct molecular subclasses of human preeclampsia. PLoS One 10: e0116508. 10.1371/journal.pone.0116508 - DOI - PMC - PubMed
    1. Powers RW, Roberts JM, Plymire DA, Pucci D, Datwyler SA, Laird DM, Sogin DC, Jeyabalan A, Hubel CA, Gandley RE (2012) Low placental growth factor across pregnancy identifies a subset of women with preterm preeclampsia: Type 1 versus type 2 preeclampsia? Hypertension 60: 239–246. 10.1161/HYPERTENSIONAHA.112.191213 - DOI - PMC - PubMed

LinkOut - more resources