. 2024 Oct 10;15(10):736.
doi: 10.1038/s41419-024-07071-0.

BCKDH kinase promotes hepatic gluconeogenesis independent of BCKDHA

Affiliations

BCKDH kinase promotes hepatic gluconeogenesis independent of BCKDHA

Feiye Zhou et al. Cell Death Dis. .

Abstract

Elevated circulating branched-chain amino acids (BCAAs) are tightly linked to an increased risk in the development of type 2 diabetes mellitus. The rate limiting enzyme of BCAA catabolism branched-chain α-ketoacid dehydrogenase (BCKDH) is phosphorylated at E1α subunit (BCKDHA) by its kinase (BCKDK) and inactivated. Here, the liver-specific BCKDK or BCKDHA knockout mice displayed normal glucose tolerance and insulin sensitivity. However, knockout of BCKDK in the liver inhibited hepatic glucose production as well as the expression of key gluconeogenic enzymes. No abnormal gluconeogenesis was found in mice lacking hepatic BCKDHA. Consistent with the vivo results, BT2-mediated inhibition or genetic knockdown of BCKDK decreased hepatic glucose production and gluconeogenic gene expressions in primary mouse hepatocytes while BCKDK overexpression exhibited an opposite effect. Whereas, gluconeogenic gene expressions were not altered in BCKDHA-silenced hepatocytes. Mechanistically, BT2 treatment attenuated the interaction of cAMP response element binding protein (CREB) with CREB-binding protein and promoted FOXO1 protein degradation by increasing its ubiquitination. Our findings suggest that BCKDK regulates hepatic gluconeogenesis through CREB and FOXO1 signalings, independent of BCKDHA-mediated BCAA catabolism.


Conflict of interest statement

The authors declare no competing interests.

Figures

Fig. 1
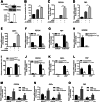
Fig. 1. Liver-specific defect of BCKDK reduces hepatic glucose production in mice fed normal chow.
A A schematic summary of BCAA catabolic pathway. B BCKDK protein expression and BCKDHA phosphorylation levels in the livers from db/m and db/db mice (n = 4). C BCKDK mRNA level in the livers from db/m and db/db mice (n = 4). D BCKDK protein expression and BCKDHA phosphorylation levels in the livers from C57BL/6 mice under feeding and fasting conditions (n = 3). E BCKDK mRNA expression in the livers from C57BL/6 mice underfeeding and fasting conditions (n = 3). F BCKDK mRNA expression in the liver was collected from BCKDKAlb KO and WT mice (n = 3). G BCKDK protein expression in various tissues. H Body weight of 9-week-old male mice (n = 10). I Random and fasting blood glucose levels (n = 10). J Blood glucose levels during intraperitoneal glucose tolerance test (GTT) after 16 h fasting (n = 5). K Blood glucose levels during insulin tolerance test (ITT) after 6 h fasting (n = 5). L Blood glucose levels during intraperitoneal pyruvate tolerance test (PTT) after 16 h fasting (n = 8). M PEPCK, G6Pc, and FBP mRNA expressions in the liver (n = 10). N, O Western blot analysis of G6Pc and PEPCK expressions in the liver. Data are expressed as means ± SEM. *P < 0.05, **P < 0.01, ***P < 0.001 vs WT group.
Fig. 2
Fig. 2. Inhibitory effect of hepatic BCKDK knockout on gluconeogenesis under BCAA + HFD condition.
A Body weight of BCKDKAlb KO and WT mice fed with BCAA + HFD throughout the study duration (n = 15). B Total fat mass and lean mass (n = 15). C Liver weight (n = 15). D Blood glucose levels during pyruvate tolerance test (PTT) after 12 weeks of BCAA + HFD feeding (n = 5–6). E PEPCK, G6Pc, and FBP mRNA expressions in the liver (n = 7). FH Oxygen consumption (VO2), carbon dioxide (VCO2) production, and respiratory exchange ratios (RER) during 24 h (n = 8). I General locomotor activity during light and dark periods (n = 8). Data are expressed as means ± SEM. *P < 0.05 vs WT group.
Fig. 3
Fig. 3. Metabolic effect of liver-specific knockout of BCKDHA on mice fed normal chow.
A BCKDHA protein expression in various tissues. B BCKDHA mRNA expression in the liver collected from BCKDHAAlb KO and WT mice (n = 3). C Body weight of 14-week-old male mice (n = 5). D Total fat mass and lean mass (n = 5). E Blood glucose levels during intraperitoneal glucose tolerance test (GTT) after 16 h fasting (n = 5). F Blood glucose levels during insulin tolerance test (ITT) after 6 h fasting (n = 5). G Blood glucose levels during intraperitoneal pyruvate tolerance test (PTT) after 16 h fasting (n = 4). H PEPCK, G6Pc, and FBP mRNA expressions in the liver (n = 5). Data are expressed as means ± SEM. ***P < 0.001 vs WT group.
Fig. 4
Fig. 4. BT2 inhibits gluconeogenesis in primary mouse hepatocytes.
A BCKDK protein expression and BCKDHA phosphorylation levels in primary mouse hepatocytes treated with 100 μM 8-Br-cAMP for 16 h. B BCKDK mRNA expression in primary mouse hepatocytes treated with 100 μM 8-Br-cAMP for 16 h. C Protein expression of BCKDK in primary mouse hepatocytes incubated with 100 μM 8-Br-cAMP for the indicated time. D BCKDK protein expression in primary mouse hepatocytes treated with 100 μM 8-Br-cAMP and 10 μg/ml cycloheximide (CHX) for the indicated time. Signal intensity was quantified by image J software for statistical comparison. E Phosphorylation level of BCKDHA in primary mouse hepatocytes incubated with 200 μM BT2 for 1 h. F Primary mouse hepatocytes were incubated with 200 μM BT2 and 100 μM 8-Br-cAMP in glucose-free DMEM containing gluconeogenic substrates (1 mM sodium pyruvate and 10 mM sodium lactate) for 24 h. The cell culture supernatants were collected to measure glucose content. G Volcano plots showed the differentially expressed genes between BT2-treated and control hepatocytes. H The top 25 most enriched pathways in KEGG pathway analysis. I Enrichment plot of Glycolysis/Gluconeogenesis pathway in GSEA analysis. JL mRNA expressions of gluconeogenic genes in primary mouse hepatocytes treated with 200 μM BT2 and 100 μM 8-Br-cAMP. M PEPCK promoter activity was detected in HepG2 cells. N Protein expression of PEPCK in primary mouse hepatocytes treated with 200 μM BT2 and 100 μM 8-Br-cAMP. Data are expressed as means ± SEM for three independent experiments. *P < 0.05, **P < 0.01, ***P < 0.001 vs control group.
Fig. 5
Fig. 5. BCKDK affects the transcription of key gluconeogenic genes.
A Protein level of Flag-BCKDK in primary mouse hepatocytes transfected with control vector (CON267) or BCKDK-overexpressing adenovirus (Ad-BCKDK). B After transfected with CON267 or Ad-BCKDK adenovirus, primary mouse hepatocytes were incubated with 100 μM 8-Br-cAMP in glucose-free DMEM containing gluconeogenic substrates for 24 h, and glucose content was measured. CE mRNA levels of gluconeogenic genes in primary mouse hepatocytes transfected with Ad-BCKDK. F, G After transfected with Ad-BCKDK or CON267, primary mouse hepatocytes were incubated with 200 μM BT2 and 100 μM 8-Br-cAMP for 16 h, and PEPCK and FBP mRNA expressions were detected by RT-qPCR. HL Primary hepatocytes isolated from BCKDKloxP/loxP mice were infected with Ad-Cre and then incubated with 100 μM 8-Br-cAMP for 16 h, hepatic glucose production as well as mRNA expressions of BCKDK and gluconeogenic genes were assayed respectively. MO mRNA levels of three key gluconeogenic enzymes in BCKDKloxP/loxP hepatocytes co-transfected with Ad-Cre and Ad-BCKDK and incubated with 100 μM 8-Br-cAMP and 200 μM BT2. Data are expressed as means ± SEM for three independent experiments. *P < 0.05, **P < 0.01, ***P < 0.001 vs control group. #P < 0.05, ##P < 0.01, ###P < 0.001 vs cAMP group.
Fig. 6
Fig. 6. BCKDK regulates hepatic gluconeogenesis independent of BCKDHA.
AB Protein and mRNA levels of BCKDHA in primary mouse hepatocytes transfected with control vector (CON098) or shRNA targeting BCKDHA (shBCKDHA). CE After transfected with shBCKDHA or CON098, primary mouse hepatocytes were incubated with 100 μM 8-Br-cAMP for 16 h, mRNA expressions of three gluconeogenic enzymes were detected by RT-qPCR. FH mRNA levels of gluconeogenic genes in primary mouse hepatocytes transfected with shBCKDHA in the presence or absence of 200 μM BT2 treatment. Data are expressed as means ± SEM for three independent experiments. ***P < 0.001 vs control group.
Fig. 7
Fig. 7. BCKDK inhibition leads to the dissociation of CBP from CREB and destabilizes FOXO1 protein via promoting its ubiquitination.
A CRE promoter activity was detected in HepG2 cells treated with or without 100 μM 8-Br-cAMP and 200 μM BT2. B mRNA expression of PGC1α in primary mouse hepatocytes treated with 100 μM 8-Br-cAMP and 200 μM BT2. C Primary mouse hepatocytes were incubated with 100 μM 8-Br-cAMP and 200 μM BT2 for 1 h. The phosphorylation level of CREB was detected by western blot. D The interaction between CREB and CBP was detected in HepG2 cells by coimmunoprecipitation (CoIP). E Effect of BT2 on the interaction of CBP with CREB and FOXO1 in HepG2 cells. FG mRNA and protein expressions of FOXO1 in primary mouse hepatocytes treated with 100 μM 8-Br-cAMP and 200 μM BT2. H FOXO1 protein level in primary mouse hepatocytes treated with 200 μM BT2 and 10 μg/ml CHX for the indicated time in the presence of 100 μM 8-Br-cAMP. Signal intensity was quantified by image J software for statistical comparison. I FOXO1 protein level in primary mouse hepatocytes treated with 200 μM BT2 and 10 μM MG132 in the presence of 100 μM 8-Br-cAMP. J HepG2 cells co-expressed with Flag-tagged FOXO1 and HA-tagged ubiquitin were treated with 200 μM BT2 for 6 h. FOXO1 ubiquitination level was detected. Data are expressed as means ± SEM for three independent experiments. *P < 0.05, ***P < 0.001 vs corresponding control group.

References

    1. Petersen MC, Vatner DF, Shulman GI. Regulation of hepatic glucose metabolism in health and disease. Nat Rev Endocrinol. 2017;13:572–87. - PMC - PubMed
    1. Magnusson I, Rothman DL, Katz LD, Shulman RG, Shulman GI. Increased rate of gluconeogenesis in type II diabetes mellitus. A 13C nuclear magnetic resonance study. J Clin Invest. 1992;90:1323–7. - PMC - PubMed
    1. Petersen KF, Price T, Cline GW, Rothman DL, Shulman GI. Contribution of net hepatic glycogenolysis to glucose production during the early postprandial period. Am J Physiol. 1996;270:E186–E191. - PubMed
    1. Davis TA, Fiorotto ML, Reeds PJ. Amino-acid compositions of body and milk protein change during the suckling period in rats. J Nutr. 1993;123:947–56. - PubMed
    1. Felig P, Marliss E, Cahill GF. Plasma amino acid levels and insulin secretion in obesity. N Engl J Med. 1969;281:811–6. - PubMed

MeSH terms

Substances

LinkOut - more resources