. 2024 Oct 10;10(1):118.
doi: 10.1038/s41540-024-00447-0.

Systems profiling reveals recurrently dysregulated cytokine signaling responses in ER+ breast cancer patients' blood

Affiliations

Systems profiling reveals recurrently dysregulated cytokine signaling responses in ER+ breast cancer patients' blood

Brian Orcutt-Jahns et al. NPJ Syst Biol Appl. .

Abstract

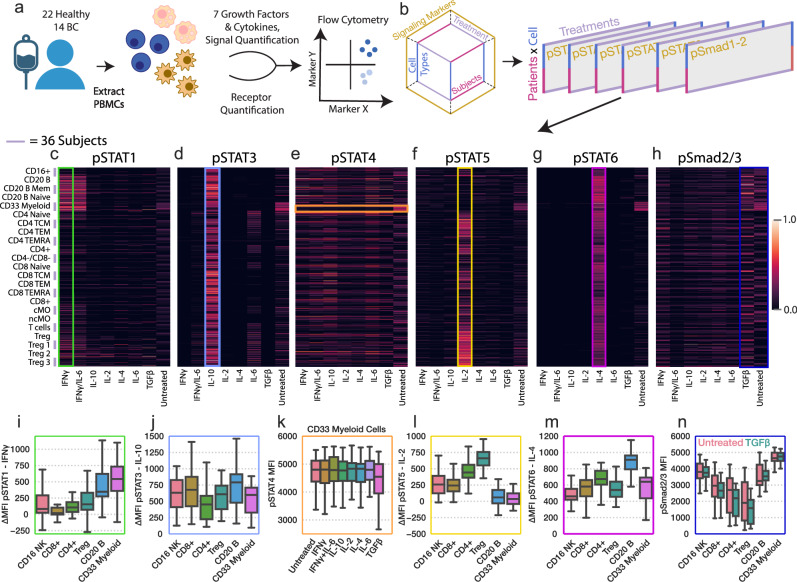
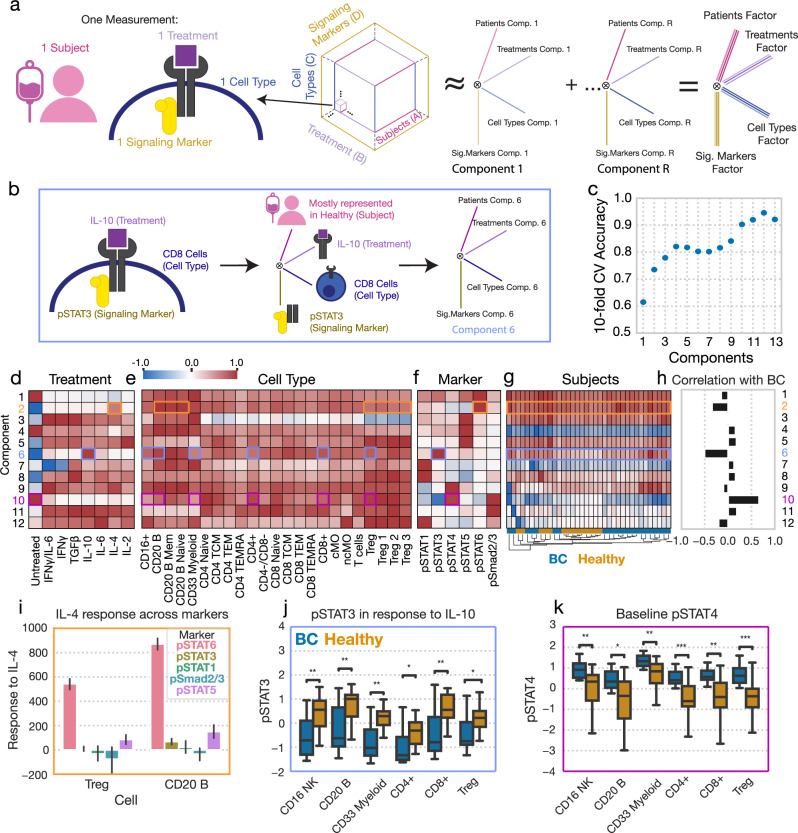
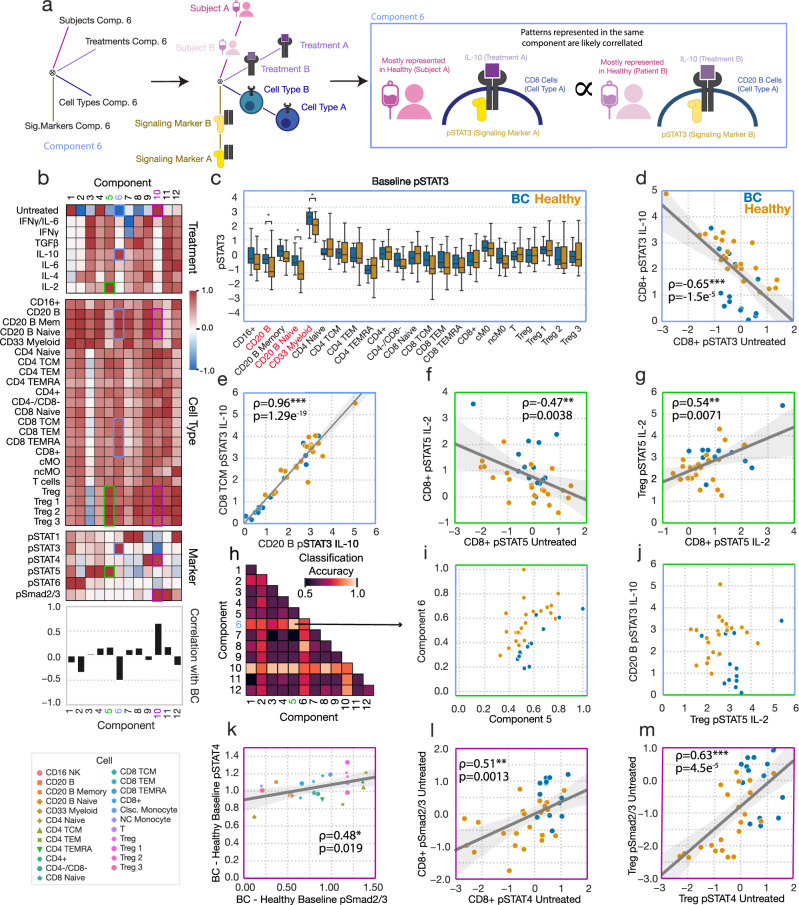
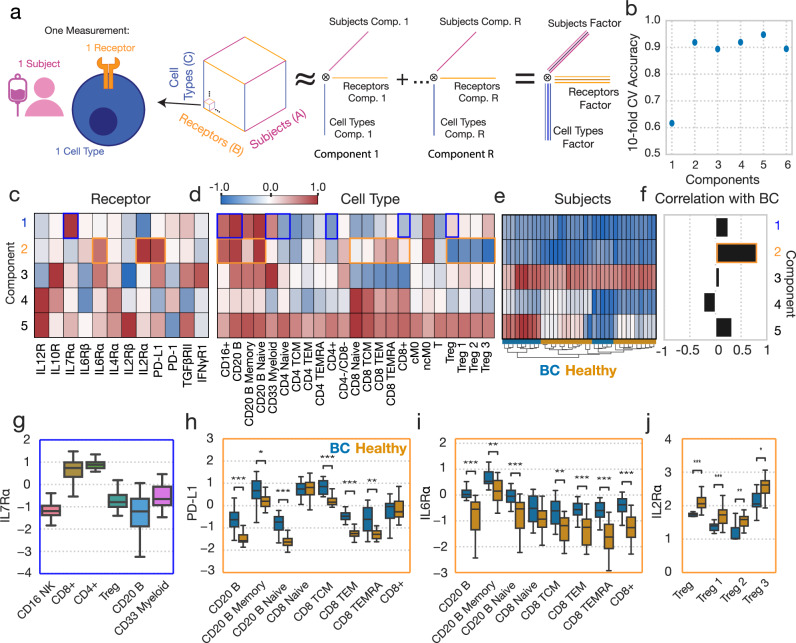
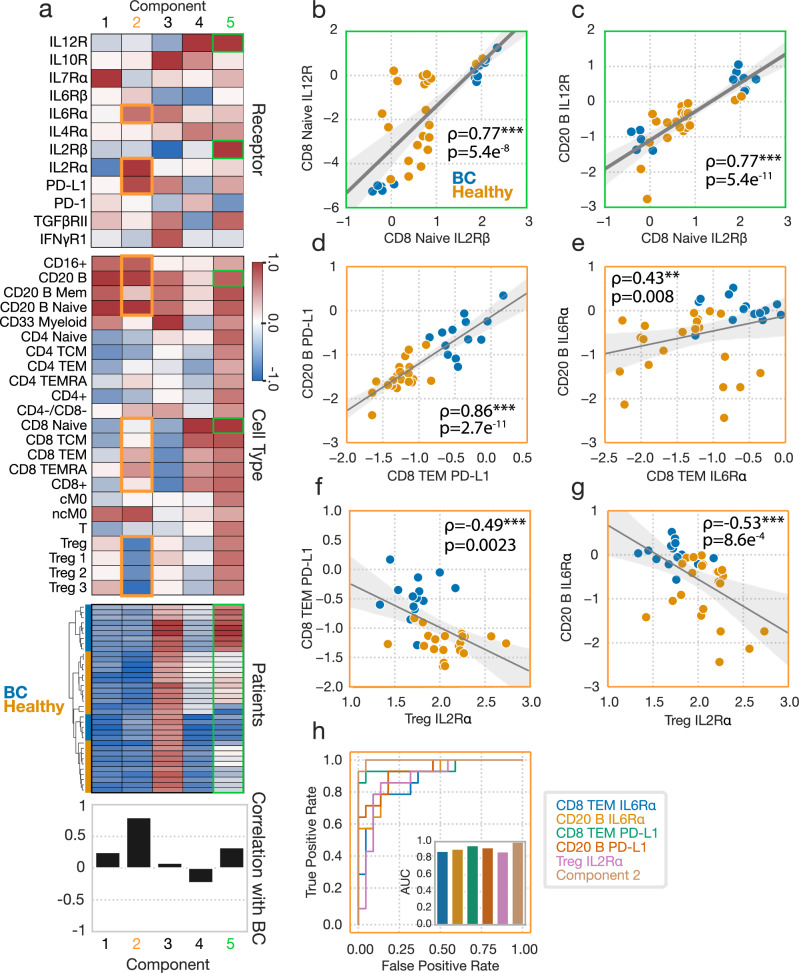
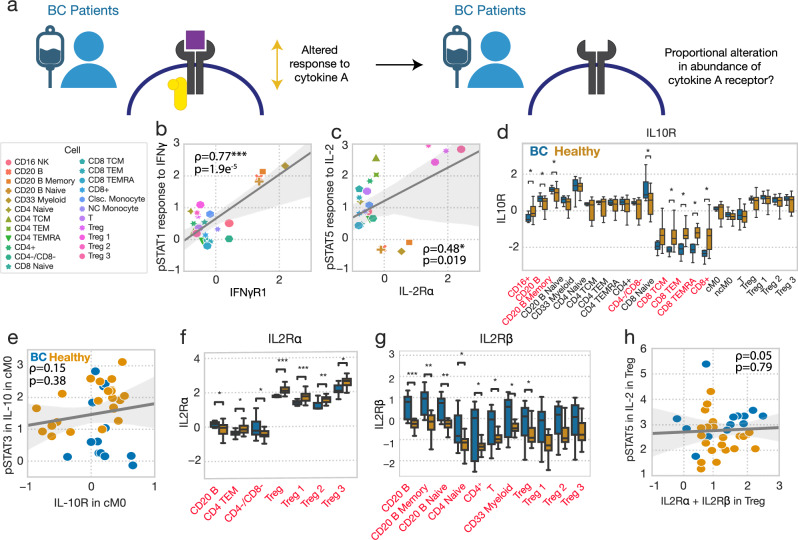
Cytokines operate in concert to maintain immune homeostasis and coordinate immune responses. In cases of ER+ breast cancer, peripheral immune cells exhibit altered responses to several cytokines, and these alterations are correlated strongly with patient outcomes. To develop a systems-level understanding of this dysregulation, we measured a panel of cytokine responses and receptor abundances in the peripheral blood of healthy controls and ER+ breast cancer patients across immune cell types. Using tensor factorization to model this multidimensional data, we found that breast cancer patients exhibited widespread alterations in response, including drastically reduced response to IL-10 and heightened basal levels of pSmad2/3 and pSTAT4. ER+ patients also featured upregulation of PD-L1, IL6Rα, and IL2Rα, among other receptors. Despite this, alterations in response to cytokines were not explained by changes in receptor abundances. Thus, tensor factorization helped to reveal a coordinated reprogramming of the immune system that was consistent across our cohort.


Conflict of interest statement

The authors declare no competing interests.

Figures

Fig. 1
Fig. 1. Systematically profiling PBMC cytokine signaling across several dimensions.
a Schematic of the experimental approach. Human PBMCs were harvested from the healthy and BC cohorts and subsequently treated with a panel of 7 cytokine/growth factor combinations. Response was quantified using 27-channel flow cytometry, through which the response of 23 different cell types was quantified. b Schematic of the dataset structure and how it was divided for visualization in (cf). Heatmap of phosphorylated STAT1 (c), STAT3 (d), STAT4 (e), STAT5 (f), STAT6 (g), and Smad2/3 (h) measurements for each treatment (X axis), and subject/cell type pair (Y axis). The signal was normalized to the maximum observed signal across subjects. Missing values were imputed for select subjects in response to TGFβ and the IFNγ/IL-6 combination ( ~ 10.4% of total measurements). Missing values are identified in Fig. S2. i pSTAT1 responses to IFNγ separated by cell type 9 (n = 36). j pSTAT3 responses to IL-10 separated by cell type. k pSTAT4 responses to each cytokine in CD33 myeloid cells. l pSTAT5 responses to IL-2 separated by cell type. m pSTAT6 responses to IL-4 separated by cell type. n pSMAD2/3 responses to TGFβ and at baseline, separated by cell type. For all box plots n = 36. For all box plots, the center line denotes the median, the box limits denote the upper and lower quartiles, and the whiskers denote the 1.5x interquartile range.
Fig. 2
Fig. 2. Canonical polyadic decomposition (CPD) of cytokine response identifies several patterns of cytokine response strongly associated with BC.
a Schematic of the CPD. The signaling data is organized into a four-dimensional tensor with axes for each subject, treatment, cell type, and signaling marker. This tensor is reduced into the sum of the outer products of vectors (components) associated with each dimension. b Schematic demonstrating the interpretation of a single component, component 6. c The accuracy of a logistic regression classifier upon tenfold cross-validation, using the CPD subject factors with varying numbers of components. (d-f) Component values for each treatment (d), cell type (e), and signaling marker (f). g A heatmap of the subject factor matrix, with the subjects hierarchically clustered. Subject status is indicated by the coloring along the bottom. h The univariate correlation of each subject component with BC status (healthy = 0, BC = 1). i Subject responses of each signaling marker to IL-4 in Tregs and B cells. Error bars in this figure represent standard deviation (n = 36). j pSTAT3 responses to IL-10 across cell types, separated by subject disease status (healthy n = 22, BC n = 14). k Baseline pSTAT4 across cell types, separated by subject disease status (healthy n = 22, BC n = 14). Components and their associated plots are denoted by their color. For all box plots, the center line denotes the median, the box limits denote the upper and lower quartiles, and the whiskers denote the 1.5x interquartile range. Significance was derived using the Mann–Whitney U test comparing those measurements from healthy donors to those of BC patients. *, **, and *** represent p values less than 0.05, 0.005, and 0.0005, respectively.
Fig. 3
Fig. 3. Alterations in immune signaling responsiveness in BC are more prominently reflected in coordinated patterns of signaling response changes.
a Schematic of showing how CPD factors can be used to discover coordinated patterns of response across data dimensions. b Cytokine response data factorization from Fig. 2. c Baseline pSTAT3 in untreated cells across cell types, separated by subject status. For this box plot, the center line denotes the median, the box limits denote the upper and lower quartiles, and the whiskers denote the 1.5x interquartile range. Significance was derived using the Mann–Whitney U test comparing those measurements from healthy donors to those of BC patients (healthy n = 22, BC n = 14). d Baseline pSTAT3 versus IL-10-induced pSTAT3 in CD8+ cells for each subject (n = 36). e pSTAT3 response to IL-10 in B cells versus CD8 TCM for each subject. f Baseline untreated versus IL-2-induced STAT5 phosphorylation in CD8+ cells for each subject. g IL-2-induced pSTAT5 in CD8+ cells versus Tregs for each subject. h Classification accuracy (tenfold CV) for logistic regression classifiers using all pairs of subject components. i Components 5 versus 6 across subjects from the CPD factorization in Fig. 2. j IL-2-induced pSTAT5 in Tregs versus IL-10-induced pSTAT3 in B cells. k The difference in average Smad2/3 phosphorylation between the BC and healthy cohorts versus the same quantity for STAT4 phosphorylation, plotted for each cell type (n = 23). (l, m) Baseline pSmad2/3 versus pSTAT4 across subjects in CD8+ (l) and Tregs (m) (n = 36). All reported correlations are Pearson correlations. Components and their associated plots are denoted by their color. *, **, and *** represent p values less than 0.05, 0.005, and 0.0005, respectively.
Fig. 4
Fig. 4. CPD reveals patterns of receptor abundance variation.
a Schematic of CPD. Receptor data is organized into a three-dimensional tensor with axes of subject, cell type, and receptor. This tensor is reduced into sum of the outer products of rank 1 tensors (components), allowing for easy visualization. b The accuracy of a logistic regression classifier upon tenfold cross-validation, using the CPD subject factors with varying numbers of components. (c, d) Component values for each receptor (c) and cell type (d). e A heatmap of the subject factor matrix, with the subjects hierarchically clustered. Subject status is indicated by the coloring along the bottom. f The univariate correlations of each component with subject disease status (healthy = 0, BC = 1). g IL7Rα response across cell types (n = 36). h PD-L1 abundance across cell types, separated by subject disease status (healthy n = 22, BC n = 14). i IL6Rα abundance across cell types, separated by subject disease status. j IL2Rα abundance across cell types, separated by subject disease status. For all box plots, the center line denotes the median, the box limits denote the upper and lower quartiles, and the whiskers denote the 1.5x interquartile range. Significance was derived using the Mann–Whitney U test comparing those measurements from healthy donors to those of BC patients. Components and their associated plots are denoted by their color. *, **, and *** represent p values less than 0.05, 0.005, and 0.0005, respectively.
Fig. 5
Fig. 5. Dissecting the patterns of receptor variation define concerted molecular programs.
a Receptor abundance data factorization from Fig. 4. b IL2Rβ versus IL12R abundances in CD8 naïve cells across subjects (n = 36). All reported correlations are Pearson correlations. c IL2Rβ abundances in CD8 naïve cells versus IL12R abundance in B cells for each subject. (b-e) Correlation across subjects between CD8 naïve IL2Rβ and IL12R (b), CD8 naïve IL6Rα and B cell IL6Ra (c), CD8 TEM PD-L1 and B cell PD-L1 (d), CD8 IL6Rα and CD20 B IL6Rα (e), Treg IL2Rɑ and CD8 TEM PD-L1 (f), and Treg IL2Rɑ and CD20 B IL6Rα (g). h ROC curve for the separation provided by several of the receptor amounts measurements, alongside component 2. AUC plots for each feature are also shown. Components and their associated plots are denoted by their color. *, **, and *** represent p values less than 0.05, 0.005, and 0.0005, respectively.
Fig. 6
Fig. 6. Receptor abundance defines cell type- but not BC-specific responses.
a Schematic demonstrating our approach to identifying whether subject-level changes in cytokine response can be explained by subject-level alterations in receptor abundance. b Average IFN-induced STAT1 phosphorylation versus IFNγR1 abundance across subjects for each cell type (n = 23). Induced responses are reported as z-scored delta MFI. All reported correlations are Pearson correlations. c Average IL-2-induced pSTAT5 versus IL2Rɑ abundance across subjects for each cell type. d IL10R abundance across cell types, grouped by subject status (healthy n = 22, BC n = 14). Cell types which feature statistically significant responses between BC and healthy status are listed in red. e IL-10-induced pSTAT3 versus IL10R abundance in classical monocytes, across subjects (n = 36). f IL2Rɑ abundance across cell types, grouped by subject status. g IL2Rβ abundance across cell types, grouped by subject status. Significance was derived using the Mann–Whitney U test, comparing those measurements from healthy donors to those of BC patients. Only cell types with significantly altered receptor abundances across cohorts were included in (f, g). h IL-2-induced pSTAT5 versus IL2Rɑ + IL2Rβ in Tregs for each subject. For all box plots, the center line denotes the median, the box limits denote the upper and lower quartiles, and the whiskers denote the 1.5x interquartile range. *, **, and *** represent p values less than 0.05, 0.005, and 0.0005, respectively.

Update of

References

    1. Lippitz, B. E. Cytokine patterns in patients with cancer: a systematic review. Lancet Oncol.14, e218–e228 (2013). - DOI - PubMed
    1. Wang, L. et al. IL6 signaling in peripheral blood T cells predicts clinical outcome in breast cancer. Cancer Res.77, 1119–1126 (2017). - DOI - PMC - PubMed
    1. Critchley-Thorne, R. J. et al. Impaired interferon signaling is a common immune defect in human cancer. Proc. Natl. Acad. Sci. USA106, 9010–9015 (2009). - DOI - PMC - PubMed
    1. Critchley-Thorne, R. J. et al. Down-regulation of the interferon signaling pathway in T lymphocytes from patients with metastatic melanoma. PLoS Med4, e176 (2007). - DOI - PMC - PubMed
    1. Wang, L. D. et al. Phosphoproteomic profiling of mouse primary HSPCs reveals new regulators of HSPC mobilization. Blood128, 1465–1474 (2016). - DOI - PMC - PubMed