. 2024 Oct 10;15(1):8792.
doi: 10.1038/s41467-024-53119-2.

A RANKL-UCHL1-sCD13 negative feedback loop limits osteoclastogenesis in subchondral bone to prevent osteoarthritis progression

Affiliations

A RANKL-UCHL1-sCD13 negative feedback loop limits osteoclastogenesis in subchondral bone to prevent osteoarthritis progression

Wenquan Liang et al. Nat Commun. .

Abstract

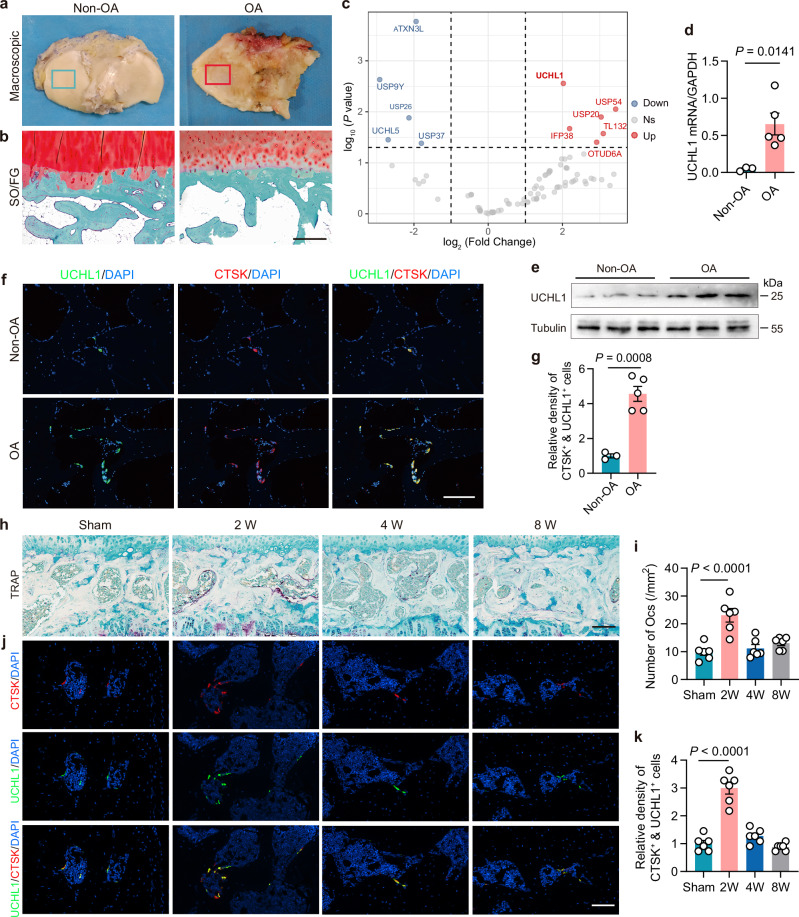
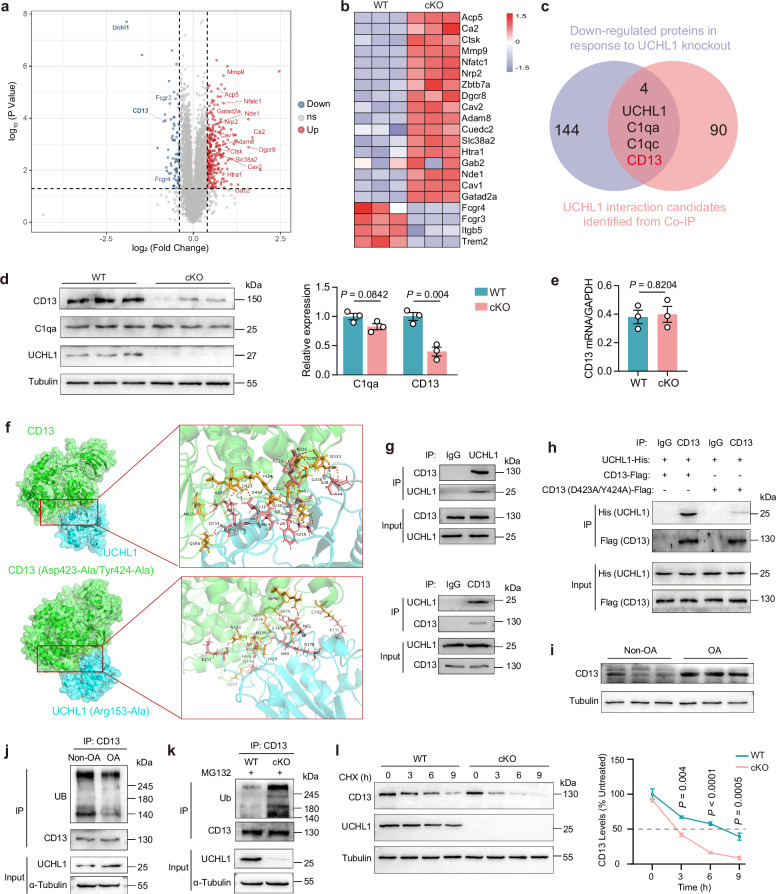
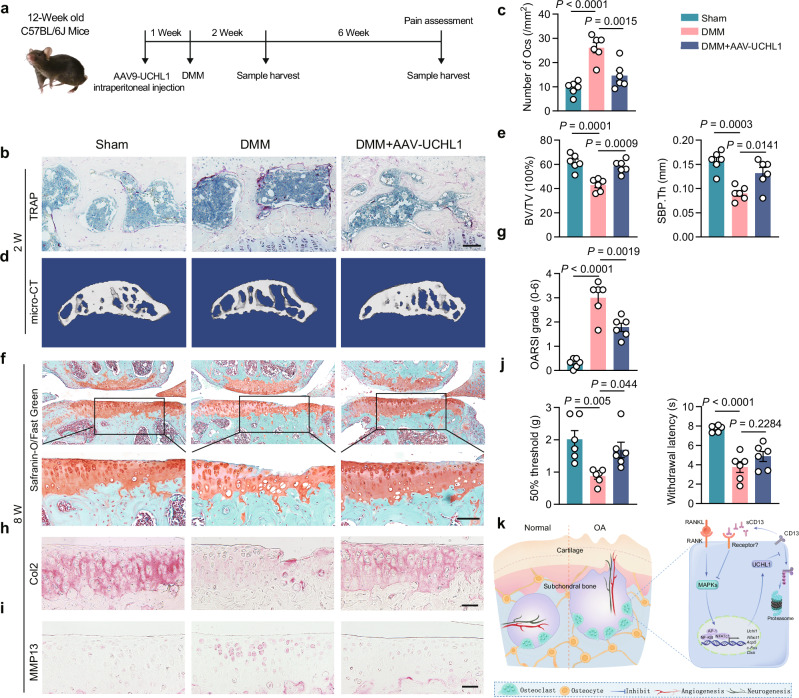
Abnormal subchondral bone remodeling plays a pivotal role in the progression of osteoarthritis (OA). Here, we analyzed subchondral bone samples from OA patients and observed a significant upregulation of ubiquitin carboxy-terminal hydrolase L1 (UCHL1) specifically in subchondral bone osteoclasts. Notably, we found a strong correlation between UCHL1 expression and osteoclast activity in the subchondral bone during OA progression in both human and murine models. Conditional UCHL1 deletion in osteoclast precursors exacerbated OA progression, while its overexpression, mediated by adeno-associated virus 9, alleviated this process in male mice. Mechanistically, RANKL stimulates UCHL1 expression in osteoclast precursors, subsequently stabilizing CD13, augmenting soluble CD13 (sCD13) release, and triggering an autocrine inhibitory effect on the MAPK pathway, thereby suppressing osteoclast formation. These findings unveil a previously unidentified negative feedback loop, RANKL-UCHL1-sCD13, that modulates osteoclast formation and presents a potential therapeutic target for OA.


Conflict of interest statement

The authors declare no competing interests.

Figures

Fig. 1
Fig. 1. UCHL1 upregulation associates with increased osteoclast activity in subchondral bone in human and mice with OA.
a Macroscopic images of tibia plateaus from OA patients and non-OA donors. b Safranin-O/fast green (SO/FG) staining of sagittal sections of the subchondral tibia in the OA patients and non-OA donors; showing proteoglycan (red) and bone (green). This experiment was repeated three times independently with similar results. Scale bar: 500 μm. c Volcano plot of PCR array analysis, demonstrating differentially expressed deubiquitinase genes in subchondral bone of 3 OA patients and 3 non-OA donors (fold-change >2, p < 0.05). Statistical analysis was performed using two-tailed unpaired Student’s t-test. High and low expression are denoted by red and blue, respectively. d, e mRNA and protein expression of UCHL1 in subchondral bone of OA patients and non-OA donors. n = 3, 5 individuals. f Immunofluorescence staining of CTSK and UCHL1 in subchondral bone of OA patients and non-OA donors. Scale bar: 200 μm. g Quantitative analysis of CTSK and UCHL1 double-positive cell intensity in subchondral bone of 3 OA patients and 5 non-OA donors. h TRAP staining of tibial subchondral bone (coronal view) at different time points after DMM surgery. Scale bar: 100 μm. i Quantitative analysis of TRAP-positive osteoclast density in subchondral bone (n = 6 mice per group). j Immunofluorescence staining of CTSK and UCHL1 in subchondral bone at different time points after DMM surgery. Scale bar: 100 μm. k Quantitative analysis of CTSK and UCHL1 double-positive cell intensity (n = 6 mice per group). All data are presented as mean ± SEM. Statistical analyzes utilized two-tailed unpaired Student’s t-test (c, d, g) and ANOVA with Tukey post hoc test for pairwise comparisons (i, k). OA, osteoarthritis; SO/FG, Safranin-O/fast green. Source data are provided as a Source Data file.
Fig. 2
Fig. 2. UCHL1 inhibits osteoclastogenesis in vitro.
a, b Ctsk, Acp5 and Uchl1 expression in BMMs during RANKL and M-CSF induced osteoclastogenesis (n = 3 independent cultures). c, d qPCR and immunoblot analysis of osteoclastogenic markers in WT and cKO BMMs cultured with RANKL and M-CSF (n = 3 independent cultures). e TRAP staining and quantitative analysis of BMMs from WT and cKO mice after 4 days of RANKL and M-CSF induction (n = 6 independent cultures). Scale bar: 500 μm. f Resorption analysis of BMMs from WT and cKO mice after 10 days of RANKL and M-CSF induction (n = 6 independent cultures). Scale bar: 200 μm. g EdU proliferation assay in BMMs from WT and cKO mice (n = 6 independent cultures). Scale bar: 50 μm. All data are presented as mean ± SEM. Statistical analysis employed two-tailed unpaired Student’s t-test (e, f, g) and two-way ANOVA with Tukey post hoc test for pairwise comparisons (c). Source data are provided as a Source Data file.
Fig. 3
Fig. 3. UCHL1 deletion in osteoclasts exacerbates DMM-induced OA progression in a mouse model.
a Experimental design schematic of DMM surgery in WT and cKO mice. b TRAP staining of the tibia subchondral bone (coronal view) 2 weeks after DMM surgery. Scale bar: 100 μm. c Quantitative analysis of TRAP-positive osteoclast density in subchondral bone (n = 5 mice per group). d 3D micro-CT images of the tibial subchondral bone medial compartment 2 weeks after DMM surgery. e Quantitative analysis of subchondral bone mass (BV/TV) and subchondral bone plate thickness (SBP.Th) (n = 5 mice per group). f Safranin-O/fast green staining of the tibial subchondral bone (coronal view) 8 weeks after DMM surgery. Scale bar: 100 μm. g OARSI grade of the tibial articular cartilage (n = 5 mice per group). h Representative images of Col2 immunohistochemistry in tibial articular cartilage at 8 weeks after DMM. Scale bar: 50 μm. i Representative images of MMP13 immunohistochemistry in tibial articular cartilage at 8 weeks after DMM. Scale bar: 20 μm. j Paw withdrawal threshold measured in the right hind paw at 8 weeks after DMM (n = 5 mice per group). All data are presented as mean ± SEM. Statistical analysis utilized two-way ANOVA with Tukey post hoc test for pairwise comparisons (c, e, g, j). The experiments in h, i were independently repeated five times with similar results. DMM, destabilized medial meniscus; OARSI, Osteoarthritis Research Society International; BV/TV, bone volume/total volume; SBP.Th, subchondral bone plate thickness. Source data are provided as a Source Data file.
Fig. 4
Fig. 4. UCHL1 interacts with CD13 and promotes CD13 protein stability through deubiquitination in preosteoclasts.
a Volcano plot illustrating the differential expression of proteins (DEPs) in BMMs from WT and cKO mice. Statistical analysis was performed using two-tailed unpaired Student’s t-test. DEPs increased by UCHL1 knockout are shown in red, while those decreased are denoted in blue. b Heat map presenting the DEPs associated with osteoclast function. c Strategy employed for the identification of substrate proteins, where downregulated proteins were compared with interacting proteins from the immunoprecipitation experiment. d Immunoblot and statistical analysis of CD13 and C1qa in BMMs from WT and cKO mice (n = 3 independent cultures). e Quantitative real-time PCR analysis of CD13 in BMMs from WT and cKO mice (n = 3 independent cultures). f Molecular docking model illustrating the interactions between wild-type UCHL1 and CD13 protein, as well as their respective mutants. Amino acids contributing to hydrogen bonds from UCHL1 (pink) and CD13 (brown) are denoted in one-letter code followed by their position in each chain. UCHL1 is depicted with a blue surface, while CD13 is illustrated with a green surface. g Co-immunoprecipitation of UCHL1 and CD13 in BMMs. h Co-immunoprecipitation of wild-type UCHL1 and mutated CD13 (D423A/Y424A) in BMMs. i Protein expression of CD13 in subchondral bone of 3 OA patients and 3 non-OA donors. j Ubiquitination of CD13 protein in subchondral bone of OA patients and non-OA donors. k Ubiquitination of CD13 protein in BMMs from WT and cKO mice. l Measurement of CD13 degradation in BMMs from WT and cKO mice (n = 3 independent cultures). All data are presented as mean ± SEM. Statistical analysis was performed using two-tailed unpaired Student’s t-test (a, d, e) and two-way ANOVA with Tukey post hoc test for pairwise comparisons (l). The experiments in g, h, and j, k were independently repeated at least three times with similar results. Source data are provided as a Source Data file.
Fig. 5
Fig. 5. UCHL1 suppresses osteoclastogenesis via rsCD13-mediated inhibition of the MAPK signaling pathway.
a Measurement of soluble CD13 (sCD13) secretion in BMM supernatants from WT and cKO mice using ELISA (n = 3 independent cultures). b, c TRAP staining and resorption analysis of BMMs from WT and cKO mice treated with overexpression AAV-UCHL1, mouse rsCD13, and siCD13. Scale bar: 200 μm. d, e Quantification of osteoclast number and resorption area in (b, c) (n = 4 independent cultures). f Quantitative real-time PCR analysis of osteoclastogenic markers in WT and cKO BMMs treated with overexpression AAV-UCHL1, mouse rsCD13, and siCD13 (n = 4 independent cultures). g Immunoblot analysis of rsCD13 on RANKL-stimulated signals in BMMs. h Immunoblot analysis of RANKL-stimulated signals in BMMs from WT and cKO mice treated with overexpression AAV-UCHL1, mouse rsCD13, and siCD13. i Immunoblot and statistical analysis of rsCD13 on RANKL-stimulated signals in BMMs treated with MAP2K1, MAP2K6, MAP2K7, and IKK2 overexpression plasmid (n = 3 independent cultures). All data are presented as mean ± SEM. Statistical analysis was performed using two-tailed unpaired Student’s t-test (a) and one-way ANOVA with Tukey post hoc test for pairwise comparisons (d, e, f, i). The experiments in g, h were independently repeated at least three times with similar results. rsCD13, recombinant sCD13; siCD13, CD13 siRNA. Source data are provided as a Source Data file.
Fig. 6
Fig. 6. UCHL1 overexpression alleviates DMM-induced OA progression in a mouse model.
a Schematic representation of the experimental design involving intraperitoneal injection of AAV9-UCHL1 into DMM mice. b TRAP staining of the tibia subchondral bone (coronal view) 2 weeks after DMM surgery. Scale bar: 100 μm. c Quantitative analysis of TRAP-positive osteoclast density in subchondral bone (n = 6 mice per group). d 3D micro-CT images of the tibial subchondral bone medial compartment 2 weeks after DMM surgery. e Quantitative analysis of subchondral bone volume (BV/TV) and SBP.Th (n = 6 mice per group). f Safranin-O/fast green staining of the tibial subchondral bone (coronal view) 8 weeks after DMM surgery. Scale bar: 100 μm. g OARSI grade of tibia articular cartilage (n = 6 mice per group). h Representative images of Col2 immunohistochemistry in tibial articular cartilage at 8 weeks after DMM. Scale bar: 50 μm. i Representative images of MMP13 immunohistochemistry in tibial articular cartilage at 8 weeks after DMM. Scale bar: 20 μm. j Paw withdrawal threshold measured in the right hind paw at 8 weeks after DMM (n = 6 mice per group). k Schematic model of the RANKL-UCHL1-sCD13 negative feedback loop in OA development. In osteoclast precursor cells, RANKL induction leads to UCHL1 expression, subsequently stabilizing CD13, increasing sCD13 release, and triggering autocrine inhibition of the MAPK signaling pathway, thereby suppressing osteoclastogenesis. Consequently, UCHL1 deletion in preosteoclasts promotes osteoclastogenesis and OA progression. Conversely, UCHL1 overexpression can reverse the DMM-induced OA phenotypes. All data are presented as mean ± SEM. Statistical analysis was performed using one-way ANOVA with Tukey post hoc test for pairwise comparisons (c, e, g, j). The experiments in h, i were independently repeated six times with similar results. OA, osteoarthritis. DMM, destabilized medial meniscus; OARSI, Osteoarthritis Research Society International; BV/TV, bone volume/total volume; SBP.Th, subchondral bone plate thickness. Source data are provided as a Source Data file.

Similar articles

Cited by

References

    1. Hunter, D. J. & Bierma-Zeinstra, S. Osteoarthritis. The Lancet393, 1745–1759 (2019). - PubMed
    1. Disease, G. B. D., Injury, I. & Prevalence, C. Global, regional, and national incidence, prevalence, and years lived with disability for 354 diseases and injuries for 195 countries and territories, 1990-2017: a systematic analysis for the Global Burden of Disease Study 2017. Lancet392, 1789–1858 (2018). - PMC - PubMed
    1. Latourte, A., Kloppenburg, M. & Richette, P. Emerging pharmaceutical therapies for osteoarthritis. Nature reviews. Rheumatology16, 673–688 (2020). - PubMed
    1. Reichenbach, S. et al. Effect of biomechanical footwear on knee pain in people with knee osteoarthritis: the BIOTOK randomized clinical trial. Jama323, 1802–1812 (2020). - PMC - PubMed
    1. Katz, J. N., Arant, K. R. & Loeser, R. F. Diagnosis and treatment of hip and knee osteoarthritis: a review. Jama325, 568–578 (2021). - PMC - PubMed

Publication types

MeSH terms