. 2024 Oct 10;14(1):23701.
doi: 10.1038/s41598-024-74002-6.

Dysbiotic signatures and diagnostic potential of gut microbial markers for inflammatory bowel disease in Korean population

Affiliations

Dysbiotic signatures and diagnostic potential of gut microbial markers for inflammatory bowel disease in Korean population

Hyun Sik Kim et al. Sci Rep. .

Abstract

Fecal samples were collected from 640 individuals in Korea, including 523 patients with IBD (223 with Crohn's disease [CD] and 300 with ulcerative colitis [UC]) and 117 healthy controls. The samples were subjected to cross-sectional gut metagenomic analysis using 16 S rRNA sequencing and bioinformatics analysis. Patients with IBD, particularly those with CD, exhibited significantly lower alpha diversities than the healthy subjects. Differential abundance analysis revealed dysbiotic signatures, characterized by an expansion of the genus Escherichia-Shigella in patients with CD. Functional annotations showed that functional pathways related to bacterial pathogenesis and production of hydrogen sulfide (H2S) were strongly upregulated in patients with CD. A dysbiosis score, calculated based on functional characteristics, highly correlated with disease severity. Markers distinguishing between healthy subjects and patients with IBD showed accurate classification based on a small number of microbial taxa, which may be used to diagnose ambiguous cases. These findings confirm the taxonomic and functional dysbiosis of the gut microbiota in patients with IBD, especially those with CD. Taxa indicative of dysbiosis may have significant implications for future clinical research on the management and diagnosis of IBD.


Conflict of interest statement

The authors declare no competing interests.

Figures

Fig. 1
Fig. 1
Inclusion and exclusion criteria for selecting healthy subjects and standard values for each test item. Detailed selection criteria for non-IBD healthy subjects are described in the healthy participants subsection of the section on enrollment of study participants in the supplementary text file. AKI, acute kidney injury; ALT, alanine aminotransferase; AST, aspartate aminotransferase; BSS, Bristol stool scale; BUN, blood urea nitrogen; CKD, chronic kidney disease; DBP, diastolic blood pressure; HDL, high-density lipoprotein; LDL, low-density lipoprotein; RBC, red blood cell; SBP, systolic blood pressure; WBC, white blood cell.
Fig. 2
Fig. 2
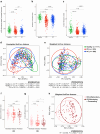
Diversity of the gut microbiota in healthy subjects, in patients with CD, and in patients with UC. (a–c) Comparisons of the alpha-diversity indices among the three patient groups. The intra-individual bacterial diversity within the samples was measured by determining (a) the abundance-based coverage estimator (ACE) for species richness, (b) Shannon’s evenness index for species evenness, and (c) inverse Simpson’s index for community diversity. The alpha-diversity values for each group are presented as box plots. The lines, boxes, and whiskers in the box plots represent the median, 25th and 75th percentiles, and the minimum-to-maximum distributions of replicate values, respectively. (d–e) PCoA, based on the (d) unweighted and (e) weighted UniFrac distance matrix, of the bacterial 16 S rRNA gene sequence data for fecal samples from healthy subjects (n = 117), patients with CD (n = 223), and patients with UC (n = 300). (f–g) Differences in alpha diversity according to disease behavior types (inflammatory, stricturing, and penetrating) in the CD group are presented as (f) richness and (g) evenness. (h) PCoA, based on the weighted UniFrac distance matrix, of the bacterial 16 S rRNA gene sequence data for fecal samples is shown according to the disease behavior types (general vs. advanced types) in patients with CD (n = 223). The data were analysed using the Kruskal-Wallis test (a, b, c, f, and g) and PERMANOVA, with 999 permutations (de) to obtain the statistical significance. CD, Crohn’s disease; UC, ulcerative colitis; PCoA, Principal coordinate analysis; CD-Inflammatory, inflammatory type of CD; CD-Stricturing + Penetrating, stricturing and penetrating types of CD.
Fig. 3
Fig. 3
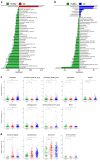
Differentially abundant genera in the healthy subjects, patients with CD, and patients with UC. (a–b) Differentially abundant genera in (a) patients with CD and (b) with UC compared with those in healthy subjects. Only significant taxa (FDR < 0.01) are shown. The FDR values were based on multivariable generalized linear regression model analyses adjusted for stool consistency, age, sex, body mass index, smoking and alcohol consumption, and disease activity of IBD. Numerical values indicate coefficients. (c) Relative abundance of the genera enriched in healthy subjects compared with those in patients with CD and UC. (d) Relative abundance of genera enriched in patients with CD and patients with UC compared with those in healthy subjects. The relative abundances of differentially abundant genera for each group are presented as box plots. The lines, boxes, and whiskers in the box plots represent the median, 25th and 75th percentiles, and the minimum-to-maximum distributions of replicate values, respectively. (cd) *P < 0.05, **P < 0.01, and ***P < 0.001 using the Kruskal-Wallis test. CD, Crohn’s disease; UC, ulcerative colitis.
Fig. 4
Fig. 4
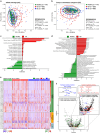
Gut microbial functional pathways and functional feature profiles in healthy subjects, patients with CD, and patients with UC. (ab) PCoA, showing the abundance of functional genes in each sample by groups based on (a) KEGG orthologs (KOs) and (b) enzyme commission categories (ECs) predicted using taxa abundance profiles and genome information. (c–d) Predicted (c) KEGG and (d) MetaCyc metabolic pathways differing significantly in patients with CD and healthy subjects. The FDR values were based on a multivariable generalized linear regression model adjusted for stool consistency, age, sex, body mass index, smoking and alcohol consumptions, and disease activity of IBD. Only significant pathways (FDR < 0.01) are shown. Numerical values indicate coefficients. (e) Heatmap representing KEGG pathways related to sulfur metabolism in patients with CD and healthy subjects, based on significantly different KO abundances in these two groups. Positive z-scores are shown in red color, and negative z-scores are shown in blue. f Volcano plot representing KOs related to sulfur metabolism and sulfur relay system, based on significantly different KO abundances in patients with CD and healthy subjects. KOs related to pathways for producing cysteine ​​from taurine are shown in red, and KOs related to pathways for producing H2S from cysteine are shown in blue. Statistical significance was determined using PERMANOVA based on 999 permutations (ab). CD, Crohn’s disease; UC, ulcerative colitis; KEGG, Kyoto Encyclopedia of Genes and Genomes; PCoA, Principal coordinate analysis.
Fig. 5
Fig. 5
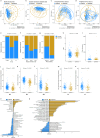
Evaluation of dysbiosis based on functional feature profiles. (a) PCoA schematizing eubiosis and dysbiosis samples based on KEGG ortholog profiles. (b) PCoA schematizing eubiosis and dysbiosis samples based on enzyme commission category profiles. (c–d) PCoA plots according to eubiosis and dysbiosis groups of bacterial 16 S rRNA gene sequences based on (c) unweighted and (d) weighted UniFrac distance matrices. (e) Distribution of dysbiosis and eubiosis samples within groups of healthy subjects, patients with CD, and patients with UC. (f) Distribution of dysbiosis and eubiosis samples according to disease behavior in patients with CD. (g) Distribution of dysbiosis and eubiosis samples according to ANCA positivity in the disease group. (h–i) WBC counts (h) and ((i) fecal calprotectin levels between eubiosis and dysbiosis groups in the disease group. (j–l) Comparisons of alpha-diversity indices in the eubiosis and dysbiosis groups. Intra-individual bacterial diversity within samples was determined by measuring (j) the abundance-based coverage estimator (ACE) for species richness, (k) Shannon’s evenness index for species evenness, and (l) inverse Simpson’s index for community diversity. (m–n) Abundance-based coverage estimator for species richness in the eubiosis and dysbiosis groups of patients with (m) CD and (n) UC. Alpha-diversity values for each group are presented as box plots. The lines, boxes, and whiskers in the box plots represent the median, 25th and 75th percentiles, and minimum-to-maximum distributions of replicate values, respectively. (o Differentially abundant genera in the eubiosis and dysbiosis groups. (p) Predicted KEGG metabolic pathways differing significantly in the eubiosis and dysbiosis groups. Only significant taxa (false discovery rate [FDR] < 0.01) are indicated. Numerical values indicate coefficients. Statistical significance was analyzed using Chi-square tests (eg), Wilcoxon rank sum pairwise comparison tests (hn), and PERMANOVA, with 999 permutations (ad). CD, Crohn’s disease; UC, ulcerative colitis; PCoA, Principal coordinate analysis; Infla, inflammatory type in CD patient group; Penet, penetrating type in CD patient group; Strict, stricturing type in CD patient group; ANCA positivity, positivity rate of perinuclear anti-neutrophil cytoplasmic antibody; WBC, whole blood cell.
Fig. 6
Fig. 6
Evaluation of the performance of microbial markers in distinguishing among healthy subjects, patients with CD, and patients with UC using differentially abundant genera. (a) Optimal number of genus markers in a random forest model based on classification errors comparing healthy subjects and patients with IBD. (b) The importance of marker candidates evaluated in the training process of the random forest model in comparisons of healthy subjects and patients with IBD. (c) Classification ability of the random forest model trained with the two genera selected as markers in distinguishing between healthy subjects and patients with IBD. (d) Optimal number of genus markers in a random forest model based on classification errors comparing healthy subjects and patients with CD. (e) The importance of marker candidates evaluated in the training process of the random forest model in comparisons of healthy subjects and patients with CD. (f) Classification ability of the random forest model trained with the two genera selected as markers in distinguishing between healthy subjects and patients with CD. (g) Optimal number of genus markers in a random forest model based on classification errors comparing healthy subjects and patients with UC. (h) The importance of marker candidates evaluated in the training process of the random forest model in comparisons of healthy subjects and patients with UC. (i Classification ability of the random forest model trained with the three genera selected as markers in distinguishing between healthy subjects and patients with UC. (j) Optimal number of genus markers in a random forest model based on classification errors comparing patients with CD group and patients with UC. (k) The importance of marker candidates evaluated in the training process of the random forest model in comparisons of patients with CD and patients with UC. (l) Classification ability of the random forest model trained with the three genera selected as markers in distinguishing between patients with CD and patients with UC. (a, d, g, and j) The red arrows indicate the optimal number of genus markers in the random forest models. (b, e, h, and k) The genera marked with a star in the shaded area indicated by the red dotted line are the taxa contributing to the highest level of classification accuracy. The classification power of the random forest model trained by applying the optimal number of markers was evaluated by calculating AUROC. CD, Crohn’s disease; UC, ulcerative colitis; OOB Error, out-of-bag error; AUROC, Area Under the Receiver Operating Characteristic curve.

References

    1. Lee, M. & Chang, E. B. Inflammatory bowel diseases (IBD) and the microbiome-searching the crime scene for clues. Gastroenterology160, 524–537 (2021). - PMC - PubMed
    1. Yilmaz, B. et al. Microbial network disturbances in relapsing refractory Crohn’s disease. Nat. Med.25, 323 (2019). - PubMed
    1. Lloyd-Price, J. et al. Multi-omics of the gut microbial ecosystem in inflammatory bowel diseases. Nature569, 655 (2019). - PMC - PubMed
    1. Abdel-Rahman, L. I. H. & Morgan, X. C. Searching for a consensus among inflammatory bowel disease studies: A systematic meta-analysis. Inflamm. Bowel Dis.29, 125–139 (2023). - PMC - PubMed
    1. Halfvarson, J. et al. Dynamics of the human gut microbiome in inflammatory bowel disease. Nat. Microbiol.2 (2017). - PMC - PubMed

MeSH terms

LinkOut - more resources