. 2024 Oct 10;14(1):23654.
doi: 10.1038/s41598-024-73796-9.

Protein biomarker signatures of preeclampsia - a longitudinal 5000-multiplex proteomics study

Affiliations

Protein biomarker signatures of preeclampsia - a longitudinal 5000-multiplex proteomics study

Maren-Helene Langeland Degnes et al. Sci Rep. .

Abstract

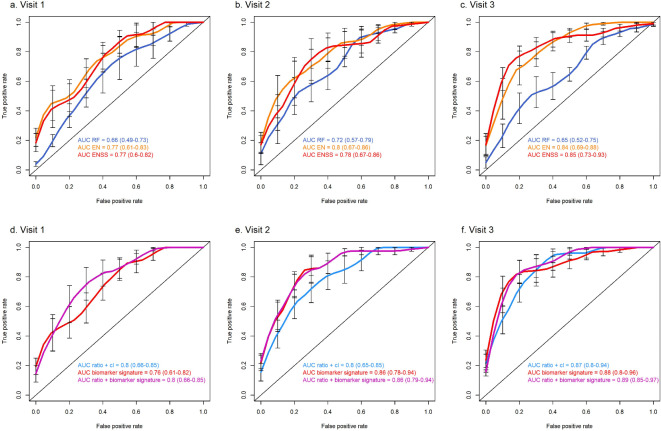
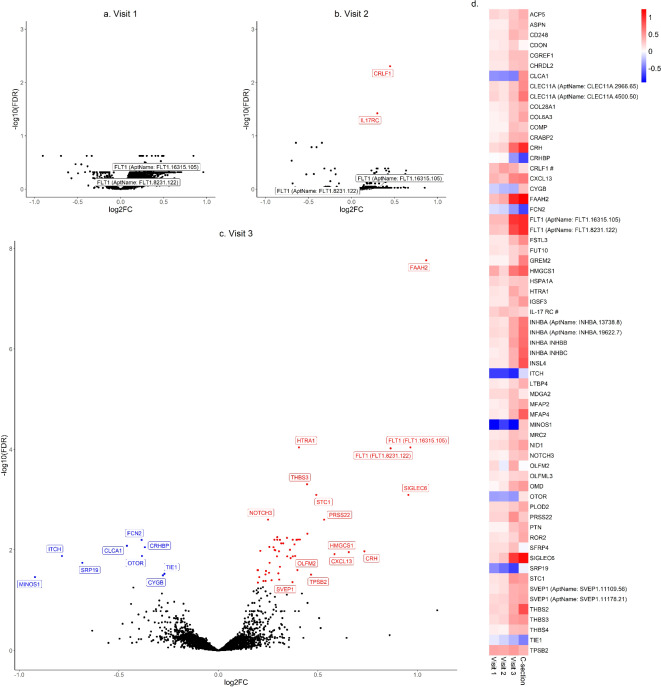
We aimed to explore novel biomarker candidates and biomarker signatures of late-onset preeclampsia (LOPE) by profiling samples collected in a longitudinal discovery cohort with a high-throughput proteomics platform. Using the Somalogic 5000-plex platform, we analyzed proteins in plasma samples collected at three visits (gestational weeks (GW) 12-19, 20-26 and 28-34 in 35 women with LOPE (birth ≥ 34 GW) and 70 healthy pregnant women). To identify biomarker signatures, we combined Elastic Net with Stability Selection for stable variable selection and validated their predictive performance in a validation cohort. The biomarker signature with the highest predictive performance (AUC 0.88 (95% CI 0.85-0.97)) was identified in the last trimester of pregnancy (GW 28-34) and included the Fatty acid amid hydrolase 2 (FAAH2), HtrA serine peptidase 1 (HTRA1) and Interleukin-17 receptor C (IL17RC) together with sFLT1 and maternal age, BMI and nulliparity. Our biomarker signature showed increased or similar predictive performance to the sFLT1/PGF-ratio within our data set, and we were able to validate the biomarker signature in a validation cohort (AUC ≥ 0.90). Further validation of these candidates should be performed using another protein quantification platform in an independent cohort where the negative and positive predictive values can be validly calculated.


Conflict of interest statement

The authors declare no competing interests.

Figures

Fig. 1
Fig. 1
Overview of methods used to identify protein biomarker candidates of late onset preeclampsia (LOPE). Our longitudinal study includes prediction models that identify biomarker signatures of LOPE and a differential abundance analysis between LOPE and controls at each of the three visits. GW = gestational week, CV = cross-validation. Figure made in PowerPoint with pictures imported from BioRender.com (arm and microarray).
Fig. 2
Fig. 2
Pipeline of prediction, identification and validation of biomarker signatures (BMS in the figure) of LOPE (late-onset preeclampsia).(a) We compared statistical machine learning models to predict LOPE: the penalized logistic elastic net (EN) model and the decision-tree-based random forest (RF). Input was de-trended data, including all proteins, and we ran 5-fold cross-validation (CV) to obtain performance per visit. The performance per CV-fold of each of the two machine learning models was displayed by the receiver operating characteristic (ROC) curve (AUC) values. To obtain stable and sparse biomarker signatures, we combined EN with stability selection (ENSS), with BMI, age and parity as mandatory covariates. Proteins selected by ENSS were further included in logistic regression models, and the performance per fold was displayed in ROC curves and AUC values. (b) The final biomarker signature was obtained using ENSS on all samples and logistic regression (meaning no CV). (c) We obtained prediction performance of our new biomarker signatures and the sFLT1/PGF-ratio as well as the combination between these two at each visit. (d) We validated the biomarker signature’s prediction performance at the third visit in a second cohort. logreg = logistic regression model; ML = machine learning model; BMS = biomarker signature.
Fig. 3
Fig. 3
(a-c) show the prediction performances from 5-fold cross-validation. Performance of three statistical learning models: random forest (RF), elastic net (EN) and elastic net with stability selection (ENSS) from the 5-fold cross-validation at (a) visit 1, (b) visit 2 and (c) visit 3. The highest performing model (ENSS) was used to identify the biomarker signatures per visit. D-f show the performance of the logistic regression models including the biomarker signatures selected by ENSS at each visit (red curve) compared to the sFLT1/PGF ratio plus clinical variables (light blue curve) and the combination of ratio and biomarker signatures (purple curve) at (d) visit 1, (e) visit 2 and (f) visit 3 from the 5-fold cross-validation. Biomarker signatures (proteins and clinical variables) selected by ENSS per visit are given in Fig. 4. In (d) the light blue line is identical to the purple line because the biomarker signature at visit 1 consists of the clinical variables only. The bars indicate the standard error from the 5-fold cross-validation. Performance are given in receiver operator characteristic (ROC) curves and area under the ROC curve (AUC) with 95% confidence intervals in parentheses.
Fig. 4
Fig. 4
Heat map of the proteins selected as stable to predict LOPE in the ENSS model at each visit. Colors indicate the probability of a protein being selected by ENSS. Probability cutoff was set to 0.6 (default). The two sFLT1s represent the same protein but are measured by two different aptamers (as mentioned in the Materials and Methods section). BMI, age and nulliparity were set as mandatory variables and hence have a selection probability of 1.
Fig. 5
Fig. 5
Volcano plot from illustrating the differential abundance test results from (a) Visit 1 (b) Visit 2 and (c) Visit 3. (d) Log2 fold changeFC of proteins with differential abundances between groups at visits 2 and 3, shown across all visits plus at cesarean section in the validation cohort. The two differentially abundant proteins from visit 2 are indicated with #. Proteins with the same Entrez Gene symbol have the aptamer ID added.
Fig. 6
Fig. 6
Tree plots showing statistically significantly overrepresented gene ontologies (a) biological processes and (b) molecular functions among the 59 differentially abundant proteins at visit 3. Ontologies are clustered based on Jaccard’s similarity index. The cluster names in the tree-plot indicate which of the top four words each cluster shares.
Fig. 7
Fig. 7
Overlap between the review of Navajas et al. and the current study. Proteins as biomarker candidates of PE in any of the included studies (Navajas), proteins marked as biomarker candidates in third trimester (Navajas 3 trim) and the differentially abundant proteins in the current study: the 58 unique Entrez Gene symbol names (Current study 3 trim LOPE). Proteins marked as biomarker candidates in third trimester were mostly (96%) markers of PE in general (according to Navajas et al.), not specifically for LOPE (2%) or EOPE (1%).

References

    1. Lisonkova, S. & Joseph, K. S. Incidence of preeclampsia: risk factors and outcomes associated with early- versus late-onset disease. Am J Obstet Gynecol 209, 544 e541-544 e512, doi: (2013). 10.1016/j.ajog.2013.08.019 - PubMed
    1. Holme, A. M., Roland, M. C., Henriksen, T. & Michelsen, T. M. In vivo uteroplacental release of placental growth factor and soluble fms-like tyrosine kinase-1 in normal and preeclamptic pregnancies. Am. J. Obstet. Gynecol.215, 782. .e781-782.e789 (2016). - PubMed
    1. Stepan, H., Hund, M. & Andraczek, T. Combining biomarkers to predict pregnancy complications and redefine Preeclampsia. Hypertension. 75, 918–926. 10.1161/HYPERTENSIONAHA.119.13763 (2020). - PMC - PubMed
    1. Chau, K., Hennessy, A. & Makris, A. Placental growth factor and pre-eclampsia. J. Hum. Hypertens.31, 782–786. 10.1038/jhh.2017.61 (2017). - PMC - PubMed
    1. Zeisler, H. et al. Predictive value of the sFlt-1:PlGF ratio in women with suspected Preeclampsia. N. Engl. J. Med.374, 13–22. 10.1056/NEJMoa1414838 (2016). - PubMed

LinkOut - more resources