. 2024 Oct 10;4(1):197.
doi: 10.1038/s43856-024-00606-8.

Predicting future hospital antimicrobial resistance prevalence using machine learning

Affiliations

Predicting future hospital antimicrobial resistance prevalence using machine learning

Karina-Doris Vihta et al. Commun Med (Lond). .

Abstract

Background: Predicting antimicrobial resistance (AMR), a top global health threat, nationwide at an aggregate hospital level could help target interventions. Using machine learning, we exploit historical AMR and antimicrobial usage to predict future AMR.

Methods: Antimicrobial use and AMR prevalence in bloodstream infections in hospitals in England were obtained per hospital group (Trust) and financial year (FY, April-March) for 22 pathogen-antibiotic combinations (FY2016-2017 to FY2021-2022). Extreme Gradient Boosting (XGBoost) model predictions were compared to the previous value taken forwards, the difference between the previous two years taken forwards and linear trend forecasting (LTF). XGBoost feature importances were calculated to aid interpretability.

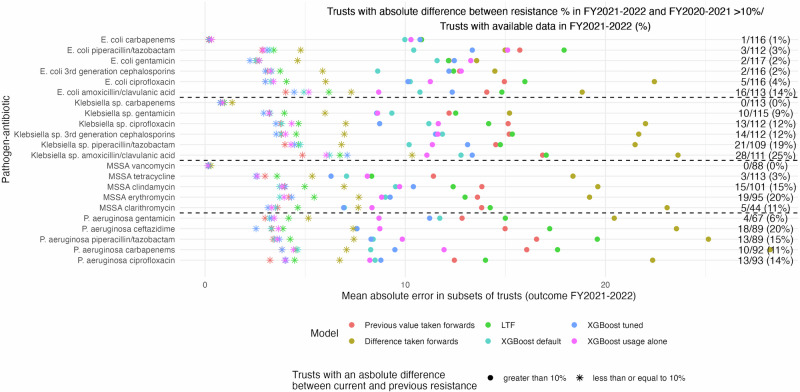
Results: Here we show that XGBoost models achieve the best predictive performance. Relatively limited year-to-year variability in AMR prevalence within Trust-pathogen-antibiotic combinations means previous value taken forwards also achieves a low mean absolute error (MAE), similar to or slightly higher than XGBoost. Using the difference between the previous two years taken forward or LTF performs consistently worse. XGBoost considerably outperforms all other methods in Trusts with a larger change in AMR prevalence from FY2020-2021 (last training year) to FY2021-2022 (held-out test set). Feature importance values indicate that besides historical resistance to the same pathogen-antibiotic combination as the outcome, complex relationships between resistance in different pathogens to the same antibiotic/antibiotic class and usage are exploited for predictions. These are generally among the top ten features ranked according to their mean absolute SHAP values.

Conclusions: Year-to-year resistance has generally changed little within Trust-pathogen-antibiotic combinations. In those with larger changes, XGBoost models can improve predictions, enabling informed decisions, efficient resource allocation, and targeted interventions.

Plain language summary

Antibiotics play an important role in treating serious bacterial infections. However, with the increased usage of antibiotics, they are becoming less effective. In our study, we use machine learning to learn from past antibiotic resistance and usage in order to predict what resistance will look like in the future. Different hospitals across England have very different resistance levels, however, within each hospital, these levels remain stable over time. When larger changes in resistance occurred over time in individual hospitals, our methods were able to predict these. Understanding how much resistance there is in hospital populations, and what may occur in the future can help determine where resources and interventions should be directed.


Conflict of interest statement

The authors declare the following competing interests: D.W.E. declares lecture fees from Gilead, outside the submitted work. Authors K.-D.V., E.P., K.B.P., S.H., R.L.G., K H., D.C., R.H., B.M.-P., A.S.W., D.C. declare no competing interests.

Figures

Fig. 1
Fig. 1. Mean resistance prevalence and standard deviation per Trust–pathogen–antibiotic.
Distribution of mean resistance prevalence (a) and standard deviation (b) per Trust–pathogen–antibiotic across available financial years (Apr2016–Mar2022 for E. coli and MSSA and Apr2017–Mar2022 for Klebsiella sp. and P. aeruginosa). n = 119 Trusts, however not all Trusts contributed data to each boxplot (Supplementary Table 2). Red (E. coli), green (Klebsiella sp.), blue (MSSA), purple (P. aeruginosa). Note: one point per Trust. Outliers outside of the x-axis scale (>50 left panel, >10 right panel) were truncated. Centre line, median; box limits, upper and lower quartiles; whiskers, 1.5× interquartile range.
Fig. 2
Fig. 2. Difference in resistance prevalence between the current and previous financial year and estimated change over the study period.
Distribution of difference in resistance prevalence between the current and previous financial year (a) and LTF estimated change over the study period (b), per pathogen–antibiotic combination across all Trusts and financial years. Percentages of Trust-FYs that have an absolute difference <5%, <7.5% and <10% between the current and the previous financial year are also given by pathogen–antibiotic combination (a), and an absolute LTF estimated change <5%, <7.5% and <10% (b). n = 119 Trusts × 5 FY-to-FY differences (E. coli and MSSA) and 4 FY-to-FY differences (Klebsiella sp. and P. aeruginosa), however not all Trusts contributed data to each boxplot (Supplementary Table 2). Red (E. coli), green (Klebsiella sp.), blue (MSSA), purple (P. aeruginosa). Note: one point per trust year. Distribution split by financial year available in Supplementary Fig. 3. Percentage of trusts with an absolute difference in resistance prevalence <5%, <7.5%, and <10% split by financial year in Supplementary Fig. 4. Outliers outside of x-axis scale (absolute value > 20) were truncated. Centre line, median; box limits, upper and lower quartiles; whiskers, 1.5× interquartile range.
Fig. 3
Fig. 3. Predictive performance comparison.
Mean absolute error for prediction on test set (resistance prevalence in FY2021-2022) for 6 different prediction models: taking the previous value forwards (red circle), taking the difference forwards (yellow triangle), LTF (green square), XGboost with default parameters (light blue plus sign), XGboost with tuned hyperparameters (dark blue square with multiplication sign), and XGboost with previous antibiotic usage alone as input features (with default parameters, no information on previous resistance prevalence, pink star). n = 119 Trusts, however not all Trusts contributed data to each boxplot (Supplementary Table 2). Note: 70 residuals that had either missing previous values or previous differences were excluded for comparability of performance measures between the models, although XGboost also made these predictions.
Fig. 4
Fig. 4. Predictive performance comparison split by absolute difference between consecutive years.
Mean absolute error for prediction on the test set (resistance prevalence in FY2021–2022) for six different prediction models split by the absolute difference between FY2021–2022 and FY2020–2021 in resistance prevalence, >10% (full circle) or ≤10% (star). Six different prediction models: taking the previous value forwards (red), taking the difference forwards (yellow), LTF (green), XGboost with default parameters (light blue), XGboost with tuned hyperparameters (dark blue), and XGboost with previous antibiotic usage alone as input features (with default parameters, no information on previous resistance prevalence, pink). n Trusts included are provided in the Figure. Note: 70 residuals that had either missing previous values or previous differences were excluded for comparability of performance measures between the models, although XGboost also made these predictions. Results using thresholds of 7.5% and 5% are illustrated in Supplementary Fig. 11. For 3 pathogen–antibiotic combinations: E. coli carbapenems, Klebsiella sp. carbapenems and MSSA vancomycin, most Trusts had 0% resistance prevalence for all available FYs (Supplementary Table 2).

References

    1. World Health Organization. Antimicrobial Resistance (WHO, accessed 10 August 2023); https://www.who.int/news-room/fact-sheets/detail/antimicrobial-resistance.
    1. Iskandar, K. et al. Surveillance of antimicrobial resistance in low- and middle-income countries: a scattered picture. Antimicrob. Resist. Infect. Control10, 1–19 (2021). - PMC - PubMed
    1. Baquero, F. & Negri, M. Antibiotic-selective environments. Clin. Infect. Dis.27, 5–11 (1998). - PubMed
    1. Goossens, H., Ferech, M., Vander Stichele, R. & Elseviers, M. Outpatient antibiotic use in Europe and association with resistance: a cross-national database study. Lancet365, 579–587 (2005). - PubMed
    1. Willmann, M. et al. Time series analysis as a tool to predict the impact of antimicrobial restriction in antibiotic stewardship programs using the example of multidrug-resistant Pseudomonas aeruginosa. Antimicrob. Agents Chemother.57, 1797–1803 (2013). - PMC - PubMed

LinkOut - more resources