

Metabolomic profiling of COVID-19 using serum and urine samples in intensive care and medical ward cohorts
- PMID: 39390047
- PMCID: PMC11467386
- DOI: 10.1038/s41598-024-74641-9
Metabolomic profiling of COVID-19 using serum and urine samples in intensive care and medical ward cohorts
Abstract
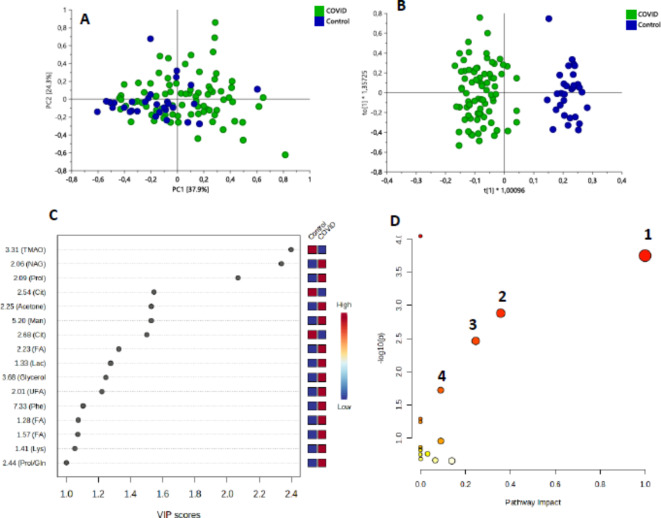
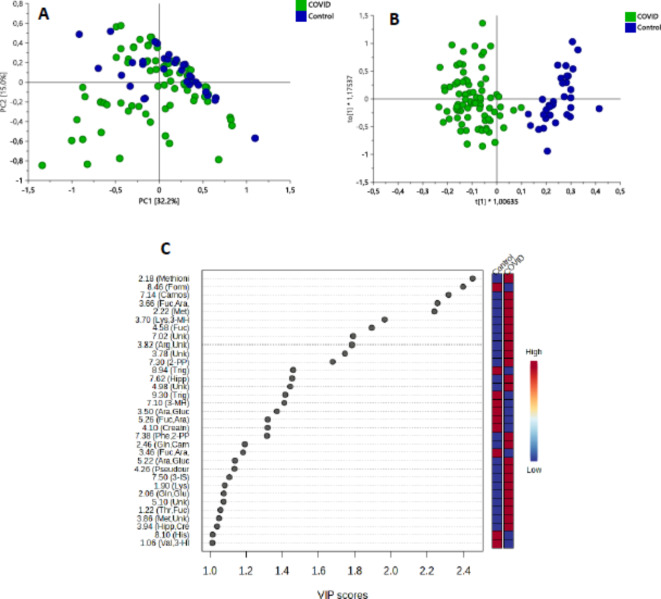
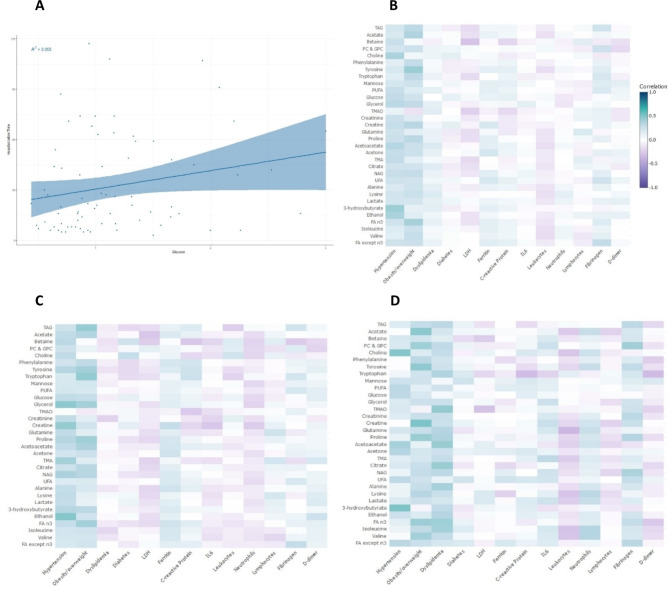
The COVID-19 pandemic remains a significant global health threat, with uncertainties persisting regarding the factors determining whether individuals experience mild symptoms, severe conditions, or succumb to the disease. This study presents an NMR metabolomics-based approach, analysing 80 serum and urine samples from COVID-19 patients (34 intensive care patients and 46 hospitalized patients) and 32 from healthy controls. Our research identifies discriminant metabolites and clinical variables relevant to COVID-19 diagnosis and severity. These discriminant metabolites play a role in specific pathways, mainly "Phenylalanine, tyrosine and tryptophan biosynthesis", "Phenylalanine metabolism", "Glycerolipid metabolism" and "Arginine and proline metabolism". We propose a three-metabolite diagnostic panel-comprising isoleucine, TMAO, and glucose-that effectively discriminates COVID-19 patients from healthy individuals, achieving high efficiency. Furthermore, we found an optimal biomarker panel capable of efficiently classify disease severity considering both clinical characteristics (obesity/overweight, dyslipidemia, and lymphocyte count) together with metabolites content (ethanol, TMAO, tyrosine and betaine).
Keywords: Biomarkers; COVID-19; Metabolomics; NMR; Serum; Urine.
© 2024. The Author(s).
Conflict of interest statement
The authors declare no competing interests.
Figures
Similar articles
-
Metabolomics study of COVID-19 patients in four different clinical stages.Sci Rep. 2022 Jan 31;12(1):1650. doi: 10.1038/s41598-022-05667-0. Sci Rep. 2022. PMID: 35102215 Free PMC article.
-
Metabolic profiling during COVID-19 infection in humans: Identification of potential biomarkers for occurrence, severity and outcomes using machine learning.PLoS One. 2024 May 30;19(5):e0302977. doi: 10.1371/journal.pone.0302977. eCollection 2024. PLoS One. 2024. PMID: 38814977 Free PMC article.
-
Amino Acid Metabolism is Significantly Altered at the Time of Admission in Hospital for Severe COVID-19 Patients: Findings from Longitudinal Targeted Metabolomics Analysis.Microbiol Spectr. 2021 Dec 22;9(3):e0033821. doi: 10.1128/spectrum.00338-21. Epub 2021 Dec 8. Microbiol Spectr. 2021. PMID: 34878333 Free PMC article.
-
Metabolomic characteristics and related pathways in patients with different severity of COVID-19: a systematic review and meta-analysis.J Glob Health. 2025 Feb 28;15:04056. doi: 10.7189/jogh.15.04056. J Glob Health. 2025. PMID: 40019163 Free PMC article.
-
Metabolomic Insights into COVID-19 Severity: A Scoping Review.Metabolites. 2024 Nov 12;14(11):617. doi: 10.3390/metabo14110617. Metabolites. 2024. PMID: 39590853 Free PMC article.
Cited by
-
Metabolomic and lipoproteomic differences and similarities between COVID-19 and other types of pneumonia.Sci Rep. 2025 Mar 3;15(1):7507. doi: 10.1038/s41598-025-91965-2. Sci Rep. 2025. PMID: 40032933 Free PMC article.
-
Time-series metabolomic profiling of SARS-CoV-2 infection: Possible prognostic biomarkers in patients in the ICU by ¹H-NMR analysis.PLoS One. 2025 Jul 3;20(7):e0327244. doi: 10.1371/journal.pone.0327244. eCollection 2025. PLoS One. 2025. PMID: 40608744 Free PMC article.
-
Urinary Metabolic Biomarkers of Attentional Control in Children With Attention-Deficit/Hyperactivity Disorder: A Dimensional Approach Through 1H NMR-Based Metabolomics.NMR Biomed. 2025 Aug;38(8):e70088. doi: 10.1002/nbm.70088. NMR Biomed. 2025. PMID: 40599064 Free PMC article.
-
Decoding TMAO in the Gut-Organ Axis: From Biomarkers and Cell Death Mechanisms to Therapeutic Horizons.Drug Des Devel Ther. 2025 Apr 29;19:3363-3393. doi: 10.2147/DDDT.S512207. eCollection 2025. Drug Des Devel Ther. 2025. PMID: 40322030 Free PMC article. Review.
-
Diagnosis, Severity, and Prognosis from Potential Biomarkers of COVID-19 in Urine: A Review of Clinical and Omics Results.Metabolites. 2024 Dec 22;14(12):724. doi: 10.3390/metabo14120724. Metabolites. 2024. PMID: 39728505 Free PMC article. Review.
References
-
- Junior, C. D. S., Pereira, G., Kelly da Silva Fidalgo, C. M., Valente, A. P. & T. & Saliva NMR-based metabolomics in the war against COVID-19. Anal. Chem. 92(5), 15688–15692 (2020). - PubMed
-
- Worldometer [COVID Live - Coronavirus Statistics]. https://www.worldometers.info/coronavirus/.
MeSH terms
Substances
Grants and funding
- PID2021-126445OB-I00/State Research Agency of the Spanish Ministry of Science and Innovation
- PID2021-126445OB-I00/State Research Agency of the Spanish Ministry of Science and Innovation
- PID2021-126445OB-I00/State Research Agency of the Spanish Ministry of Science and Innovation
- PID2021-126445OB-I00/State Research Agency of the Spanish Ministry of Science and Innovation
- PID2021-126445OB-I00/State Research Agency of the Spanish Ministry of Science and Innovation
- PID2021-126445OB-I00/State Research Agency of the Spanish Ministry of Science and Innovation
- PID2021-126445OB-I00/State Research Agency of the Spanish Ministry of Science and Innovation
- PID2021-126445OB-I00/State Research Agency of the Spanish Ministry of Science and Innovation
- PID2021-126445OB-I00/State Research Agency of the Spanish Ministry of Science and Innovation
- PID2021-126445OB-I00/State Research Agency of the Spanish Ministry of Science and Innovation
- PDC2021-121248-I00, PLEC2021-007774 and CPP2022-009967/Gobierno de España MCIN/AEI/10.13039/501100011033 and Unión Europea "Next Generation EU"/PRTR
- PDC2021-121248-I00, PLEC2021-007774 and CPP2022-009967/Gobierno de España MCIN/AEI/10.13039/501100011033 and Unión Europea "Next Generation EU"/PRTR
- PDC2021-121248-I00, PLEC2021-007774 and CPP2022-009967/Gobierno de España MCIN/AEI/10.13039/501100011033 and Unión Europea "Next Generation EU"/PRTR
- PDC2021-121248-I00, PLEC2021-007774 and CPP2022-009967/Gobierno de España MCIN/AEI/10.13039/501100011033 and Unión Europea "Next Generation EU"/PRTR
- PDC2021-121248-I00, PLEC2021-007774 and CPP2022-009967/Gobierno de España MCIN/AEI/10.13039/501100011033 and Unión Europea "Next Generation EU"/PRTR
- PDC2021-121248-I00, PLEC2021-007774 and CPP2022-009967/Gobierno de España MCIN/AEI/10.13039/501100011033 and Unión Europea "Next Generation EU"/PRTR
- PDC2021-121248-I00, PLEC2021-007774 and CPP2022-009967/Gobierno de España MCIN/AEI/10.13039/501100011033 and Unión Europea "Next Generation EU"/PRTR
- PDC2021-121248-I00, PLEC2021-007774 and CPP2022-009967/Gobierno de España MCIN/AEI/10.13039/501100011033 and Unión Europea "Next Generation EU"/PRTR
- PDC2021-121248-I00, PLEC2021-007774 and CPP2022-009967/Gobierno de España MCIN/AEI/10.13039/501100011033 and Unión Europea "Next Generation EU"/PRTR
- PDC2021-121248-I00, PLEC2021-007774 and CPP2022-009967/Gobierno de España MCIN/AEI/10.13039/501100011033 and Unión Europea "Next Generation EU"/PRTR
- PDC2021-121248-I00, PLEC2021-007774 and CPP2022-009967/Gobierno de España MCIN/AEI/10.13039/501100011033 and Unión Europea "Next Generation EU"/PRTR
- PREDOC_01024/Junta de Andalucía
LinkOut - more resources
Full Text Sources
Medical
