. 2024 Nov;56(11):2506-2516.
doi: 10.1038/s41588-024-01945-x. Epub 2024 Oct 10.

Human DNA polymerase ε is a source of C>T mutations at CpG dinucleotides

Affiliations

Human DNA polymerase ε is a source of C>T mutations at CpG dinucleotides

Marketa Tomkova et al. Nat Genet. 2024 Nov.

Abstract

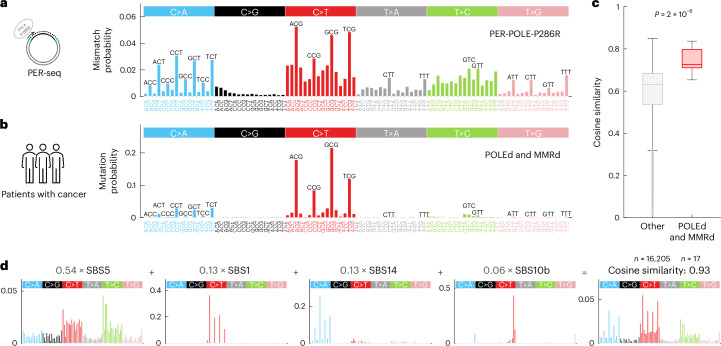
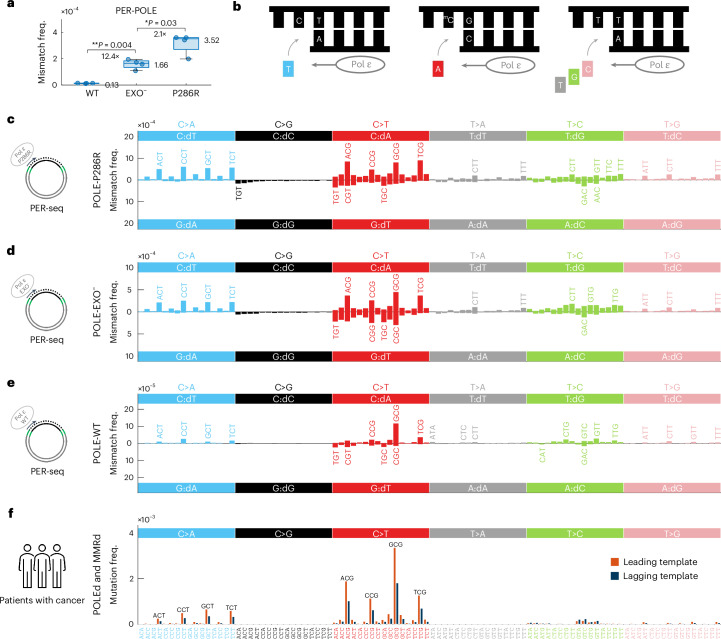
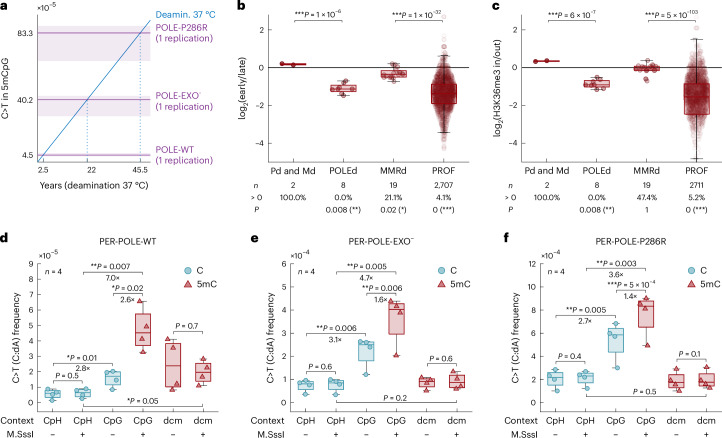
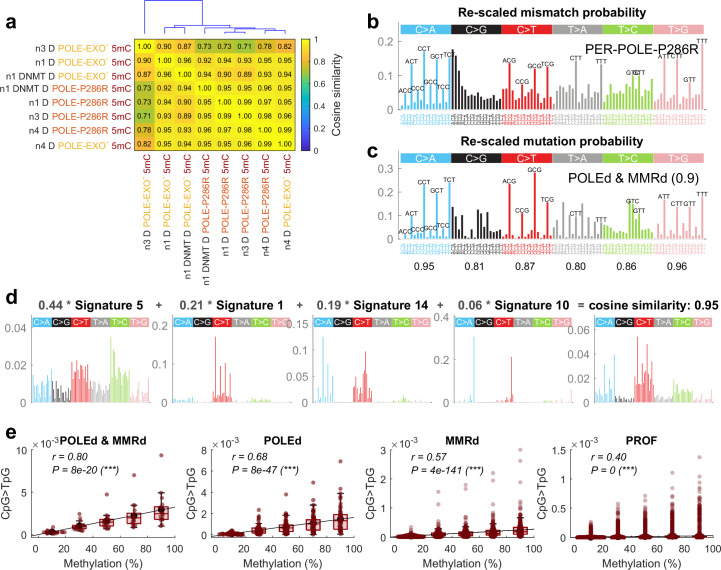
C-to-T transitions in CpG dinucleotides are the most prevalent mutations in human cancers and genetic diseases. These mutations have been attributed to deamination of 5-methylcytosine (5mC), an epigenetic modification found on CpGs. We recently linked CpG>TpG mutations to replication and hypothesized that errors introduced by polymerase ε (Pol ε) may represent an alternative source of mutations. Here we present a new method called polymerase error rate sequencing (PER-seq) to measure the error spectrum of DNA polymerases in isolation. We find that the most common human cancer-associated Pol ε mutant (P286R) produces an excess of CpG>TpG errors, phenocopying the mutation spectrum of tumors carrying this mutation and deficiencies in mismatch repair. Notably, we also discover that wild-type Pol ε has a sevenfold higher error rate when replicating 5mCpG compared to C in other contexts. Together, our results from PER-seq and human cancers demonstrate that replication errors are a major contributor to CpG>TpG mutagenesis in replicating cells, fundamentally changing our understanding of this important disease-causing mutational mechanism.


Conflict of interest statement

The authors declare no competing interests.

Figures

Fig. 1
Fig. 1. Overview and validation of the PER-seq method.
a, A diagram of the PER-seq method. b, Normalized mutation frequency across all samples, shown on a log10 scale, with respect to the required number of linear copies (each with a unique linear-copy identifier). The mutation frequencies were normalized by the average mutation frequency in molecules with at least three linear copies in each sample. c, The observed versus expected frequencies of plasmids with artificially introduced mutations spiked in predefined ratios (Methods). Each dot represents one artificial mutant in one sample. Pearson correlation coefficient R and P values are shown. d,e, Error spectra of individual base changes for Klenow-EXO (d) and KAPA-U+ (e) measured by PER-seq (after background subtraction and normalization for trinucleotides in the ROI, as in all figures; Methods). n = 3 replicates each. The green lines represent the range of previously measured base change error frequencies of Klenow-EXO (ref. ). f, The average error frequency for Klenow-EXO and KAPA-U+ measured by PER-seq. P values determined by two-sided t-test and the ratio of medians are shown. n = 3 replicates each. g,h, Strand-specific error signatures of Klenow-EXO (g) and KAPA-U+ (h), computed as error (nucleotide misincorporation) spectra with respect to the template 5′ and 3′ neighboring bases (that is, the template trinucleotide), measured by PER-seq and averaged across three replicates. For example, T:dG denotes the misincorporation of guanine opposite thymine on the template strand. Boxplots are plotted with the MATLAB function boxchart (Methods). n.m.f., normalized mutation frequency; m.f., mutation frequencies.
Fig. 2
Fig. 2. The PER-seq measured error signature of Pol ε P286R resembles the mutational spectrum and mutational signatures of POLEd and MMRd human cancers.
a, The average cell-free PER-POLE-P286R error signature measured by PER-seq and scaled as a probability density function (PDF) to sum to one. All CpGs in the template DNA were methylated. b, The average spectrum of mutations in 17 patients with cancer with a combination of a pathogenic mutation in the POLE proofreading domain and a defect in the MMR pathway (POLEd and MMRd cancers), normalized for trinucleotide frequency and scaled as a PDF in the same way as in a. c, A distribution of the cosine similarity between mutational spectra of human cancer samples to the PER-POLE-P286R error signature shown in a (both scaled as a PDF). The red boxplot shows cosine similarity values for POLEd and MMRd cancers, and the gray boxplot shows cosine similarity values for all other cancers. P value determined by two-sided, two-sample Mann–Whitney U test. d, A reconstruction of the PER-POLE-P286R error signature by SBS mutational signatures of the COSMIC-V3 database, using non-negative least square regression (Methods). The linear coefficients for each of the four SBS signatures are shown in gray. The last graph in d shows the reconstructed vector (computed as a linear combination of the four SBS signatures) and the resulting cosine similarity to the original PER-POLE-P286R error signature. Boxplots are plotted with the MATLAB function boxchart (Methods).
Fig. 3
Fig. 3. A comparison of POLE-P286R, exonuclease-deficient Pol ε and wild-type Pol ε error spectra determined by PER-seq.
a, The average error frequency for the three polymerases (wild-type (WT), exonuclease-deficience (EXO) and P286R mutant) measured by PER-seq. P values determined by paired two-sided t-test and the ratio of medians are shown. All CpGs in the template DNA were methylated. n = 4 replicates each. b, A diagram of the most common misincorporations by Pol ε. The top strand represents the DNA template, and the bottom strand is filled by Pol ε. The red boxes represent the base that is incorrectly incorporated by Pol ε. ce, Strand-specific error signatures of P286R (c), EXO (d) and wild-type (e) polymerases, computed as error (nucleotide misincorporation) spectra with respect to the template 5′ and 3′ neighboring bases, measured by PER-seq and averaged across four samples. f, Average mutation frequency observed in WGS data of POLEd and MMRd human cancers in the leading (dark blue) and lagging (orange) replication strand templates, normalized for trinucleotides in the two strands. Boxplots are plotted with the MATLAB function boxchart (Methods).
Fig. 4
Fig. 4. Mutational spectra of POLEd and/or MMRd human cancers support the involvement of replication errors in CpG>TpG mutagenesis.
a, Average mutational spectra in POLEd and MMRd, POLEd (and MMRp), MMRd (and POLEp) and PROF (=POLEp and MMRp) human cancer samples. b, Distribution of frequency of CpG>TpG mutations (dark red, per CpG) compared to other mutation types (gray, average frequency of the other 92 mutation types, normalized for trinucleotide occurrences) in these four groups of cancer samples. P values determined by two-sided sign test are shown; P values rounded to 0 if P < 5 × 10324. c, A log2 transformation of the ratio of CpG>TpG mutation frequency in the leading and lagging strands. High values represent enrichment on the leading-strand template. P values determined by two-sided sign test are shown. d, CpG>TpG mutation frequency in CpGs binned by their 5mC levels, measured by bisulfite sequencing in a matched tissue of origin. The data points in each boxplot represent samples in each group (n as in b). e, Percentage of samples with CpG>TpG mutation frequency higher on the leading strand than the lagging strand, stratified by cancer tissue (columns) and sequence context (rows), with the first row representing all CpGs grouped together. Red values represent higher CpG>TpG frequency on the leading-strand template, and blue values represent higher CpG>TpG frequency on the lagging strand template. To allow comparison of WES and WGS data, analyses in ae were restricted to exonic regions only. To make the comparisons tissue adjusted, PROF graphs in ad are restricted to the tissue types that contain POLEd and/or MMRd samples (colon/rectum, gastric, uterus and brain); all tissue types are shown in e. Boxplots are plotted with the MATLAB function boxchart (Methods).
Fig. 5
Fig. 5. Mutant Pol ε causes CpG>TpG mutations in vitro and in vivo.
a, A reconstruction of the mutational profile of the P286R mutation in mES cells by SBS mutational signatures of the COSMIC-V3 database, using non-negative least square regression. The linear coefficients for each of the four SBS signatures are shown in gray. The last graph in a shows the reconstructed vector (computed as a linear combination of the four SBS signatures) and the resulting cosine similarity to the original mES cell P286R mutational profile. b, Normalized mutational profile from WGS of mES cell POLE-P286R clones after 2 months of mutation accumulation and single-cell bottlenecking, averaged across two samples. c, CpG>TpG mutation frequency in the mES cell clones (WT versus P286R) in lowly (<20%) and highly (>80%) methylated CpGs, determined from whole-genome bisulfite sequencing of E14 mES cells (GEO GSM4818066). d, CpG>TpG mutation frequency in the mES cell clones in the lagging and leading strand, estimated from mouse replication timing data. e, Normalized mutational profile from tumor WES from CRISPR–Cas9 knock-in germline POLE-P286R or S459F mouse models, averaged across 34 samples. f, CpG>TpG mutation frequency in the mouse tumors (P286R versus S459F versus S459F/−) in lowly (<20%) and highly (>80%) methylated CpGs, determined from whole-genome bisulfite sequencing of mouse thymus (ENCODE ENCFF850HBL). g, CpG>TpG mutation frequency in the mouse tumors in the lagging and leading strand. Boxplots are plotted with the MATLAB function boxchart (Methods). P values were determined by two-sided sign test.
Fig. 6
Fig. 6. Origins of elevated CpG>TpG mutability.
a, A comparison of the PER-seq measured CpG>TpG error rate in 5mC per single round of replication (purple color) versus previously published estimates of in vitro spontaneous deamination rate of 5mC in double-stranded DNA at 37 °C (5.8 × 10−13 per second) (blue color). The x axis shows the estimated length of incubation at 37 °C that would generate the same number of CpG>TpG errors as a single round of replication by Pol ε (WT, exonuclease-deficient or P286R). The y axis shows the resulting frequency of 5mCpG>TpG errors. b,c, CpG>TpG mutations are depleted in MMR-active (early replicating (b) or H3K36me3-enriched (c)) regions in MMRp but not/less so in MMRd WGS samples. The y axis shows a log2-transformed ratio of CpG>TpG mutation frequency in early/late (b) and inside/outside H3K36me3-marked (c) regions. Two-sided sign test P values (shown below each boxplot) were used to to evaluate whether the values differ from zero. P values comparing samples (shown above each boxplot) were determined by two-sided t-test with an uneven variance. df, The PER-seq measured C>T (C:dA) error rate with respect to the modification state and cytosine sequence contexts—CpG, dcm (CCAGG and CCTGG) and CpH (all other C contexts). Every dot represents the average error frequency in the given context in one sample. Samples with all CpGs methylated by the M.SssI DNA methyltransferase are shown with the plus sign in the bottom row. The color of the boxplots highlights whether the cytosine is methylated (5mC, dark red) or unmodified (C, teal) in the given sample and sequence context. Note that M.SssI presence does not change modification state in CpH or dcm contexts due to its selectivity to CpGs. A paired two-sided t-test was used to compare the values between the groups, and the ratio of the medians is shown below the significant P values. Boxplots are plotted with the MATLAB function boxchart (Methods).
Extended Data Fig. 1
Extended Data Fig. 1. Evaluation of DNA polymerase activity and Klenow enzyme error sign.
a, Agarose gels of intact, gapped and filled plasmid following digestion by restriction enzymes within the gapping region (HindIII and SacI) and outside the gapping region (NdeI) for both unmethylated and methylated plasmid. Gapped plasmid is not digested by HindIII or SacI but is linearized by digest of NdeI. ‘L’ indicates 1 kb GeneRuler (Thermo Fisher Scientific). b, Schematic showing the location of restriction sites within the plasmid. Experiments were repeated for each batch of plasmid (N = 2). c, Evaluation of template fill-in by DNA polymerases. Templates filled in by indicated polymerases were digested with HindIII or SacI restriction enzymes as shown in d. Experiments were repeated for each batch of polymerases (N = 2). d, Schematic showing primer localization sites and restriction enzymes. Single-stranded DNA resists digestion, resulting in the presence of the template for PCR amplification. e, Methylation-sensitive restriction enzyme HpaII was used to determine the efficiency of methylation with M.SssI. Experiments were repeated for each batch of plasmid (N = 2). f, Strand-specific error signature of Klenow-EXO, when unmethylated and methylated template DNA was used for fill-in. Strand-specific error signatures of Klenow-EXO and KAPA-U+. The error signature is computed as an error (nucleotide misincorporation) spectra with respect to the template 5′ and 3′ neighboring bases (that is, the template trinucleotide), measured by PER-seq and averaged across three replicates. For example, T:dG denotes misincorporation of guanine opposite thymine on the template strand. Source data
Extended Data Fig. 2
Extended Data Fig. 2. The PER-seq measured error signature of Pol ε P286R resembles the mutational spectrum and mutational signatures of POLEd and MMRd human cancers.
a, A heatmap and hierarchical clustering on a pairwise cosine similarity matrix between PER-POLE-P286R and PER-POLE-EXO- samples. The cosine similarity is computed on the strand-specific error spectra (that is, each with 192 error types) after background subtraction and trinucleotide frequency normalization. The hierarchical clustering is computed using the MATLAB functions linkage, optimalleaforder and dendrogram with default parameters. b,c, Error/mutational spectra rescaled within each of the six nucleotide substitutions (divided by the sum of all bars of the same color). In other words, this visualization shows the relative mutation frequencies within each nucleotide substitution group. b, The average in vitro POLE-P286R (‘PER-POLE-P286R’) error spectrum measured by PER-seq, after subtraction of assay-specific background, normalized for trinucleotide frequency and scaled as a probability density function in each of the six substitution types. c, The average in vivo spectrum of mutations in 17 human cancers with a combination of a pathogenic mutation in the POLE proofreading domain and a defect in the mismatch repair pathway (POLEd and MMRd cancers), normalized for trinucleotide frequency and scaled as a probability density function in each of the six substitution types. The numbers below the profile plot in c denote the cosine similarity values between b and c computed for each of the six substitution types. Interestingly, all six substitution classes exhibit a relatively high cosine similarity, with a minimum of 0.8 in T>A and a maximum of 0.97 in T>G (mainly TpT>GpT). The overall cosine similarity on the rescaled profiles is 0.9. d, A reconstruction of the PER-POLE-P286R error signature by SBS mutational signatures of the COSMIC-V2 database, using non-negative least square regression (Methods). The linear coefficients for each of the four SBS signatures are shown in gray. The last panel shows the reconstructed vector (computed as a linear combination of the four SBS signatures) and the resulting cosine similarity to the original PER-POLE-P286R error signature. e, CpG>TpG mutation frequency in CpGs binned by their 5mC levels, measured by bisulfite sequencing in a matched tissue of origin. Each dot represents a value in one sample and one 5mC bin (N: 17 for POLEd and MMRd, 66 for POLEd, 329 for MMRd, 3181 for PROF). Spearman correlation coefficient and two-sided P-value are shown on top. Boxplots are plotted with the MATLAB function boxchart (Methods).
Extended Data Fig. 3
Extended Data Fig. 3. CpG>TpG mutagenesis in cancer patients (WGS, entire genome).
a, Average mutational spectra in POLEd and MMRd, POLEd (and MMRp), MMRd (and POLEp) and PROF (=POLEp and MMRp) human cancer samples. b, Distribution of frequency of CpG>TpG mutations (dark red, per CpG) compared to other mutation types (gray, average frequency of the other 92 mutation types, normalized for trinucleotide occurrences) in these four groups of cancer samples. The gray text below the boxplots shows ‘N’: the number of samples, ‘higher in CpGs’: the percentage of samples with higher CpG>TpG mutation frequency compared to the frequency of other mutation types and ‘P’: two-sided sign test P-value comparison between the CpG>TpG vs. other mutation frequencies. c, A log2 transformation of the ratio of CpG>TpG mutation frequency in the leading and lagging strands. High values represent enrichment on the leading-strand template. Two-sided sign test P-value is shown in each group. d, CpG>TpG mutation frequency in CpGs binned by their 5mC levels, measured by bisulfite sequencing in a matched tissue of origin. The data points in each boxplot represent samples in each group (N as in b). Two-sided sign test P-value is used to compare CpG>TpG frequency between the first and the last bin. e, The heatmap color and text represent the percentage of samples with CpG>TpG mutation frequency higher on the leading strand compared to the lagging strand, stratified by cancer tissue (columns) and sequence context (rows), with the first row representing all CpGs grouped together. Red values represent higher CpG>TpG frequency on the leading-strand template, and blue values represent higher CpG>TpG frequency on the lagging strand template. To make the comparisons tissue adjusted, PROF panels in ad are restricted to the tissue types that contain POLEd and/or MMRd samples (colon/rectum, gastric, uterus and brain). e shows all tissue types. Boxplots are plotted with the MATLAB function boxchart (Methods).
Extended Data Fig. 4
Extended Data Fig. 4. CpG>TpG mutagenesis in cancer patients (WGS, outside exome).
a, Average mutational spectra in POLEd and MMRd, POLEd (and MMRp), MMRd (and POLEp) and PROF (=POLEp and MMRp) human cancer samples. b, Distribution of frequency of CpG>TpG mutations (dark red, per CpG) compared to other mutation types (gray, average frequency of the other 92 mutation types, normalized for trinucleotide occurrences) in these four groups of cancer samples. The gray text below the boxplots shows ‘N’: the number of samples, ‘higher in CpGs’: the percentage of samples with higher CpG>TpG mutation frequency compared to the frequency of other mutation types and ‘P’: two-sided sign test P-value comparison between the CpG>TpG vs. other mutation frequencies. c, A log2 transformation of the ratio of CpG>TpG mutation frequency in the leading and lagging strands. High values represent enrichment on the leading-strand template. Two-sided sign test P-value is shown in each group. d, CpG>TpG mutation frequency in CpGs binned by their 5mC levels, measured by bisulfite sequencing in a matched tissue of origin. The data points in each boxplot represent samples in each group (N as in b). Two-sided sign test P-value is used to compare CpG>TpG frequency between the first and the last bin. e, The heatmap color and text represent the percentage of samples with CpG>TpG mutation frequency higher on the leading strand compared to the lagging strand, stratified by cancer tissue (columns) and sequence context (rows), with the first row representing all CpGs grouped together. Red values represent higher CpG>TpG frequency on the leading-strand template, and blue values represent higher CpG>TpG frequency on the lagging strand template. To make the comparisons tissue adjusted, PROF panels in ad are restricted to the tissue types that contain POLEd and/or MMRd samples (colon/rectum, gastric, uterus and brain). e shows all tissue types. Boxplots are plotted with the MATLAB function boxchart (Methods).
Extended Data Fig. 5
Extended Data Fig. 5. WGS of mESCs and PER-EXTRACT-seq.
a, Schematics of experiment for WGS and PER-EXTRACT-seq. b, Screenshot from IGV browser displaying reads (horizontal blocks) aligned to mouse genome (Chr5, mm10). Nucleotide variants that do not match annotation are highlighted in the read. B10 and A5 clones have C>G and T>C mutations, which results in P286R mutation and silent C>T (creates BbsI restriction site) and C>A (CRISPR PAM site) mutations. B10 clone also has evidence of unintended G>T mutation in three reads, which would result in STOP codon in one allele. c, Western blot using POLE and β-actin antibodies. Similar level of POLE expression is observed in different clones. d, Gapped plasmid (+) resists digestion, and filled plasmid (−) can be digested as shown in lanes containing known amounts of purified DNA (the first three lanes). HCC2998 cell extract completely filled the template, while there was substantial plasmid unfilled in mESCs. As explained in the text, only filled plasmid contributes to the PER-EXTRACT-seq results. Source data
Extended Data Fig. 6
Extended Data Fig. 6. PER-EXTRACT-seq results.
a, PER-EXTRACT-seq error signature of filling gapped plasmids in nuclear extracts from cells with POLEP286R. The error signature is computed as error (nucleotide misincorporation) spectra with respect to the template 5′ and 3′ neighboring bases (that is, the template trinucleotide), measured by PER-EXTRACT-seq and averaged across available samples: 5 samples from nuclear extracts from the mESC clones with POLEP286R mutation, and 4 samples from nuclear extracts from HCC2998 cell line (that naturally harbors a POLEP286R/+ mutation). bd, PER-EXTRACT-seq measured C>T (C:dA) error rate with respect to the modification state and cytosine sequence contexts: CpG and CpH (all other C contexts). Every dot represents average error frequency in the given context in one sample. Samples with all CpGs methylated by the M.SssI DNA methyltransferase are shown with the plus sign in the bottom row. The color of the boxplots highlights whether the template cytosine is methylated (5mC, dark red) or unmodified (C, light blue) in the given sample and sequence context. Note that M.SssI presence does not change modification state in CpH due to its selectivity to CpGs. A two-sided paired t-test was used to compare the values between the groups, and the ratio of the medians is shown below the significant P-values. The values from PER-EXTRACT-seq for filling in HCC2998 (b), mESC POLEP286R (c) and mESC WT (d) nuclear extracts are shown. e, PER-EXTRACT-seq error signature of incubating the control ungapped plasmids in nuclear extracts from cells with POLEP286R, averaged across available samples: 5 samples from nuclear extracts from the mESC clones with POLEP286R mutation, and 4 samples from nuclear extracts from HCC2998 cell line. fh, PER-EXTRACT-seq measured C>T (C:dA) error rate in the control ungapped plasmids. A two-sided paired t-test was used to compare the values between the groups, and the ratio of the medians is shown below the significant P-values. Boxplots are plotted with the MATLAB function boxchart (Methods).
Extended Data Fig. 7
Extended Data Fig. 7. Background subtraction in PER-seq.
a, Diagram of the four strands sequenced in PER-seq (PD, PT, D, T) and how their values are used to determine the true-positive polymerase error rate in the daughter strand after background subtraction (dark red) by subtracting background (blue) from the raw mutation frequency in the daughter strand (yellow). The background then consists of two components: potential gapping damage (green) that could have happened to the template strand when single-stranded and before/while being filled, and a general background (purple) estimated by the raw mutation frequency in the parental daughter (PD) strand. Finally, the gapping damage is estimated as the difference between the template (T; darker blue) and parental template (PT; dark orange) strands. Of note, only fully filled molecules can undergo successful restriction digest and downstream library preparation for both the template and daughter strands, and therefore unfilled plasmids do not confound the results. In other words, by ‘template’ we mean the template strand of the ROI after filling by the respective polymerases. b, The CpG>TpG mutation frequency for all the values described in a. N = 4 replicates each. Boxplots are plotted with the MATLAB function boxchart (Methods).

References

    1. Brown, T. A. (ed.) Genomes 2nd edn (Wiley-Liss, 2002). - PubMed
    1. Loeb, L. A. Human cancers express mutator phenotypes: origin, consequences and targeting. Nat. Rev. Cancer11, 450–457 (2011). - PMC - PubMed
    1. Tornaletti, S. & Pfeifer, G. P. Complete and tissue-independent methylation of CpG sites in the p53 gene: implications for mutations in human cancers. Oncogene10, 1493–1499 (1995). - PubMed
    1. Alexandrov, L. B. et al. Signatures of mutational processes in human cancer. Nature500, 415–421 (2013). - PMC - PubMed
    1. Blokzijl, F. et al. Tissue-specific mutation accumulation in human adult stem cells during life. Nature538, 260–264 (2016). - PMC - PubMed

Substances

LinkOut - more resources