. 2024 Oct 10;14(1):23712.
doi: 10.1038/s41598-024-74714-9.

Evaluating the ability of the Wind Erosion Prediction System (WEPS) to simulate near-surface wind speeds in the Inland Pacific Northwest, USA

Affiliations

Evaluating the ability of the Wind Erosion Prediction System (WEPS) to simulate near-surface wind speeds in the Inland Pacific Northwest, USA

Xiuli Zhang et al. Sci Rep. .

Abstract

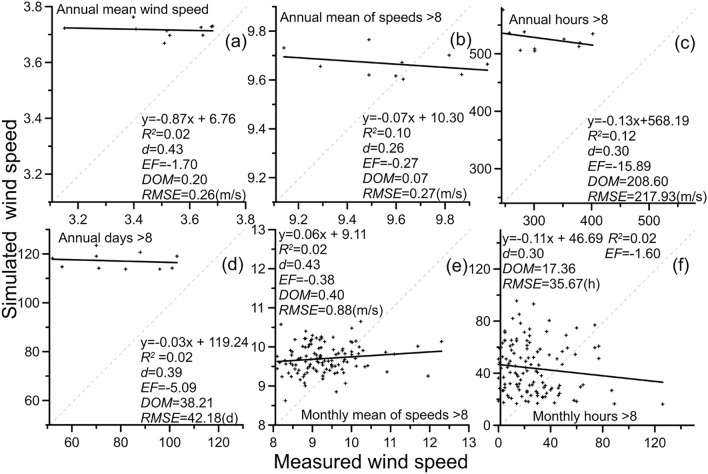
Wind speed is one of the main control factors of wind erosion and dust emissions, which are major problems in arid and semiarid regions of the world. Accurately simulating highly precise hourly wind speeds is critical and cost-efficient for land management decisions with the goal of mitigating wind erosion and land degradation. The Wind Erosion Prediction System (WEPS) is a process-based, daily time-step model that simulates changes in the soil-vegetation-atmosphere. However, to date, relatively few studies have been conducted to test the ability of the WEPS in simulating hourly wind speeds. In this study, the performance of the WEPS model was tested in the Inland Pacific Northwest (iPNW), where wind erosion is a serious problem. Hourly wind speeds were observed and simulated by the WEPS at 13 meteorological stations from 2009 to 2018 using the WEPS hourly wind speed probability histogram. Owing to increasing wind shear, the model is not as precise in reproducing high wind speeds. The WEPS inadequately simulated the hourly wind speeds at six of the 13 stations, with a low index of agreement (d < 0.5). The complex regional topography may be one of the reasons for this lack of agreement, because the WEPS's performance of interpolation relies on spatial distances and surface complexity. Therefore, we validated the model using another wind-speed database to eliminate the impact of spatial interpolation. The performance of the WEPS was improved after removing the impact of spatial interpolation, producing d values > 0.5 at nine of the 13 stations. Our results suggest that the WEPS can accurately simulate hourly wind speeds and assess wind erosion in the absence of interpolation, whereas the model may be uncertain when invoking spatial interpolation. Some evidence also suggests that the model may have a tendency to underestimate observed hourly wind speeds. Pragmatically, this suggests that model users should consider the possibility that WEPS may underestimate wind erosion risk in the iPNW and plan implementation of conservation practices accordingly.

Keywords: Spatial interpolation; Wind Erosion Prediction System; Wind power; Wind speed probability histogram; iPNW.


Conflict of interest statement

The authors declare no competing interests.

Figures

Fig. 1
Fig. 1
Site location distribution in the iPNW of the United States (Generated by ArcGIS 10.8, https://www.esri.com/zh-cn/home). Circles represent the sites of Data set 1, which was also known as the first wind data set and was derived from WSU AgWeatherNet. The representative of this serial number can be found in Table 1. Symbol × represents the sites of Data set 2, which was also known as the second wind data set and was derived from DCDC (Table 2). The WEPS weather sub-model was developed from substantial amounts of historical wind measurement data obtained from DCDC.
Fig. 2
Fig. 2
Characteristics of inter-annual variations in the annual total number of hours with speeds greater than 8 m s−1 (annual hours > 8) across stations in the iPNW.
Fig. 3
Fig. 3
Characteristics of intra-annual variations in the monthly mean of speeds > 8 calculated from hourly wind speeds greater than 8 m s−1 across stations in the iPNW.
Fig. 4
Fig. 4
Seasonal variation in the mean of speeds calculated according to hourly wind speed greater than 8 m s−1 and the total number of seasonal hours with speeds greater than 8 m s−1 across stations in the iPNW.
Fig. 5
Fig. 5
The observed and simulated monthly total number of hours with speeds greater than 8 m s−1. Dashed lines represent 1:1 line.
Fig. 6
Fig. 6
The observed and simulated monthly mean of speeds calculated by hourly wind speed greater than 8 m s−1 (a) and the monthly total number of hours with speeds greater than 8 m s−1 (b) at the Triple-S site.
Fig. 7
Fig. 7
An example of observed and simulated values of annual mean wind speed, annual mean of speeds > 8, annual hours > 8, annual days > 8, monthly mean of speeds > 8, and monthly hours > 8 at the McClure site. Dashed lines represent 1:1 line.
Fig. 8
Fig. 8
Observed and simulated by WEPS in absence of interpolation monthly total number of hours with speeds greater than 8 m s−1 at 13 meteorological stations across iPNW. Dashed lines represent 1:1 line.
Fig. 9
Fig. 9
Comparative analysis of observed and simulated by WEPS in absence of interpolation values of annual mean wind speed, annual mean of speeds > 8, annual hours > 8, annual days > 8, monthly mean of speeds > 8, monthly hours > 8 at the Wenatchee Pangborn site. Dashed lines represent 1:1 line.

References

    1. Bekkar, A., Hssina, B., Douzi, S. & Khadija, D. Air-pollution prediction in smart city, deep learning approach. J. Big Data8, 1–21 (2021). - PMC - PubMed
    1. Wen, W. et al. In situ evaluation of stalk lodging resistance for different maize (Zea mays L.) cultivars using a mobile wind machine. Plant Methods15, 96 (2019). - PMC - PubMed
    1. Zhang, J. et al. Beryllium-7 measurements of wind erosion on sloping fields in the wind-water erosion crisscross region on the Chinese Loess Plateau. Sci. Total Environ.615, 240–252 (2018). - PubMed
    1. Mabhaudhi, T., Chimonyo, V. G. P., Chibarabada, T. P. & Modi, A. T. Developing a roadmap for improving neglected and underutilized crops: A case study of South Africa. Front. Plant Sci.8, 2143 (2017). - PMC - PubMed
    1. Yang, Y. et al. Dust-wind interactions can intensify aerosol pollution over eastern China. Nat. Commun.8, 15333 (2017). - PMC - PubMed

LinkOut - more resources