. 2024 Oct 10;8(1):230.
doi: 10.1038/s41698-024-00728-1.

Discovery of prognostic lncRNAs in colorectal cancer using spatial transcriptomics

Affiliations

Discovery of prognostic lncRNAs in colorectal cancer using spatial transcriptomics

Holly R Pinkney et al. NPJ Precis Oncol. .

Abstract

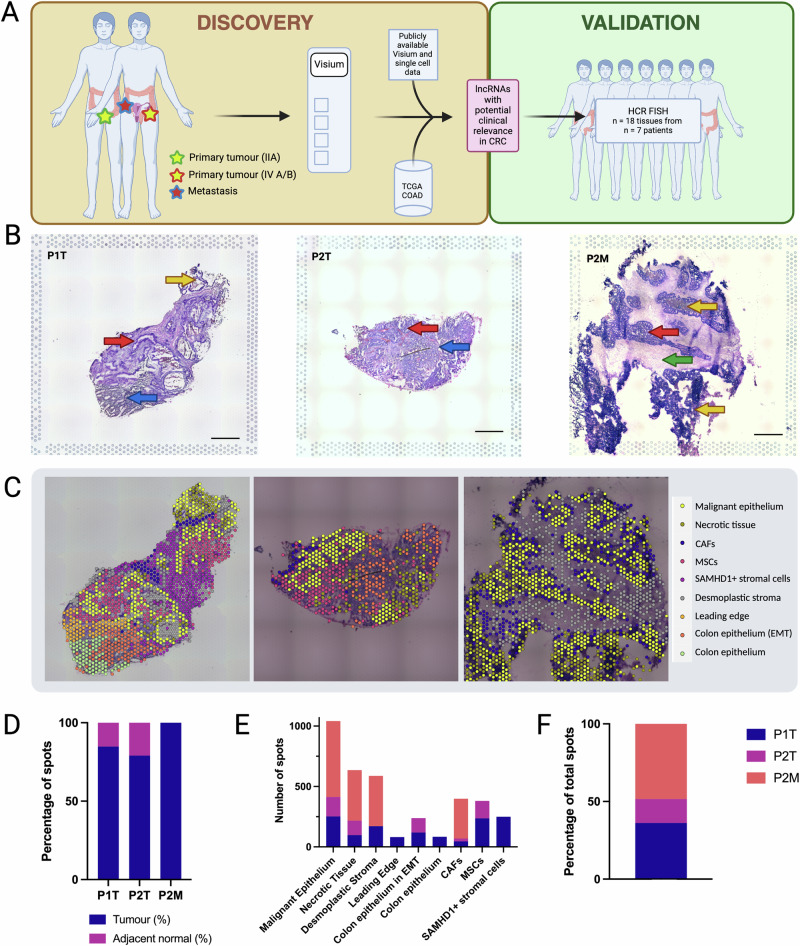
Colorectal cancer (CRC) exhibits significant genetic and epigenetic diversity, evolving into sub-clonal populations with varied metastatic potentials and treatment responses. Predicting metastatic disease in CRC patients remains challenging, underscoring the need for reliable biomarkers. While most research on therapeutic targets and biomarkers has focused on proteins, non-coding RNAs such as long non-coding RNAs (lncRNAs) comprise most of the transcriptome and demonstrate superior tissue- and cancer-specific expression. We utilised spatial transcriptomics to investigate lncRNAs in CRC tumours, offering more precise cell-type-specific expression data compared to bulk RNA sequencing. Our analysis identified 301 lncRNAs linked to malignant CRC regions, which we validated with public data. Further validation using RNA-FISH revealed three lncRNAs (LINC01978, PLAC4, and LINC01303) that are detectable in stage II tumours but not in normal epithelium and are upregulated in metastatic tissues. These lncRNAs hold potential as biomarkers for early risk assessment of metastatic disease.


Conflict of interest statement

Author S.D.D. is a cofounder and consultant to, and holds shares in, Amaroq Therapeutics and RNAfold.AI, but declares no competing interests. The remaining authors declare no competing interests.

Figures

Fig. 1
Fig. 1. Spatial transcriptomics confirms the spatial architecture of cellular tissue components.
A Overview of methodology for identification and characterisation of lncRNA markers with potential clinical relevance. B H&E staining of tumour sections used for Visium spatial gene expression profiling, with pathologist annotations. Left = P1T, Middle = P2T, Right = P2M. Red arrows denote areas with high nuclei density (malignant lesions). Blue arrows denote adjacent normal tissue. Yellow arrows denote necrosis. Green arrows denote desmoplastic stroma (dense, fibrous tissue with low cellularity). Scale bars = 1000 µm. C Unbiased clustering of spots for P1T, P2T and P2M using the FindClusters algorithm (Seurat v4), with assigned cell or tissue types based on transcriptomic profile. Missing spots = removed during the QC process. D Tumour purity analysis based on cell type clusters from C. Adjacent normal = “Colon epithelium” and “Colon epithelium in EMT”. Tumour = all other cell types. E Distribution of cell and tissue types in each tissue, calculated as the sum of spots associated with each cluster, per tissue. F Percentage of total spots associated with each tissue. Image created with Biorender.com.
Fig. 2
Fig. 2. Spatial transcriptomics detects spatially distinct expression patterns for mRNAs and lncRNAs in patient tissue.
A Spatial expression patterns for CRC-associated mRNA transcripts. Top panels = P1T, middle panels = P2T, bottom panels = P2M. Scale = normalised, scaled expression values. B Spatial expression patterns for CRC-associated lncRNA transcripts. Top panels = P1T, middle panels = P2T, bottom panels = P2M. Scale = normalised, scaled expression values (P1T = 0–4. P2T, P2M = 0–2). C Gene expression metrics. Top panel = Percentage of tissue-covered spots expressing lncRNAs in P1T, P2T and P2M. Middle panels = Total genes and lncRNA genes captured per spot. Bottom panel = Mean normalised expression levels, stratified by cell type. Image created with Biorender.com.
Fig. 3
Fig. 3. Novel lncRNAs are associated with CRC patient disease and survival.
A Prioritisation matrix of lncRNAs for further investigation. B Venn diagram of lncRNAs identified from Dunedin cohort malignant tissue (DCLs) (yellow), Shanghai cohort malignant cells (SCLs) (purple) and TCGA-COAD tumour tissue (green). C Principal component analysis (PCA) plot of variance within the TCGA-COAD bulk RNA-seq dataset (n = 473 tissues) and matched normal tissue (n = 41). D LncRNA candidate expression in bulk TCGA-COAD RNA-seq data (two-tailed, unpaired t-test, **** = p-value < 0.0001). E High expression (upper quartile) of the three lncRNAs of interest as a signature was significantly correlated with poorer overall survival compared to low expression (lower quartile, log-rank test). F LINC01303 is expressed at significantly higher levels in microsatellite instability (MSI) or CpG island methylator phenotype (CIMP) subtypes, compared to chromosomal instability (CIN), an invasive phenotype (INV), or normal colon epithelium (TCGA-COAD RNA-seq data stratified by clinical subtype, tested using an ordinary one-way ANOVA, with Tukey’s post-hoc test for multiple comparisons, *** = padj < 0.001, **** = padj < 0.0001). Image created with Biorender.com.
Fig. 4
Fig. 4. Prioritised candidate lncRNAs are detectable in early-stage disease.
A Overview of patient cohort for HCR-FISH. Patient 1 = Sigmoid colon primary tumour (stage IIA at first diagnosis), metachronous second primary in ascending colon with associated synchronous metastasis to right lung, upper lobe. Patient 2 = Sigmoid colon primary tumour (stage IVa), synchronous metastasis to para-aortic lymph node. Patient 3 = Recto-sigmoid colon primary tumour (stage IIA at first diagnosis), metachronous second primary in descending colon with associated synchronous metastasis to right lung, middle lobe. Patient 4 = Rectal tumour (stage IIA), metachronous metastasis to the left lung, lower lobe. Patient 5 = Ascending colon primary tumour (stage IV), synchronous metastasis to retroperitoneum. Patient 6 = Mid-ascending colon primary tumour (stage IVb), synchronous metastasis to omentum. Patient 7 = Caecal primary tumour (stage IVa), synchronous metastasis to Liver segments 5 and 6. B Overview of amplification of FISH signal using HCR. C Representative HCR–FISH signal for LINC01978 in Patient 7 primary tumour (left panel = DAPI nuclear staining, left-middle panel = RNA–FISH signal, right-middle panel = MALAT1 positive control expression, right panel = merge). D Representative HCR–FISH signal for PLAC4 in Patient 2 omentum metastasis (left panel = DAPI nuclear staining, left-middle panel = RNA-FISH signal, right-middle panel = MALAT1 positive control expression, right panel = merge). E Representative HCR-FISH signal for LINC01303 in Patient 6 liver metastasis (left panel = DAPI nuclear staining, left-middle panel = RNA–FISH signal, right-middle panel = MALAT1 positive control expression, right panel = merge). F Quantification of HCR-FISH signal for LINC01978. G Quantification of HCR-FISH signal for PLAC4. H Quantification of HCR-FISH signal for LINC01303. Scale bar = 100 µm for all images. DAPI stain denotes nuclei. Met = Metastasis. Rec = Disease recurrence (second metachronous primary). Error bars = mean ± SEM. Tested using a Kruskal–Wallis test for non-parametric data, with Dunn’s post-hoc test for multiple comparisons. * = padj < 0.05. Image created with Biorender.com.

References

    1. Sung, H. et al. Global Cancer Statistics 2020: GLOBOCAN Estimates of Incidence and Mortality Worldwide for 36 Cancers in 185 Countries. CA Cancer J. Clin.10.3322/caac.21660 (2021). - PubMed
    1. Ferlay, J. et al. Global Cancer Observatory: Cancer Today (version 1.1). (International Agency for Research on Cancer, Lyon, France, 2024). https://gco.iarc.who.int/today [cited 19 Mar 2024].
    1. Siegel, R. L., Miller, K. D., Wagle, N. S. & Jemal, A. Cancer statistics, 2023. CA Cancer J. Clin.73, 17–48 (2023). - PubMed
    1. Ogino, S. & Goel, A. Molecular classification and correlates in colorectal cancer. J. Mol. Diagn.10, 13–27 (2008). - PMC - PubMed
    1. Fearon, E. R. Molecular genetics of colorectal cancer. Annu Rev. Pathol.6, 479–507 (2011). - PubMed

LinkOut - more resources