. 2024 Nov;43(22):5494-5529.
doi: 10.1038/s44318-024-00260-9. Epub 2024 Oct 10.

Transplacental SARS-CoV-2 protein ORF8 binds to complement C1q to trigger fetal inflammation

Affiliations

Transplacental SARS-CoV-2 protein ORF8 binds to complement C1q to trigger fetal inflammation

Tamiris Azamor et al. EMBO J. 2024 Nov.

Abstract

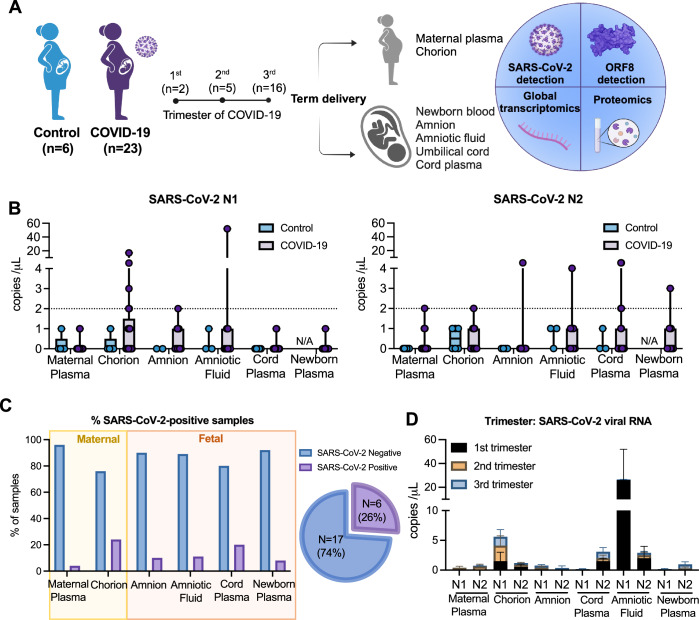
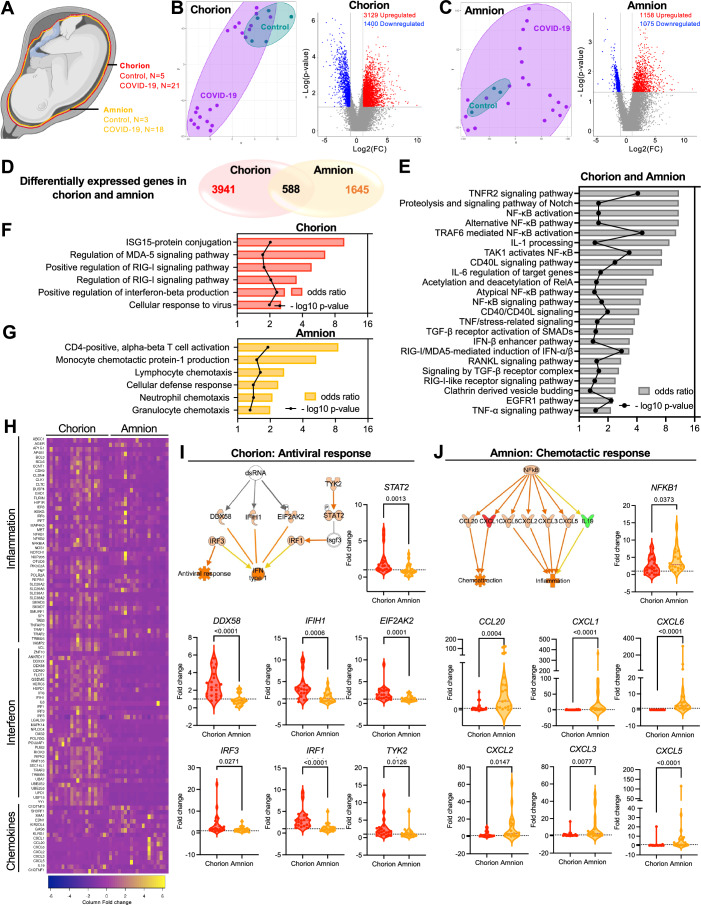
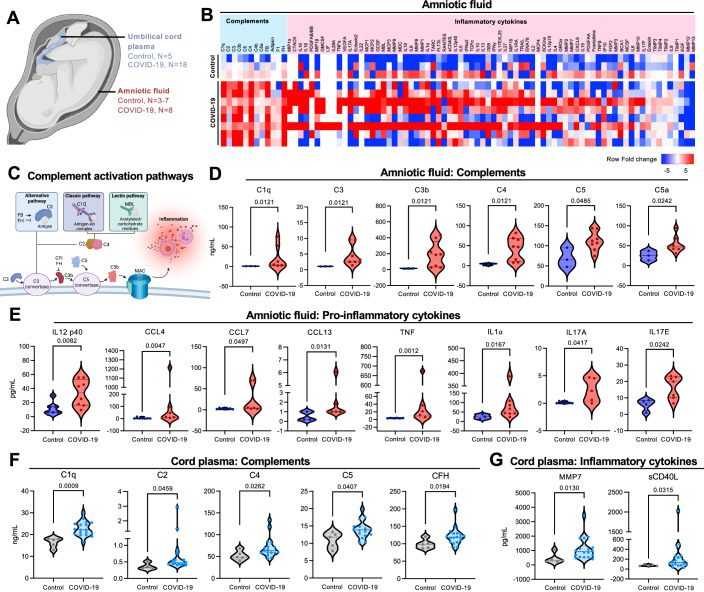
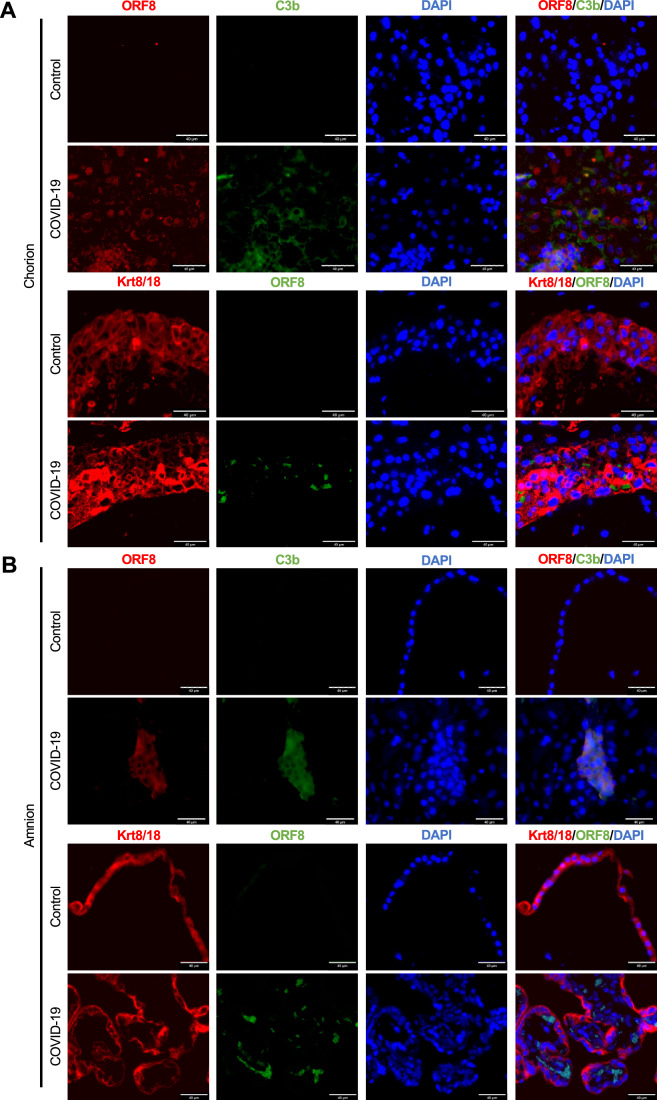
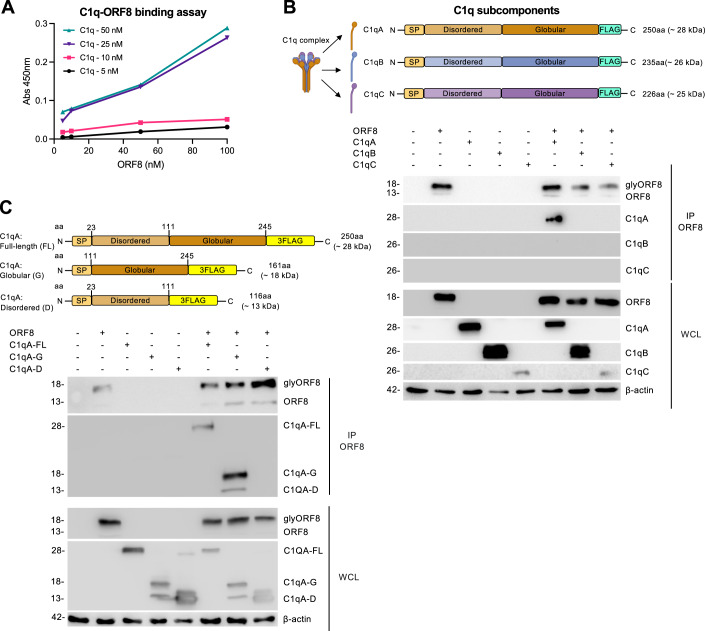
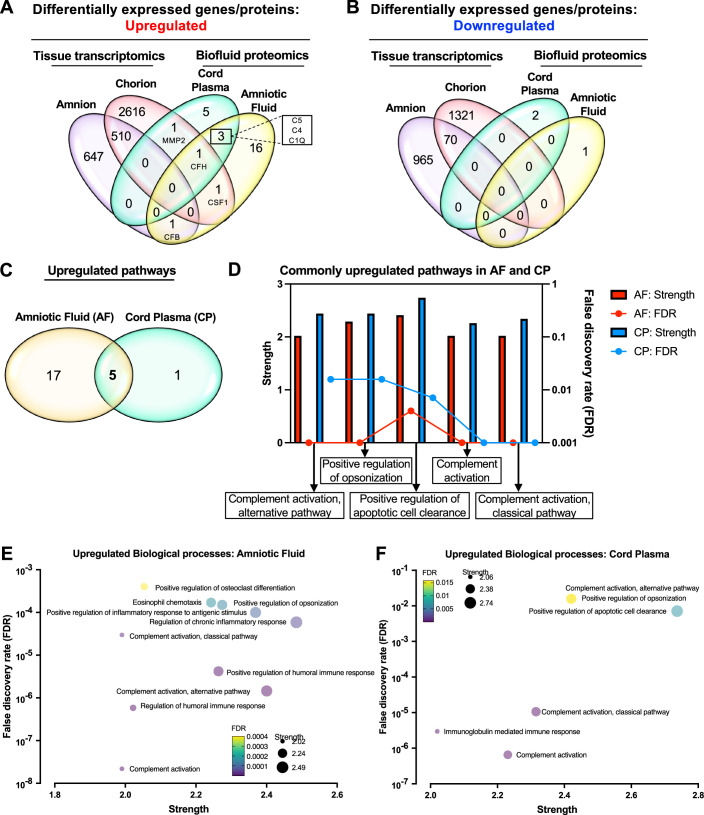
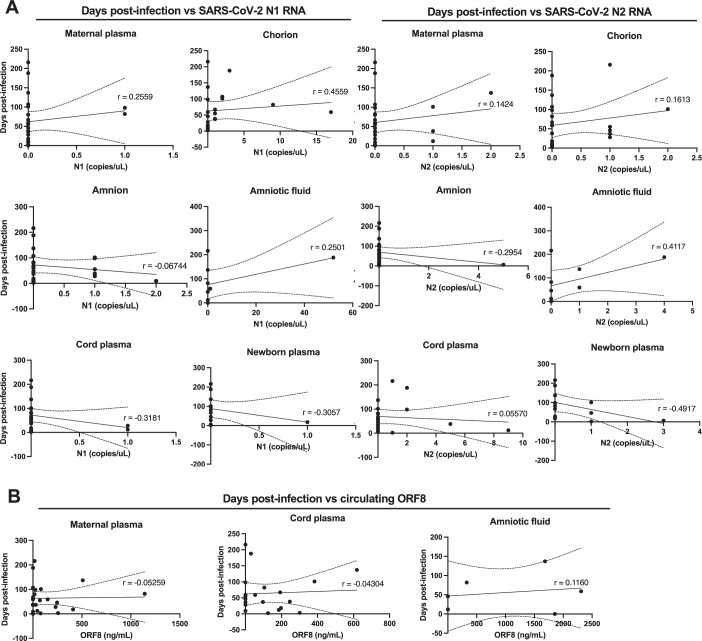
Prenatal SARS-CoV-2 infection is associated with higher rates of pregnancy and birth complications, despite that vertical transmission rates are thought to be low. Here, multi-omics analyses of human placental tissues, cord tissues/plasma, and amniotic fluid from 23 COVID-19 mother-infant pairs revealed robust inflammatory responses in both maternal and fetal compartments. Pronounced expression of complement proteins (C1q, C3, C3b, C4, C5) and inflammatory cytokines (TNF, IL-1α, and IL-17A/E) was detected in the fetal compartment of COVID-19-affected pregnancies. While ~26% of fetal tissues were positive for SARS-CoV-2 RNA, more than 60% of fetal tissues contained SARS-CoV-2 ORF8 proteins, suggesting transplacental transfer of this viral accessory protein. ORF8-positive fetal compartments exhibited increased inflammation and complement activation compared to ORF8-negative COVID-19 pregnancies. In human placental trophoblasts in vitro, exogenous ORF8 exposure resulted in complement activation and inflammatory responses. Co-immunoprecipitation analysis demonstrated that ORF8 binds to C1q specifically by interacting with a 15-peptide region on ORF8 (C37-A51) and the globular domain of C1q subunit A. In conclusion, an ORF8-C1q-dependent complement activation pathway was identified in COVID-19-affected pregnancies, likely contributing to fetal inflammation independently of fetal virus exposure.

Keywords: Classical Complement Activation; Fetal Inflammation; Pregnancy; SARS-CoV-2; Transplacental ORF8.


Conflict of interest statement

Disclosure and competing interests statement The authors declare no competing interests.

Figures

Figure 1
Figure 1. Vertical transmission rate in maternal-fetal biospecimens derived from COVID-19-affected pregnancy cohort.
(A) Overview of the COVID-19 pregnancy cohort (total n = 29). Pregnant women included in the study had negative (Control, n = 6), or positive SARS-CoV-2 diagnoses (COVID-19 n = 23) during the first (n = 2), second (n = 5), or third (n = 16) trimesters of pregnancy. Participants had biospecimens collected at the time of the delivery. Biospecimens collected included (i) biofluid specimens: maternal plasma, newborn blood, cord plasma, and amniotic fluid; and (ii) placental tissues: umbilical cord, chorion, and amnion. The biospecimens underwent ultrasensitive SARS-CoV-2 detection using digital droplet PCR (ddPCR), SARS-CoV-2 ORF8 ELISA, proteomics profile for 97 inflammatory biomarkers, and global transcriptomics profile (~22,000 host genes) by RNAseq. (B) Box and whiskers plot representing average and minimum and maximum values of copies/mL of SARS-CoV-2 N1 and N2 proteins detected maternal plasma (controls, n = 5 for N1; n = 6 for N2; COVID-19, n = 23 for N1/N2), chorion (controls, n = 5 for N1, n = 6 for N2; COVID-19, n = 21), amnion (controls, n = 2 for N1; n = 4 for N2; COVID-19, n = 21), amniotic fluid (controls, n = 3; COVID-19, n = 9), cord plasma (controls, n = 5 for N1, n = 3 for N2; COVID-19, n = 20), newborn plasma (controls, n = 0; COVID-19, n = 12) from controls and COVID-19-affected pregnancies. (C) Bar charts representing the percentage of samples positive (purple bar) and negative (blue bar) from SARS-CoV-2 in the biospecimens analyzed. Pie chart representing the total SARS-CoV-2 positivity considering at least one fetal-skewed specimen. Cut-off value defined as counts/mL3 ≥ 2. (D) Stacked bar charts (mean with SD) representing the levels of viral RNA of samples positive for SARS-CoV-2 in the fetal compartment, according to the trimester of pregnancy that maternal SARS-CoV-2 occurred (First trimester, n = 2; Second trimester, n = 5 and Third trimester, n = 16). Source data are available online for this figure.
Figure 2
Figure 2. Gestational exposure to SARS-CoV-2 leads to a differential immune response at the placental barrier.
(A) Graphical representation of tissues analyzed for global transcriptomics: chorion (Control, n = 5; COVID-19 n = 21) and amnion (Control, n = 3; COVID-19 n = 18). (B) tSNE and Volcano plot of global transcriptomics of COVID-19 chorion relative to controls. (C) tSNE and Volcano plot of global transcriptomics of amnion obtained from COVID-19-affected pregnancies relative to controls. (D) Comparative analysis of DEGs (−2 < FC > 2, p < 0.05) in chorion and amnion from COVID-19-affected pregnancies. For (BD), significantly differentially expressed genes between the groups analyzed were identified in Partek Flow by fold-change ≥|2| and FDR-adjusted p-value < 0.05 using the Gene set Analysis (GSA) method. (EG) Bar plot representing gene ontology of upregulated biological pathways in (E) both COVID-19+ amnion and chorion, (F) only in amnion, and (G) only in chorion. Odds ratio and p-values were calculated using Enrichr gene set enrichment analysis. (H) Heatmap illustrating the expression of previously detected genes related to inflammation, interferon, and chemokines in chorion and amnion from COVID-19 affected pregnancies. Fold change was calculated using raw transcript counts minus the mean and divided by the standard deviation of depicted transcripts in the chorion and amnion tissues. (I, J) Network analysis of DEGs exclusive to (I) COVID-19 chorion (n = 21) and (J) COVID-19 amnion (n = 20). Violin plots representing the fold change values for individual genes related to (I) antiviral response and (J) chemotactic response in chorion and amnion. All data relative to controls. Fold change calculated by individual expression divided by average expression of controls. Data are presented as means ± SEMs, using Mann–Whitney U test (p < 0.05). Source data are available online for this figure.
Figure 3
Figure 3. Complement activation and inflammation in the fetal compartment of COVID-19-affected pregnancies.
(A) Graphical representation of tissues analyzed for proteomics: umbilical cord plasma (Control, n = 5; COVID-19 = 18), and amniotic fluid (Control, n = 3–7; COVID-19 n = 8). (B) Heatmap illustrating the levels of proteins related to complement and inflammatory cytokines in the control and COVID-19 groups quantified in amniotic fluid. (C) Graphical representation of complement activation by non-self-antigens through alternative, classic, and lectin pathways and the role of proteins analyzed. (DG) Violin plots representing levels of individual proteins related to complement and pro-inflammatory cytokines in amniotic fluid (D and E, respectively) and cord plasma (F and G, respectively) for control (n = 3) and COVID-19 (n = 8) groups. Data are presented as means ± SEMs pg/mL, using Mann–Whitney U test (p < 0.05). Source data are available online for this figure.
Figure 4
Figure 4. Transplacental ORF8 is associated with augmented complement and inflammation in the fetal compartment of COVID-19-affected pregnancies.
(A) Graphical representation of samples analyzed for ORF8 quantitative and qualitative ELISA: maternal plasma (Control, n = 4; COVID-19, n = 23), umbilical cord plasma (Control, n = 4; COVID-19, n = 20), and amniotic fluid (Control, n = 3; COVID-19, n = 8). ORF8 levels in samples from control and COVID-19-affected pregnancies. Data are presented in violin plots showing the median (middle line) and describe numerical data distributions using density curves. Values are represented in ng/mL with cut off 1.7 ng/mL in maternal plasma, cut off of 13.4 ng/mL in umbilical cord plasma and cut off of 36.1 ng/mL in amniotic fluid. (B) Pie charts illustrating qualitative analysis of ORF8 ELISA. (C) Stacked bars representing the circulating ORF8 according to trimester of SARS-CoV-2 infection (First trimester, n = 2; Second trimester, n = 4; Third trimester, n = 10). (D) Boxplots representing levels of anti-Spike S1 IgM with cut off of 2720 ng/mL and anti-Nucleocapsid IgG with cut off of 6420 ng/mL in maternal plasma (n = 22) and newborn cord plasma (n = 15) from COVID-19-affected pregnancies. Data are presented in boxplot, middle line represents means, the bound of box represent interquartile range, and whiskers represent maximum and minimum values. (E) Comparative analysis of DEGs (−2 < FC > 2, p < 0.05) in COVID-19 amnion ORF8 negatives and positives. (F) Bar plot representing gene ontology of upregulated biological pathways in COVID-19 amnion ORF8 positive group. (G, H) Violin plots representing the fold change values for individual genes related with (G) complement (ORF8 (−), n = 5–6; ORF8 (+), n = 9–10) and (H) inflammation in amnion (ORF8 (−), n = 5–7; ORF8 (+), n = 8–11) transcriptomics. (I) Comparative analysis of differentially expressed proteins (DEPs) (p < 0.05) in COVID-19 amniotic fluid ORF8 negatives (n = 4) and positives (n = 8). Bubble plot of DEPs upregulated exclusively in COVID-19 amniotic fluid ORF8 positive group. (J) Comparative analysis of DEGs in COVID-19 umbilical cord ORF8 negatives and positives. (K) Bar plot of gene ontology biological pathways associated with DEGs upregulated exclusively in COVID-19 umbilical cord ORF8 positive. (L) Violin plots representing the fold change values for individual genes related to complement in umbilical cord transcriptomics. (M) Amnion serial sections were analyzed by immunohistochemistry for detection of SARS-CoV-2 ORF8 and C3b. From left to right, tissues stained with (i) Hematoxylin and Eosin (H&E) (hematoxylin—purple, eosin—pink); (ii) Hematoxylin (purple) and the secondary antibody anti-rabbit (Motulsky and Brown, 2006); (iii) Hematoxylin (purple) and anti-ORF8 produced (Motulsky and Brown, 2006); and (iv) Hematoxylin (purple) and anti-C3b (Motulsky and Brown, 2006). Images were taken at 4X magnification. Representative images from three control and three COVID-19 amnions. Fold change calculated by individual expression divided by average expression of control. Violin plots data are presented as means ± SEMs pg/mL, using Mann–Whitney U test (p < 0.05). Comparative analysis relative to controls. Source data are available online for this figure.
Figure 5
Figure 5. Co-localization of ORF8 and C3b in placental tissues derived from COVID-19 pregnancies.
(A) Chorion and (B) amnion serial sections were stained with SARS-CoV-2 ORF8 (red) and C3b (green); or with Krt8/18 (red) and ORF8 (green). Images were taken at 40× magnification. Images are representative of one control and one COVID-19+. Scale bars: 40 μm. Source data are available online for this figure.
Figure 6
Figure 6. SARS-CoV-2 ORF8 treatment on placental trophoblasts triggers complement activation and inflammation.
(A) Graphical representation detailing the placental cell culture models for in vitro SARS-CoV-2 ORF8 treatment. (B) Boxplots representing the fold change values of gene expression for individual genes, obtained from standardization of in vitro SARS-CoV-2 ORF8 treatment with 10 ng/mL, 20 ng/mL, or 100 ng/mL for 8 h from eight independent experiments (n = 8) and 16 h from eleven independent experiments (n = 11) on immortalized trophoblasts (HTR8/SVneo cells). Fold change calculated by DDCt method, relative to mock. Data are presented in boxplot where the middle line represent means, the bound of box represent interquartile range, and whiskers represent maximum and minimum values in ng/mL, using one-way ANOVA Kruskal–Wallis with uncorrected Dunn’s test. (CE) Relative expression of genes associated with complement activation in the placental cell culture models treated with 20 ng/mL of SARS-CoV-2 ORF8 for 8 h. The models included (C) HTR8/SVneo cells (mock, n = 6–8; and ORF8, n = 7–8) (D) primary human villous trophoblasts (HVT) (mock, n = 4–5; and ORF8, n = 4–5), and (E) iPSC-derived trophoblasts (mock, n = 5–6; and ORF8, n = 6). Relative expression was calculated by DCt method using GAPDH as the normalizing gene. Mann–Whitney U test was used for analysis. (F) Boxplots representing the percentage of C3b + HTR8/SVneo cells treated with SARS-CoV-2 ORF8 for 30 min (mock, n = 5; and ORF8, n = 6), 8 h (mock, n = 4; and ORF8, n = 4) or 16 h (mock, n = 4; and ORF8, n = 4). Data are presented in boxplot, middle line represents means, the bound of box represent interquartile range, and whiskers represent maximum and minimum values. (G) Violin plots representing the levels of complement proteins in the supernatant of HTR8/SVneo cells treated with SARS-CoV-2 ORF8 for 8 h (mock, n = 5–6; and ORF8, n = 6) or 16 h (mock, n = 4–5; and ORF8, n = 6). Mann–Whitney U test was used for analysis (p < 0.05). Immortalized pluripotent stem cells (iPSC). Source data are available online for this figure.
Figure 7
Figure 7. SARS-CoV-2 ORF8 binds specifically to globular domain of complement C1q subcomponent subunit A in placental trophoblasts.
(A) Line chart representing absorbance values obtained in the SARS-CoV-2 ORF8 - C1q in vitro binding assay using different molarities of C1q (5, 10, 20, and 50 nM) and SARS-CoV-2 ORF8 (0, 20, 40, 60, 80, and 100 nM). Absorbance calculated by discounting the blank (0 nM C1q). (B) Co-immunoprecipitation of SARS-CoV-2 ORF8 with C1qA, C1qB and C1qC. Graphical representation of the plasmid constructs containing the expression cassettes for the subcomponents C1qA, C1qB, and C1qC contained an N-terminal signal peptide (SP), and a C-terminal FLAG tag. Western blot images for co-immunoprecipitation using an anti-ORF8 antibody. (C) Co-immunoprecipitation of C1qA full-length (FL), globular (G), disordered domain (D) with SARS-CoV-2 ORF8. Graphical representation of the plasmid constructs containing expression cassettes for the C1qA-FL, C1qA-G, and C1qA-D, with N-terminal SP and a C-terminal 3FLAG tag, cloned in pIRES vectors. Western blot images for co-immunoprecipitation using an anti-ORF8 antibody. Co-immunoprecipitated product (IP). Whole-cell lysate (WCL). Source data are available online for this figure.
Figure 8
Figure 8. Fifteen-aa residues of SARS-CoV-2 ORF8 are sufficient to bind C1q and elicit complement activation in placental trophoblasts.
(A) Line chart of absorbance values obtained in the SARS-CoV-2 ORF8 peptides - C1q binding assay using different molarities of C1q (10, 20, and 50 nM) and 1 mM of 28 different peptides spanning SARS-CoV-2 ORF8 region. Absorbance calculated by discounting the blank (0 nM C1q). (B) The ORF8 peptides presenting dose-dependent binding with C1q (#4 red, #10 purple, #19 blue, and #25 yellow) in molecular binding model between SARS-CoV-2 ORF8 dimers and C1qA-Globular (model 1). (C) Bar charts representing docking and confidence scores for in silico docking models SARS-CoV-2 ORF8 and C1qA-G. The ORF8 peptides #4, #10, #19, and #25 represented on amino acid (aa) sequence alignment of docking models. (D) Representative docking poses of the globular domain of C1q (PDB ID: 1PK6) with SARS-CoV-2 ORF8 protein (PDB ID:7JTL) in 2D interaction diagrams. The ORF8 and C1q residues with significant interactions from each protein are highlighted, labeled, and properly annotated. The hydrogen bonds, pi-pi, and salt bridges formed between ORF8 and C1q are also shown by colored dash or arrow lines. The polar (turquoise), hydrophobic (green), positively charged (purple), and negatively charged (orange) residues are represented in colored spheres. Shown below each of the interaction diagrams is a table of interacting or contact residues between the SARS-CoV-2 ORF8 protein and the globular C1q domain, including their aa positions, aa distance measured in Angstrom (Å), and the corresponding specific binding interactions. (E) Boxplots representing the relative expression of genes analyzed in HTR8/SVneo trophoblast treated with ORF8 peptides #4, #10, #19, and #25 using 0.1 nM and 1 nM (n = 5–6) or mock (n = 7–10). (F) Boxplots representing the relative expression of genes analyzed in primary human villous trophoblast (HVT) treated with 0.1 nM and 1 nM of ORF8 peptide #10 or Mock. Relative expression was calculated by DCt method using GAPDH as the normalizing gene. (G) Boxplots representing the percentage of live C3b+ cells in mock (n = 4) and ORF8 peptides #4, #10, #19, and #25 0.1 nM and 1 nM treated (n = 4–6) HTR8/SVneo trophoblasts. Data are presented in boxplot, middle line represents means, the bound of box represents interquartile range, and whiskers represent maximum and minimum values. (H) Graphical representation of main results. Comparisons using one-way ANOVA Kruskal–Wallis with Fisher test (p < 0.05). Source data are available online for this figure.
Figure EV1
Figure EV1. Complement-associated inflammatory responses in umbilical cord delivered from COVID-19-affected pregnancies.
(A) tSNE plot of global transcriptomics for chorion of controls (emerald) and COVID-19 (purple). Volcano plot representing genes upregulated (red dots) and downregulated (blue dots) in the umbilical cord of COVID-19 relative to controls. (B) Bar plot representing gene ontology biological pathways associated with upregulated DEGs in the umbilical cord of COVID-19 relative to controls. (C) Violin plots representing the expression count values for individual genes related to complement activation in control (n = 5–6) and umbilical cords from COVID-19-affected pregnancies (n = 19). (D) Network analysis of DEGs in umbilical cords from COVID-19-affected pregnancies relative to controls. (E) Violin plots representing the expression count values for individual genes related to complement-associated inflammation in control (n = 6) and umbilical cords from COVID-19-affected pregnancies (n = 19). (F) Comparative analysis of DEGs (−2 < FC > 2, p < 0.05) in COVID-19 umbilical cord and amnion transcriptomics, depicting genes related to complement and complement-associated inflammation. Upregulated genes in red, downregulated genes in blue. Data are presented as means ± SEMs, using Mann–Whitney U test (p < 0.05). Source data are available online for this figure.
Figure EV2
Figure EV2. Comparison analysis of placental tissue transcriptomics and biofluids proteomics derived from COVID19-affected pregnancies at delivery.
Graphical representation of (A) upregulated and (B) downregulated differentially expressed genes/proteins in tissue transcriptomics (Chorion, n = 21 and; Amnion, n = 18) and biofluid proteomics (Amniotic fluid, n = 8; and Cord plasma, n = 20) from COVID-19 affected pregnancies. (C) Comparative analysis of upregulated genes/proteins in amniotic fluid and cord plasma from COVID-19-affected pregnancies. (D) Commonly upregulated pathways in amniotic fluid and cord plasma from COVID-19-affected pregnancies. (E, F) Bubble plots representing upregulated biological process in (E) Amniotic fluid and (F) cord plasma. Strength and False discovery rate (FDR) were calculated using STRING database pathway analysis. Source data are available online for this figure.
Figure EV3
Figure EV3. Chorion tissues from COVID-19-affected pregnancies exhibited augmented complement activation at ORF8-positive sites.
(A) Chorion serial sections were analyzed by immunohistochemistry for detection of SARS-CoV-2 ORF8 and C3b. From left to right, tissues stained with (i) Hematoxylin (purple) and the secondary antibody anti-rabbit (Motulsky and Brown, 2006); (ii) Hematoxylin (purple) and anti-ORF8 produced (Motulsky and Brown, 2006); and (iii) Hematoxylin (purple) and anti-C3b (Motulsky and Brown, 2006). Images were taken at 20X magnification. Representative images from two control and two COVID-19 chorion specimens. Source data are available online for this figure.
Figure EV4
Figure EV4. Confirmed colocalization of ORF8 and C3b in chorion and amnion tissues from COVID-19-affected pregnancies by fluorescence signals.
(A) Chorion and (B) amnion serial sections were stained with SARS-CoV-2 ORF8 (red) and C3b (green). Mander’s and Pearson’s correlations coefficient between SARS-CoV-2 ORF8 and C3b. White circles represent the colocalization areas analyzed. Images were taken at 40x magnification. Images are representative of one COVID-19+ pregnancy. Scale bars: 40 μm. Source data are available online for this figure.
Figure EV5
Figure EV5. Phenotypic characterization of trophoblast delivered from iPSCs.
(A) Boxplot showing the levels of human chorionic gonadotropin (hCG) in the supernatant of iPSC-derived trophoblasts cultures at day 0 and day 7 of differentiation. Data are presented in boxplot, middle line represents means, the bound of box represent interquartile range, and whiskers represent maximum and minimum values in mUI/mL from six independent experiments (n = 6). (BE) Bar plots representing expression of genes associated as phenotypic markers in the iPSC-derived trophoblasts cultures (n = 6) at day 0 and day 7 of differentiation. (B) iPSC-associated transcripts—POU5F1, (C) CTB-associated transcripts—KRT7, CDX2, and TP63, (D) STB-associated transcripts—CGA, CGB, and PSG4, and (E) EVT-associated transcripts—HTRA4, and HLAG. Data are presented in scatter dot plot, line represent means, and whiskers standard derivation. Relative expression was calculated by DCt method using GAPDH as the normalizing gene. Data are presented as means ± SDs. Immortalized pluripotent stem cells (iPSC). Cytotrophoblast (CTB). Syncytiotrophoblasts (STB). Extravillous trophoblasts (EVT). POU Domain, Class 5, Transcription Factor 1 (POU5F1). Kerantin 7 (KRT7). Caudal Type Homeobox 2 (CDX2), Tumor Protein P63 (TP63). Glycoprotein Hormones, Alpha Polypeptide (CGA). Chorionic Gonadotropin Subunit Beta (CGB). Pregnancy Specific Beta-1-Glycoprotein 4 (PSG4). High-Temperature Requirement Factor A4 (HTRA4). Major Histocompatibility Complex, Class I, G (HLAG). Mann–Whitney U test was used for all analysis (p < 0.05). Source data are available online for this figure.
Figure EV6
Figure EV6. SARS-CoV-2 ORF8 binds to globular domain of complement C1q subcomponent subunit A in HEK 293T cells.
(A) Co-immunoprecipitation of SARS-CoV-2 ORF8 with C1qA, C1qB, and C1qC. Graphical representation of the plasmid constructs containing the expression cassettes for the subcomponents C1qA, C1qB, and C1qC contained an N-terminal signal peptide (SP), and a C-terminal FLAG tag. Western blot images for co-immunoprecipitation using an anti-ORF8 antibody. (B) Co-immunoprecipitation of C1qA full-length (FL), globular (G), disordered domain (D) with SARS-CoV-2 ORF8. Graphical representation of the plasmid constructs containing expression cassettes for the C1qA-FL, C1qA-G, and C1qA-D, with N-terminal SP and a C-terminal 3FLAG tag, cloned in pIRES vectors. Western blot images for co-immunoprecipitation using an anti-Flag antibody. Co-immunoprecipitated product (IP). Whole-cell lysate (WCL). Source data are available online for this figure.
Figure EV7
Figure EV7. Correlation analyses between the number of days post-infection to delivery and levels of SARS-CoV-2 N1/N2 RNA or circulating ORF8 in COVID-19 pregnancies.
Correlation analyses between the number of days post SARS-CoV-2 infection to delivery and (A) SARS-CoV-2 N1 RNA copies, SARS-CoV-2 N2 RNA copies, and (B) circulating ORF8 levels in all biospecimens analyzed, including maternal plasma, chorion, amnion, cord plasma and newborn plasma. Simples linear regression and Spearman’s rank correlation test was used for all the correlations analysis. Scatter plots with Pearson correlation coefficients (r) and dotted lines represent 95% confidence intervals. Source data are available online for this figure.
Figure EV8
Figure EV8. Structural and sequence analysis of SARS-CoV-2 ORF8 and human immunoglobulin genes reveals conservation and functional insights.
(A) Sequence alignment of SARS-CoV-2 ORF8 and human immunoglobulin variable lambda chain (IGLV) genes. Representative amino acid residues of SARS-CoV-2 ORF8-specific region located at the loop flanking β4- β5 strands were compared with a portion of the framework 3 (FR3) region of the variable light chain of human IGLV5-39*01, IGLV5-39*02, and IGLV1-47*01 germline gene sequences. Identical residues were highlighted in red box and marked by an asterisk (*), while semi-conserved positions due to minor structural differences are in blue boxes and are indicated by a period (.). The β strands are shown by green arrows above the ORF8 sequence while the spanning loops were represented by black lines (Flower et al, 2021). The FR3 region (shown in the yellow box) was defined according to the IMGT delimitations. (B) Comparison of the overlapping sequences of SARS-CoV-2 ORF8 and human IGLV genes highlighted in the dashed boxes using peptide properties: buried index, hydrophobicity, polarity, and turn and helix propensity. The legend for each property is shown as a gradient color scheme on the right. (CE) Structures of ORF8 (C), IGLV5-39*01 (D), and superimposed images after pairwise structural alignment as viewed from the top (left) and side (right). PBD entries: 7JTL (SARS-CoV-2, blue) and 2CD0 (human IGLV5-39, green). Overlapping sequences between the two structures are highlighted in red. (F) Pairwise structural alignment of the human IgG-Fc region (cyan, PDB ID:1FC1) and ORF8 (in blue) showing close structural similarity at the CH2 domain (193 atoms aligned; RMSD: 5.9 Å). The CH2 and CH3 domains are highlighted, while residues in red sphere show the neonatal Fc receptor (FcRn) interaction site. (G) Superimposition of CH2 domain of the human IgG-Fc and ORF8 from different rotational perspectives. CH2 residues with the closest folding to ORF8 (blue) is shown in flesh while CH3 are in cyan. The glycosylation site at N297 at the CH2 interface is shown in cyan stick models.

References

    1. Amari Chinchilla K, Vijayan M, Taveras Garcia B, Jim B (2020) Complement-mediated disorders in pregnancy. Adv Chronic Kidney Dis 27:155–164 - PubMed
    1. Assadizadeh M, Azimzadeh Irani M (2023) Oligomer formation of SARS-CoV-2 ORF8 through 73YIDI76 motifs regulates immune response and non-infusion antiviral interactions. Front Mol Biosci 10:1270511 - PMC - PubMed
    1. Azamor T, Cunha DP, Nobre Pires KS, Lira Tanabe EL, Melgaco JG, Vieira da Silva AM, Ribeiro-Alves M, Calvo TL, Tubarao LN, da Silva J et al (2024) Decidual production of interferon lambda in response to ZIKV persistence: clinical evidence and in vitro modelling. Heliyon 10:e30613 - PMC - PubMed
    1. Berman HM, Westbrook J, Feng Z, Gilliland G, Bhat TN, Weissig H, Shindyalov IN, Bourne PE (2000) The Protein Data Bank. Nucleic Acids Re 28:235–242 - PMC - PubMed
    1. Blasco Santana L, Miraval Wong E, Álvarez-Troncoso J, Sánchez García L, Bartha JL, Regojo-Zapata RM (2021) Maternal and perinatal outcomes and placental pathologic examination of 29 SARS-CoV-2 infected patients in the third trimester of gestation. J Obstet Gynaecol Res 47:2131–2139 - PMC - PubMed

MeSH terms